


| Followers | 0 |
| Posts | 148553 |
| Boards Moderated | 7 |
| Alias Born | 03/10/2004 |
Thursday, May 16, 2019 8:14:46 AM
The Ord Oracle
By: Tim Ord | May 15, 2019
SPX Monitoring purposes; Sold long SPX on 5/13/19 at 2811.87 = loss 2.05%; Long 5/9/19 at 2870.72.
Monitoring purposes Gold: Long VanEck Vectors Gold Miners ETF (NYSE:GDX) on 1/29/19 at 21.96.
Long-term Trend SPX monitor purposes; Sold long SPX on 5/6/19 at 2932.61= gain 5.96%:
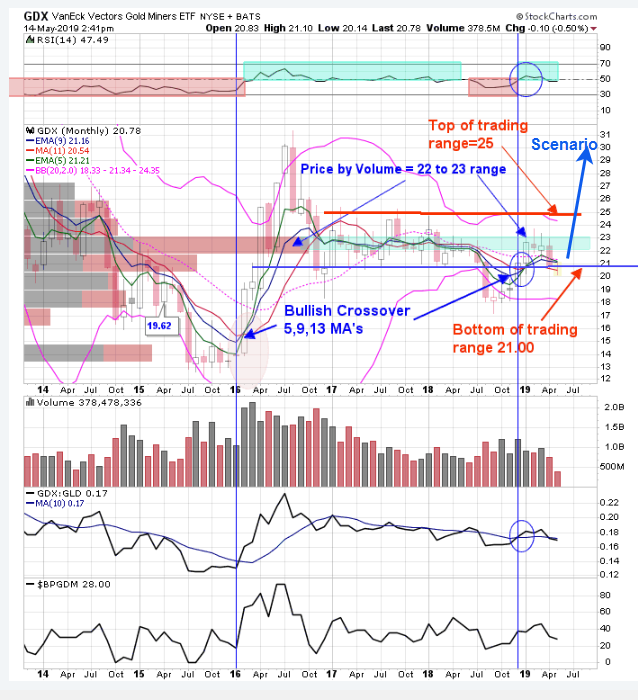
Above is the monthly VanEck Vectors Gold Miners ETF (NYSE:GDX) chart. We have a 5, 9, 13 period moving average on the monthly GDX chart going back to 2014. A bullish crossover occurred back in January which is still in force. The bottom of the trading range in 2017 comes in near 21.00 range. GDX fell below this level in August 2018 and than closed above it in December 2018 creating a bullish “Shakeout” (false breakout). When a down side “Shakeout” occurs the market normally breakouts to the top side, which would imply a break above the top of the trading range near 25.00. GDX is now back testing the support near 21.00 and appear to be finding support. There is a “Price by Volume” level between 22.00 to 23.00 range which GDX run into in February and March which stopped the advance. Once through this level it should provide support. GDX has been in a low volatility state since 2017 and bigger swings should start to develop in the coming months. After the current back test is completed, an impulse wave higher may begin that could last into October. Long GDX on 1/29/19 at 21.97.
Read Full Story »»»
• DiscoverGold
Click on "In reply to", for Authors past commentaries
Information posted to this board is not meant to suggest any specific action, but to point out the technical signs that can help our readers make their own specific decisions. Your Due Dilegence is a must!
• DiscoverGold
Recent GDX News
- Precious metals shares climb as U.S. tariffs extend to certain gold bars • IH Market News • 08/08/2025 01:45:14 PM


