


| Followers | 0 |
| Posts | 148553 |
| Boards Moderated | 7 |
| Alias Born | 03/10/2004 |
Wednesday, February 20, 2019 11:24:19 AM
The Ord Oracle
By: Tim Ord | February 20, 2019
SPX Monitoring purposes; Sold SPX on 2/12/19 at 2744.73 gain 1.36%; long 2707.89 on 2-8-19.
Monitoring purposes Gold: Long GDX on 1/29/19 at 21.96.
Long-term Trend SPX monitor purposes; Long SPX on 10-19-18 at 2767.78
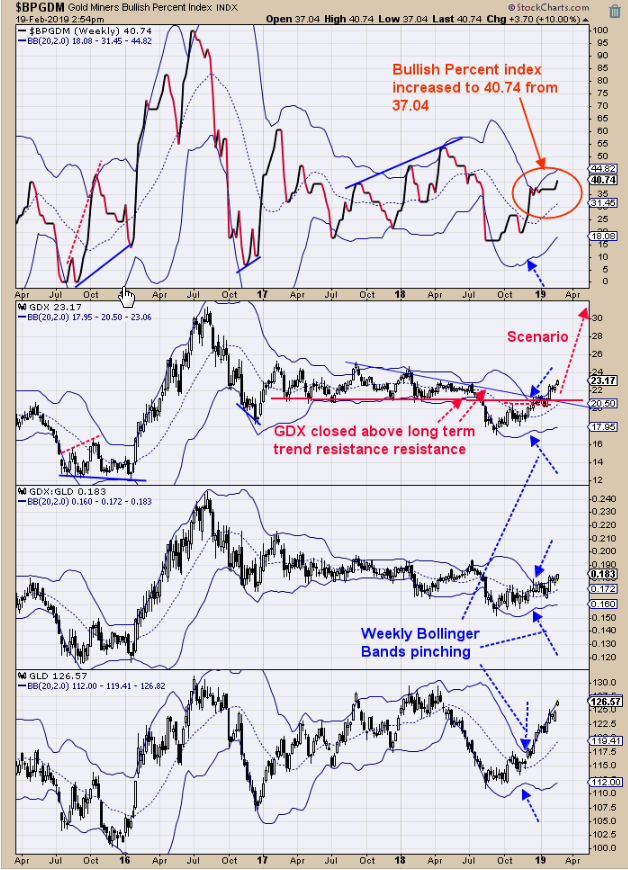
The top window is the weekly Bullish Percent index for the Gold miner’s index. The bullish percent index measures the percent of stocks that are on point and figure buy signals. The recent jump from 37.04% to 40.74% is a jump in the right direction and should see more stocks participate in the coming weeks. Back in December we pointed out the Bollinger® bands where “pinching” on GDX, GDX/GLD and GLD and suggested a large move was in the making and it turns out the large move has started to the upside. A “flag” pattern formed on the daily GDX (not Shown) that ended last week and an impulse wave up has started. Its common for “Flag” patterns to form at the half wave point of the move which would give a target on GDX near 24.50 range as the next resistance area. GDX, GLD and GDX/GLD have all been trading in a consolidation for two years and after a consolidation an impulse wave starts and it appears that impulse wave up has started that could last two years or longer, enjoy the ride. Long GDX on 1/29/19 at 21.97.
Read Full Story »»»
• DiscoverGold
Click on "In reply to", for Authors past commentaries
Information posted to this board is not meant to suggest any specific action, but to point out the technical signs that can help our readers make their own specific decisions. Your Due Dilegence is a must!
• DiscoverGold
Recent GDX News
- Precious metals shares climb as U.S. tariffs extend to certain gold bars • IH Market News • 08/08/2025 01:45:14 PM


