


| Followers | 0 |
| Posts | 148553 |
| Boards Moderated | 7 |
| Alias Born | 03/10/2004 |
Friday, December 07, 2018 8:00:08 AM
The Ord Oracle
By: Tim Ord | December 6, 2018
SPX Monitoring purposes; Long SPX on 10/22/18 at 2755.88.
Monitoring purposes GOLD: sold 11/27/18 at 18.88=gain .075%; Long GDX at 18.72 on 8/17/18
Long Term Trend SPX monitor purposes; Long SPX on 10-19-18 at 2767.78
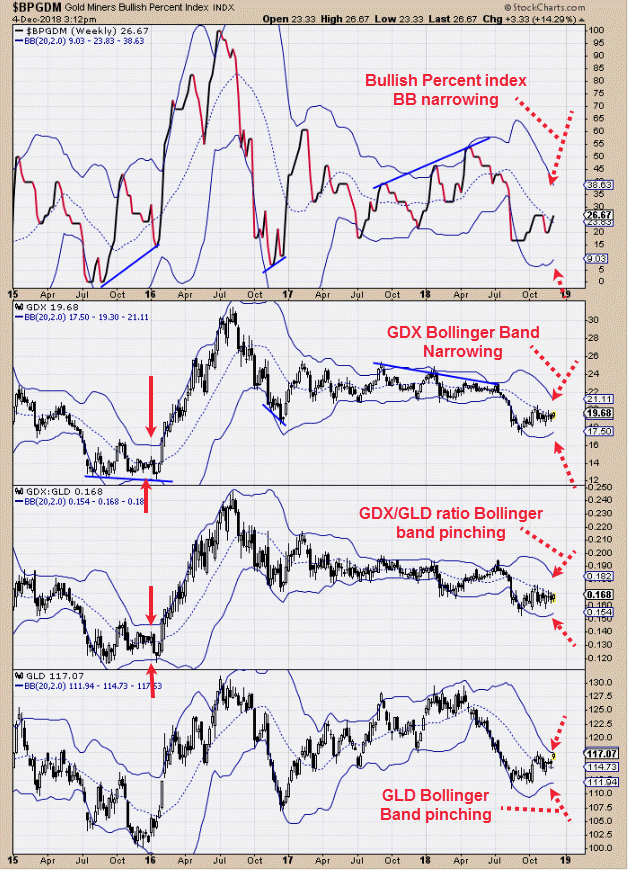
The above is the weekly charts for “Bullish Percent Index for Gold Miners,” GDX, GDX/GLD ratio and GLD (EFT for Gold, bottom window). Again this is the weekly charts. What these charts have in common is the weekly Bollinger bands are pinching in all cases, suggesting a large move is coming. Since these charts are on the weekly timeframe, several more weeks of “pinching” is possible before the large move is realized. The last time that the weekly Bollinger Band pinched to this degree on GDX, the GDX/GLD ratio came back at the 2015 bottom. Both indexes had a “Head fake’ to the downside before reversing higher. We don’t have a signal here, but one could develop in the coming weeks. Last Friday’s Gold COT report reported that commercials are 16K short and remain on the bullish side for gold. We sold our long GDX position (11/27/18) at 18.88 for a .075% gain; Long GDX at 18.72 on 8/17/18. We will wait for the next bullish setup.
Tim Ord,
Editor
Read More »»»
• DiscoverGold
Click on "In reply to", for Authors past commentaries
Information posted to this board is not meant to suggest any specific action, but to point out the technical signs that can help our readers make their own specific decisions. Your Due Dilegence is a must!
• DiscoverGold
Recent GDX News
- Precious metals shares climb as U.S. tariffs extend to certain gold bars • IH Market News • 08/08/2025 01:45:14 PM


