


| Followers | 0 |
| Posts | 148553 |
| Boards Moderated | 7 |
| Alias Born | 03/10/2004 |
Tuesday, January 05, 2016 9:16:03 AM
Peek Into Future Through Futures
* January 5, 2016
The following are futures positions of non-commercials as of December 29, 2015. Change is week-over-week. (Due to New Year’s Day last week, the CFTC released numbers on Monday, instead of last Friday.)
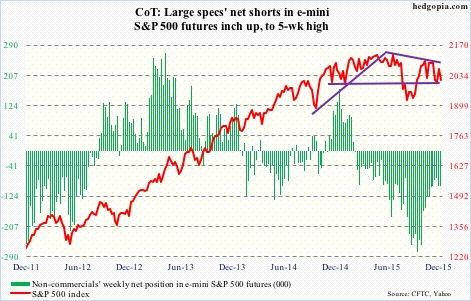
E-mini S&P 500: For the first time in five weeks, U.S.-based equity funds attracted inflows in the week ended last Wednesday, amounting to $10 billion (courtesy of Lipper). This was after $30.3 billion left these funds in the prior four weeks.
With this, a total of $8.6 billion has been withdrawn since September 30th. This is a good reference point as stocks in general, including the S&P 500 index, bottomed on the 29th of that month.
The lack of flows was evident in how December performed. It was the first back-to-back down Decembers since 1981/’82. A record!
After three years of double-digit gains, the S&P 500 dropped 0.7 percent in 2015. Another record! For the first time in 145 years, a year ending in 5 ended up in the red column. The last time this happened was in 1875 – down 3.7 percent (courtesy of @RyanDetrick, a must-follow). The year 1895 came close – up a mere 0.5 percent.
As a matter of fact, 2015 could have very much ended up like 1895. By December 30th, 2015 was up 0.22 percent. The next session – the year’s last –was a volatile session. Down, up and then down on a five-minute chart. At one point during the session – shortly after noon – the S&P 500 was up 0.18 percent for the year. Then gradually it gave up the gains, and then some.
Enough looking through the rearview mirror. On to the windshield.
Once again, @RyanDetrick points out that the S&P 500 has not been down the first day of the year three straight years since 1999-2001. The index was lower the past two years – down 0.89 percent and 0.03 percent, respectively. Yesterday, stocks were taken to the woodshed, with the S&P 500 down 1.5 percent.
The index has been trapped within a descending channel for a couple of months now. The upper end of the channel lies at 2090, which was not even tested last week, although it came close. With the drop yesterday, support at both 2040 and 2020 has been lost.
If there is any consolation in yesterday’s price action, it is that 1990, a must-hold, was tested and held. This is where the low end of that channel lies as well. Remains to be seen if bulls can build on this. They seem to be swimming upstream.
Currently net short 97.2k, up 1.9k.
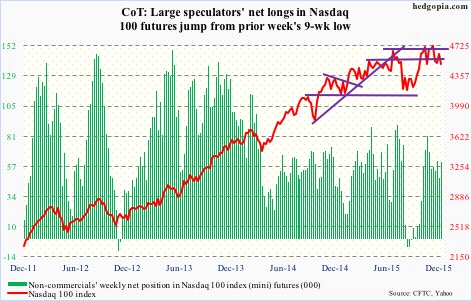
Nasdaq 100 index (mini): Tech-heavy indices fared well last year, with the Nasdaq 100 up 8.4 percent and the Nasdaq composite up 5.7 percent. In contrast, the S&P 500 fell 0.7 percent and the Dow Industrials lost 2.2 percent.
The tech outperformance is laudable until we consider this. The so-called FANG propelled these indices. Facebook (FB) rallied 34.2 percent, Amazon (AMZN) 117.8 percent, Netflix (NFLX) 134.4 percent, and Alphabet (GOOGL, formerly Google) 46.6 percent.
In the Nasdaq 100, these four names are respectively weighted 4.3 percent, 5.5 percent, 0.9 percent, and 4.6 percent. At 12.9 percent, the largest weight goes to Apple (AAPL), which lost three percent last year. Technically, it has broken its June 2013 trend line. And, there is potentially a head-and-shoulders pattern forming on a weekly chart, with the neckline break occurring around $105, where it sat on Thursday and was broken intra-day yesterday, but was salvaged by close. AAPL remains grossly oversold on a daily basis, let us see if bulls can take advantage of this as well as yesterday’s reversal.
Further, it is hard to imagine the FANG names – particularly AMZN and NFLX – repeat their performance this year. Can energy – last year’s laggards – provide the leadership? XLE, the SPDR Energy ETF, lost 21.5 percent in 2015. Even if it does, it does not help the Nasdaq 100 much.
For some time now, 4560 has proven to be an important price point, and was lost yesterday; the index did, however, manage to save the 200-day moving average.
Currently net long 60.9k, up 13k.
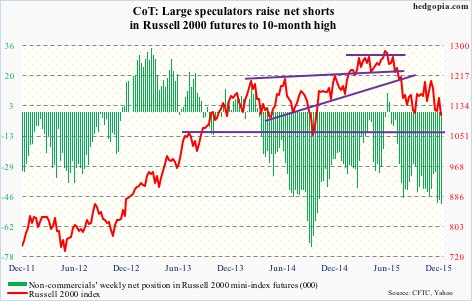
Russell 2000 mini-index: If we are indeed in a sustained tightening cycle in the U.S., then small-caps will probably continue to lag large-caps. In 2015, the Russell 2000 index lost 5.7 percent, lagging large-caps big time.
If small-caps were any indication, investors were not in risk-on mode last year. This is the same as high-yielding stocks lagging dividend growth stocks, or, for that matter, debt-heavy stocks over cash-rich.
How about 2016?
Well, the year has not gotten off to a good start, and 2015 did not end well.
Early last month, the 1210-1215 resistance, which has been in place since March 2014, held firm, with the index subsequently also losing 1170.
The 200-day moving average is decidedly pointing lower, with the 50-day flat to slightly down.
The index is now down 14-plus percent from the July 2015 high.
Kudos to non-commercials for having nailed this. Net shorts are at a 10-month high.
Currently net short 49.6k, up 2.4k.
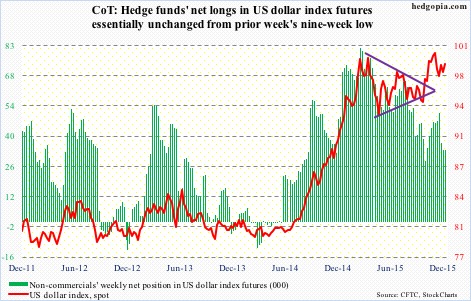
US Dollar Index: Gained nine percent in 2015, its third straight year of gains.
At least going by non-commercials’ holdings, it is tough to argue the streak continuing in 2016.
Back in March last year, the dollar index reached a high of 100.71, before coming under pressure. Then in November, it tested that high by rallying to 100.60. Non-commercials were net long a lot more contracts in March than they were in November. That is not a vote of confidence from these traders.
In the prior week, they cut back net longs to a nine-week low.
Currently net long 33.6k, up 208.
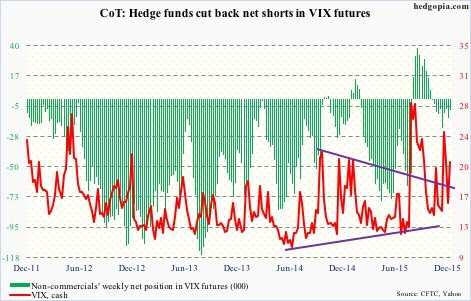
VIX: In the prior week, spot VIX was acting like it wanted to rally. That it has… continued to do so yesterday.
As recently as the middle of December, the spot shot up to just under 27, before reversing. No such spike-reversal signal just yet. That said, it was unable to hang on to the gains yesterday, as it got slammed in the last half hour. Worth watching for a spike that gets sold.
Currently net short 8.4k, down 5.4k.
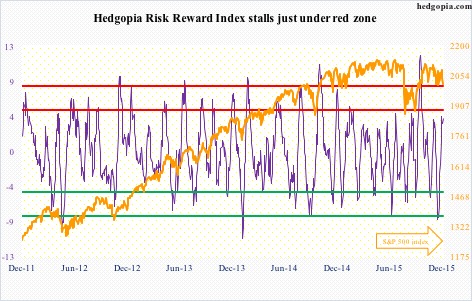
Hedgopia Risk Reward Index
http://www.hedgopia.com/cot-peek-into-future-through-futures-24/
• George.
Click on "In reply to", for Authors past commentaries.
* January 5, 2016
The following are futures positions of non-commercials as of December 29, 2015. Change is week-over-week. (Due to New Year’s Day last week, the CFTC released numbers on Monday, instead of last Friday.)
E-mini S&P 500: For the first time in five weeks, U.S.-based equity funds attracted inflows in the week ended last Wednesday, amounting to $10 billion (courtesy of Lipper). This was after $30.3 billion left these funds in the prior four weeks.
With this, a total of $8.6 billion has been withdrawn since September 30th. This is a good reference point as stocks in general, including the S&P 500 index, bottomed on the 29th of that month.
The lack of flows was evident in how December performed. It was the first back-to-back down Decembers since 1981/’82. A record!
After three years of double-digit gains, the S&P 500 dropped 0.7 percent in 2015. Another record! For the first time in 145 years, a year ending in 5 ended up in the red column. The last time this happened was in 1875 – down 3.7 percent (courtesy of @RyanDetrick, a must-follow). The year 1895 came close – up a mere 0.5 percent.
As a matter of fact, 2015 could have very much ended up like 1895. By December 30th, 2015 was up 0.22 percent. The next session – the year’s last –was a volatile session. Down, up and then down on a five-minute chart. At one point during the session – shortly after noon – the S&P 500 was up 0.18 percent for the year. Then gradually it gave up the gains, and then some.
Enough looking through the rearview mirror. On to the windshield.
Once again, @RyanDetrick points out that the S&P 500 has not been down the first day of the year three straight years since 1999-2001. The index was lower the past two years – down 0.89 percent and 0.03 percent, respectively. Yesterday, stocks were taken to the woodshed, with the S&P 500 down 1.5 percent.
The index has been trapped within a descending channel for a couple of months now. The upper end of the channel lies at 2090, which was not even tested last week, although it came close. With the drop yesterday, support at both 2040 and 2020 has been lost.
If there is any consolation in yesterday’s price action, it is that 1990, a must-hold, was tested and held. This is where the low end of that channel lies as well. Remains to be seen if bulls can build on this. They seem to be swimming upstream.
Currently net short 97.2k, up 1.9k.

Nasdaq 100 index (mini): Tech-heavy indices fared well last year, with the Nasdaq 100 up 8.4 percent and the Nasdaq composite up 5.7 percent. In contrast, the S&P 500 fell 0.7 percent and the Dow Industrials lost 2.2 percent.
The tech outperformance is laudable until we consider this. The so-called FANG propelled these indices. Facebook (FB) rallied 34.2 percent, Amazon (AMZN) 117.8 percent, Netflix (NFLX) 134.4 percent, and Alphabet (GOOGL, formerly Google) 46.6 percent.
In the Nasdaq 100, these four names are respectively weighted 4.3 percent, 5.5 percent, 0.9 percent, and 4.6 percent. At 12.9 percent, the largest weight goes to Apple (AAPL), which lost three percent last year. Technically, it has broken its June 2013 trend line. And, there is potentially a head-and-shoulders pattern forming on a weekly chart, with the neckline break occurring around $105, where it sat on Thursday and was broken intra-day yesterday, but was salvaged by close. AAPL remains grossly oversold on a daily basis, let us see if bulls can take advantage of this as well as yesterday’s reversal.
Further, it is hard to imagine the FANG names – particularly AMZN and NFLX – repeat their performance this year. Can energy – last year’s laggards – provide the leadership? XLE, the SPDR Energy ETF, lost 21.5 percent in 2015. Even if it does, it does not help the Nasdaq 100 much.
For some time now, 4560 has proven to be an important price point, and was lost yesterday; the index did, however, manage to save the 200-day moving average.
Currently net long 60.9k, up 13k.

Russell 2000 mini-index: If we are indeed in a sustained tightening cycle in the U.S., then small-caps will probably continue to lag large-caps. In 2015, the Russell 2000 index lost 5.7 percent, lagging large-caps big time.
If small-caps were any indication, investors were not in risk-on mode last year. This is the same as high-yielding stocks lagging dividend growth stocks, or, for that matter, debt-heavy stocks over cash-rich.
How about 2016?
Well, the year has not gotten off to a good start, and 2015 did not end well.
Early last month, the 1210-1215 resistance, which has been in place since March 2014, held firm, with the index subsequently also losing 1170.
The 200-day moving average is decidedly pointing lower, with the 50-day flat to slightly down.
The index is now down 14-plus percent from the July 2015 high.
Kudos to non-commercials for having nailed this. Net shorts are at a 10-month high.
Currently net short 49.6k, up 2.4k.

US Dollar Index: Gained nine percent in 2015, its third straight year of gains.
At least going by non-commercials’ holdings, it is tough to argue the streak continuing in 2016.
Back in March last year, the dollar index reached a high of 100.71, before coming under pressure. Then in November, it tested that high by rallying to 100.60. Non-commercials were net long a lot more contracts in March than they were in November. That is not a vote of confidence from these traders.
In the prior week, they cut back net longs to a nine-week low.
Currently net long 33.6k, up 208.

VIX: In the prior week, spot VIX was acting like it wanted to rally. That it has… continued to do so yesterday.
As recently as the middle of December, the spot shot up to just under 27, before reversing. No such spike-reversal signal just yet. That said, it was unable to hang on to the gains yesterday, as it got slammed in the last half hour. Worth watching for a spike that gets sold.
Currently net short 8.4k, down 5.4k.

Hedgopia Risk Reward Index

http://www.hedgopia.com/cot-peek-into-future-through-futures-24/
• George.
Click on "In reply to", for Authors past commentaries.
Information posted to this board is not meant to suggest any specific action, but to point out the technical signs that can help our readers make their own specific decisions. Your Due Dilegence is a must!
• gtsourdinis


