


| Followers | 0 |
| Posts | 148553 |
| Boards Moderated | 7 |
| Alias Born | 03/10/2004 |
Tuesday, December 29, 2015 9:07:34 AM
Peek Into Future Through Futures
* December 29, 2015
The following are futures positions of non-commercials as of December 22, 2015. Change is week-over-week. (Due to Christmas last week, the CFTC released numbers on Monday, instead of last Friday.)
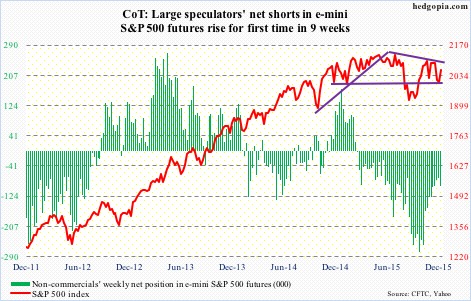
E-mini S&P 500: Outflows continued in the week ended last Wednesday. Another $7.6 billion exited U.S.-based equity funds (courtesy of Lipper). In the past three weeks, north of $29 billion came out of these funds. And since September 30th, $18.6 billion left.
This may be why shorts are beginning to press a little. Short interest on SPY, the SPDR S&P 500 ETF, went up eight percent mid-December, to 312.7 million shares. This is the highest in two months. That said, it is some 28 percent below the high three months ago.
Back then, shorts persistently built into that mid-September high, just when stocks were about to bottom out and rally. Soon followed a squeeze, with SPY short interest dropping to 278 million by the middle of November.
Viewed this way, the present level of short interest is probably not enough to set in motion another squeeze cycle. Besides, as stated earlier, flows are not cooperating.
Seasonality still favors stocks… at least that has been the case historically. But it is also a known seasonal phenomenon, with traders increasingly positioning earlier.
In the very near-term, there is room to rally. Daily overbought conditions still have room left for unwinding. Daily MACD just crossed up.
Here is the rub. With last week’s rally the S&P 500 sat right on its 50- and 200-day moving averages. Come Monday, it lost both. The consolation is that the index yesterday finished substantially off the lows.
The level to watch is 2090 on the way up and 2040 on the way down, followed by 2020 and must-hold 1990.
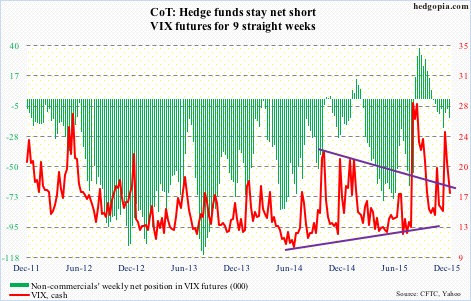
For the first time in nine weeks, non-commercials added to net shorts.
Currently net short 95.2k, up 19.9k.
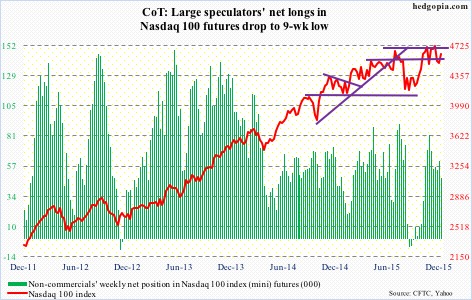
Nasdaq 100 index (mini): The 4560 level continues to act like a magnet. Having lost it in the prior week, the index recaptured the level last week.
There is room for the index to push higher near-term, but here is the thing.
Daily momentum indicators such as the RSI and stochastics have reached the median, and this is where they can turn back if momentum is weak.
Apple (AAPL), which constitutes nearly 13 percent of the index, continues to be a wild card. It remains oversold on a daily chart, but has broken its June 2013 trend line. Moreover, there is potentially a head-and-shoulders pattern forming on a weekly chart, with the neckline break occurring around $105, which was saved last week.
Non-commercials continue to cut back net longs – now at a nine-week low.
Currently net long 47.9k, down 13.6k.
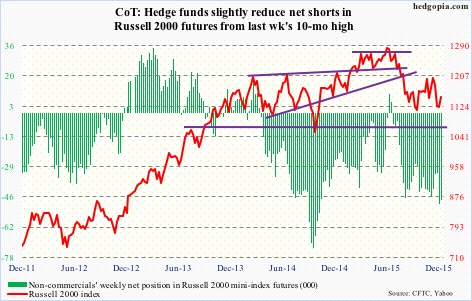
Russell 2000 mini-index: Short interest on IWM, the iShares Russell 2000 ETF, dropped 4.4 percent, to 99.7 million shares – an eight-month low. Since the end of September, it has dropped 24 percent. Between the periods, the Russell 2000 was up a mere 2.8 percent. Not much to write home about.
For a while now, investors/traders have not been showing much love for small-caps.
The 1210-1215 resistance has been in place since March 2014. Most recently, a rally attempt was repelled early this month. Before this gets tested again, small-cap bulls will have to now take out another resistance – 1170, which approximates the 50-day moving average.
The 200-day moving average is now pointing lower, with the 50-day flattish.
Non-commercials, having had bearish bias on small-caps for a while, in the prior week raised net shorts to a 10-month high.
Currently net short 47.2k, down 2k.
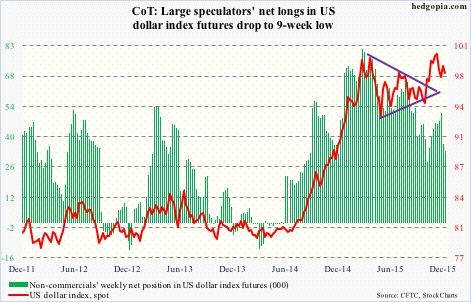
US Dollar Index: The dot plot tells us that FOMC members would wish to hike four times next year. Futures traders are pricing in only two. The dollar index is so far not buying the Fed’s hawkish message.
Back in March, the index reached a high of 100.71, before backing off. Then in November, that high was retested, as it rose to 100.60, before coming under renewed pressure.
Since the FOMC decision in the middle of the month, the dollar index is essentially unchanged, let alone take another stab at the afore-mentioned highs.
Also, non-commercials are nowhere near as net long US dollar index futures as they were back in March. In fact, in a week in which the Fed was all but certain to raise rates, non-commercials reduced net longs by 28 percent.
Last week, they cut back more, with holdings at a nine-week low.
Currently net long 33.4k, down 3.5k.
VIX: It has been a while spot VIX has vacillated around its 50- and 200-day moving averages. Having briefly dipped below 15 last Friday, it, once again, surged past both on Monday, although it was unable to close out the session near the highs.
Daily momentum indicators are oversold, and look to be itching to move higher.
In the meantime, the VIX-to-VXV ratio dropped to 0.8 last Friday – onto oversold zone – before rising to 0.86 yesterday. There is room for it to continue moving higher before it gets to overbought zone, and that could spell trouble for stocks.
Spot VIX’s probable path of least resistance near-term is up.
Currently net short 13.8k, up 6.4k.
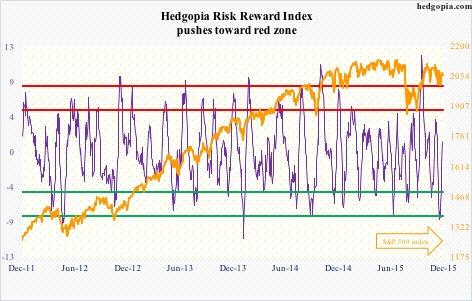
Hedgopia Risk Reward Index
http://www.hedgopia.com/cot-peek-into-future-through-futures-23/
• George.
Click on "In reply to", for Authors past commentaries.
* December 29, 2015
The following are futures positions of non-commercials as of December 22, 2015. Change is week-over-week. (Due to Christmas last week, the CFTC released numbers on Monday, instead of last Friday.)
E-mini S&P 500: Outflows continued in the week ended last Wednesday. Another $7.6 billion exited U.S.-based equity funds (courtesy of Lipper). In the past three weeks, north of $29 billion came out of these funds. And since September 30th, $18.6 billion left.
This may be why shorts are beginning to press a little. Short interest on SPY, the SPDR S&P 500 ETF, went up eight percent mid-December, to 312.7 million shares. This is the highest in two months. That said, it is some 28 percent below the high three months ago.
Back then, shorts persistently built into that mid-September high, just when stocks were about to bottom out and rally. Soon followed a squeeze, with SPY short interest dropping to 278 million by the middle of November.
Viewed this way, the present level of short interest is probably not enough to set in motion another squeeze cycle. Besides, as stated earlier, flows are not cooperating.
Seasonality still favors stocks… at least that has been the case historically. But it is also a known seasonal phenomenon, with traders increasingly positioning earlier.
In the very near-term, there is room to rally. Daily overbought conditions still have room left for unwinding. Daily MACD just crossed up.
Here is the rub. With last week’s rally the S&P 500 sat right on its 50- and 200-day moving averages. Come Monday, it lost both. The consolation is that the index yesterday finished substantially off the lows.
The level to watch is 2090 on the way up and 2040 on the way down, followed by 2020 and must-hold 1990.
For the first time in nine weeks, non-commercials added to net shorts.
Currently net short 95.2k, up 19.9k.

Nasdaq 100 index (mini): The 4560 level continues to act like a magnet. Having lost it in the prior week, the index recaptured the level last week.
There is room for the index to push higher near-term, but here is the thing.
Daily momentum indicators such as the RSI and stochastics have reached the median, and this is where they can turn back if momentum is weak.
Apple (AAPL), which constitutes nearly 13 percent of the index, continues to be a wild card. It remains oversold on a daily chart, but has broken its June 2013 trend line. Moreover, there is potentially a head-and-shoulders pattern forming on a weekly chart, with the neckline break occurring around $105, which was saved last week.
Non-commercials continue to cut back net longs – now at a nine-week low.
Currently net long 47.9k, down 13.6k.

Russell 2000 mini-index: Short interest on IWM, the iShares Russell 2000 ETF, dropped 4.4 percent, to 99.7 million shares – an eight-month low. Since the end of September, it has dropped 24 percent. Between the periods, the Russell 2000 was up a mere 2.8 percent. Not much to write home about.
For a while now, investors/traders have not been showing much love for small-caps.
The 1210-1215 resistance has been in place since March 2014. Most recently, a rally attempt was repelled early this month. Before this gets tested again, small-cap bulls will have to now take out another resistance – 1170, which approximates the 50-day moving average.
The 200-day moving average is now pointing lower, with the 50-day flattish.
Non-commercials, having had bearish bias on small-caps for a while, in the prior week raised net shorts to a 10-month high.
Currently net short 47.2k, down 2k.

US Dollar Index: The dot plot tells us that FOMC members would wish to hike four times next year. Futures traders are pricing in only two. The dollar index is so far not buying the Fed’s hawkish message.
Back in March, the index reached a high of 100.71, before backing off. Then in November, that high was retested, as it rose to 100.60, before coming under renewed pressure.
Since the FOMC decision in the middle of the month, the dollar index is essentially unchanged, let alone take another stab at the afore-mentioned highs.
Also, non-commercials are nowhere near as net long US dollar index futures as they were back in March. In fact, in a week in which the Fed was all but certain to raise rates, non-commercials reduced net longs by 28 percent.
Last week, they cut back more, with holdings at a nine-week low.
Currently net long 33.4k, down 3.5k.

VIX: It has been a while spot VIX has vacillated around its 50- and 200-day moving averages. Having briefly dipped below 15 last Friday, it, once again, surged past both on Monday, although it was unable to close out the session near the highs.
Daily momentum indicators are oversold, and look to be itching to move higher.
In the meantime, the VIX-to-VXV ratio dropped to 0.8 last Friday – onto oversold zone – before rising to 0.86 yesterday. There is room for it to continue moving higher before it gets to overbought zone, and that could spell trouble for stocks.
Spot VIX’s probable path of least resistance near-term is up.
Currently net short 13.8k, up 6.4k.

Hedgopia Risk Reward Index

http://www.hedgopia.com/cot-peek-into-future-through-futures-23/
• George.
Click on "In reply to", for Authors past commentaries.
Information posted to this board is not meant to suggest any specific action, but to point out the technical signs that can help our readers make their own specific decisions. Your Due Dilegence is a must!
• gtsourdinis


