 News
News  Market Data
  Discover
Support: 888-992-3836
Copyright © 2023 InvestorsHub Inc.


Stock Trading Guru
![]()
Register for free to join our community of investors and share your ideas. You will also get access to streaming quotes, interactive charts, trades, portfolio, live options flow and more tools.
Register for free to join our community of investors and share your ideas. You will also get access to streaming quotes, interactive charts, trades, portfolio, live options flow and more tools.
$KNDI Oversold and Looking Like A Good Entry
KNDI, the maker of low cost EVs in China looks like a good entry after its recent sell off from where it reported slower Q1 growth.
I think at some point, investors are going to lose favor with Tesla and lower cost EVs are going to step in and squeeze Tesla's margins. There was a report from Harvard about this very topic and the report even says that Tesla is not the disruptive technology investors first thought it was. Instead, they say that low cost electric vehicles are the disruptive technology.
The chart of KNDI is at a nice oversold level and the sell off from the lower Q1 growth appears to be over. This RSI is at a good oversold level too.

Source: Tesla Competition From Low Cost Electric Cars
Gigamon Stock Has Huge EPS Forecast Hike
The fundamentals do not appear really great for Gigamon but check out the EPS forecast. The EPS outlook has more than doubled over the last 60 days!
On May 18, 2015, Needham gave a buy rating on Gigamon stock with a target of $38.
So far, in 2015, Gigamon is back on course as evidenced by more than 140 institutional traders and funds buying Gigamon stock.
Gigamon stock chart looks great. Keltner Stations are volatility envelopes set above and below an exponential moving average. The Keltner Stations use the Average True Range (ATR) to establish station distance. Keltner Stations Indications are created to encompass most cost activity. Since they are comparatively rare, thus, attention is warranted by moves outside the channel lines. Amazing strength is shown by a surge above the top channel line.

Source: Gigamon Stock Going To The Giga-Moon!
$DY HUGE EPS Forecast Hikes Over Last 7 Days
Earnings growth is the principal driver of stock market action. A few readers have asked me how I can be so confident to challenge anyone to attempt and short any of my stock picks on this website. This really is the way folks, EPS predict increase.
Dycom Industries stock has received massive EPS outlook increases over the last 7 days. About 30 days ago, the EPS forecast was $0.58. Then 7 days past, that was raised to $0.74. Then just a couple of days ago it was raised again to $0.78. Folks, that's a whopping 34% increase in the EPS forecast in only the last 7 days! Wow!
Institutional traders and money managers watch and track EPS predictions carefully. Nothing is more important than earnings growth as soaring profit is what most investors are after.
Dycom Industries stock is in a solid uptrend. The Chaikin Money Flow is strengthening over the past week while the stock has been going sideways. This positive divergence suggests the stock could move higher shortly.

Source: Dycom Industries Stock Has Big EPS Forecast Hikes
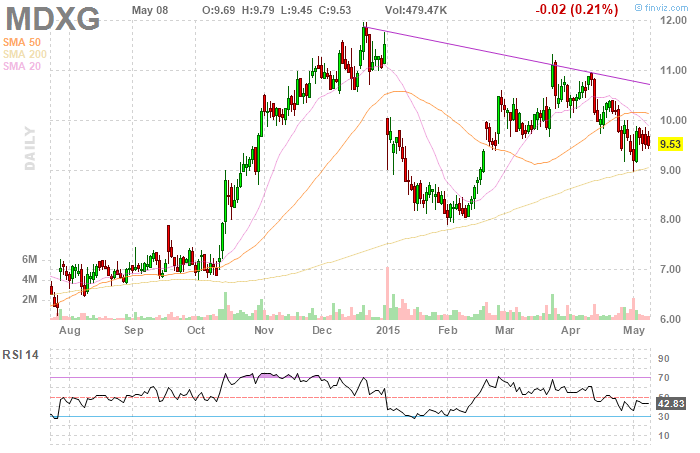
$MDXG Fast Growing Company In Symmetrical Triangle Pattern
Investors are expecting big things which is why growth is not cheap in this stock as evidenced by the forward P/E of 33.6, the PEG of 6.35, and the P/S of 7.26.
Revenue growth over the last 4 years has been awesome. In 2011, revenue was $7.8 million. In 2014, revenue had grown to $118.2 million. That’s more than a +1,500% increase in revenue over the last 4 years.
Highlights from the first quarter 2015 report:
Q1 2015 revenue of $40.8 million increases 108% over Q1 2014
Q1 2015 is 14th consecutive quarter of meeting or exceeding revenue guidance
Q1 2015 Wound Care sales grows 103% over Q1 2014
Q1 2015 Surgical, Sports Medicine/Orthopedic revenue increases 125% over Q1 2014
Adjusted EBITDA of $8.8 million represents a 343% improvement over Q1 2014
Quarterly net income of $4.1 million or $0.04 per diluted share vs a net loss of $900,000 or $0.01 per diluted share in Q1 2014
Q1 2015 Cash Flow from Operating Activities of $4.2 million as compared to a negative $1.6 million in Q1 2014
Company increases full year guidance range from $175-$190 million to $180-$190 million
Significant progress made during quarter in gaining coverage from commercial as well as Medicaid payers
Company signs new building lease adding approximately 25,000 sq. ft. of space in support of planned growth
MiMedx stock is working through a Symmetrical Triangle pattern which is a consolidation pattern. The stock has been pulling back and has yet to form a Parabolic SAR buy or Candle Over Candle reversal. I would wait for a SAR buy before taking a long position:
Source: MiMedx Stock High Risk High Reward Play Could Soar +200%
$BSFT +1,675% EPS Growth (yoy)
The quarterly EPS growth (yoy) of +1,675.6% is amazing. The EPS forecast is rising as well.
BroadSoft (BSFT) provides software and services that enable mobile, fixed-line, and cable service providers to deliver hosted or cloud-based unified communications (UC), and other voice and multimedia services over Internet protocol (IP) based networks in the Americas, Europe, the Middle East, Africa, and the Asia Pacific.
BroadSoft stock has done a 61.8% Fibonacci retracement and has now formed a doji candlestick off that level.
The chart below looks like a good swing long entry:

Source: BroadSoft Stock SAR Buy On Big Volume and P&F Breakout
$VLRS EPS Forecast Blast Off As Stock Gets Ready To Soar.
On May 5, 2015, Volaris announced a new international service from Cancun, Quintana Roo to the city of San Juan in Puerto Rico, starting July 2nd with two flights per week.
Total capacity for the month of April 2015 increased by 9.5% year over year, and total passengers were 933 thousand, an increase of 18.0% year over year.
The EPS quarterly earnings growth (yoy) is an incredible +850%! But what I really like is the crazy upward revisions to the EPS forecast over the last few weeks.
The stock chart shows a sweet candle over candle bounce took place just above the 50 day moving average line. The RSI has a history of bouncing off the 49 level, and the MACD histogram bars are starting to rise. This is a beautiful looking chart.

Source: Controladora Vuela Compania de Aviacion Blast Off
$INFN +33% EPS Forecast Hike Last Week As Strong Uptrend Continues.
Revenue growth has been good for the last several years. In 2011, revenue was $405 million. In 2014, revenue grew to $668 million. The annual revenue growth rate for the last 5 years is an excellent +16.7%. If that is not good enough, the revenue growth rate is actually speeding up. Quarterly revenue growth (yoy) is a whopping +30.9%.
About 30 days ago, the EPS forecast was $0.12. Just last week, the EPS forecast was raised to $0.16. That is a huge +33% hike that has not yet been priced into the stock because of the poor performance of markets over the last week imo. The quarterly EPS growth (yoy) is an incredible +350%.
Infinera Corporation stock is testing its lower Bollinger Band line. It is also testing the 50 day moving average.

Source: Infinera Corporation Stock Still a Good Buy
ACPW Active Power Huge Insider Buying and Rising EPS Forecast.
Active Power has had heavy insider buying over the last few months. Insider holdings have increased by more than +110% over the last 6 months.
Even though EPS is negative, the EPS forecast is rising. Just this week, the EPS forecast was raised from -$0.11 to -$0.09.
The company has a backlog of $32.6 million as of March 31, 2015.
The chart of Active Power shows a continuation pattern against an uptrend support line:

Source: Active Power Stock Has Massive Insider Buying
XLE Energy Stocks Reversal Confirmed Look Like a Good Buy With T Boone Pickens Calling $70 oil by EOY.
After months of patiently waiting, I think it’s finally time to go long the energy sector.
The three catalysts that could power energy sector higher:
- Number of rigs taken offline in the U.S. is starting to improve the supply/demand ratio.
- ECB QE is starting to work
- U.S. economy may improve in the second half of 2015 like the Federal Reserve has been predicting
The chart of XLE looks like a textbook reversal pattern:

Source: Energy Stocks Reverse, Time To Go Long
Matson MATX Blasting Off to the Moon on Massive EPS forecast hike.
The quarterly EPS growth year over year is a stunning 276.5%. What is really shocking though is the EPS forecast hikes. About 60 days ago, the EPS forecast was $0.32. About 30 days ago, that was raised to $0.55. That’s an incredible +71.8% increase in the EPS forecast!
Matson stock trades in the Shipping and Ports industry. If you believe that QE and central bank action around the world is going to revive the global economy, there is no better industry to play than Shipping and Ports in my opinion.
Matson stock just did a Triple Top Breakout after a prolonged consolidation period that lasted from July 2013 to November 2014. That’s a long time for a stock to consolidate and basically go no where. That’s a long term energy field that had a long time to coil up. That coil just released itself in November of last year.

Source: Matson Stock Price In Strong Uptrend
EWY Classic Turnaround Chart Pattern Beating S&P 500 by +600% YTD. The South Korea ETF (EWY) is hot right now!
As the Federal Reserve prepares to transition into a rising environment, investors are looking for better growth opportunities outside the U.S. South Korea GDP per capita is forecast to rise above France's GDP per capita by 2020.
The chart has done a classic Rectangle Bottom breakout in March. The reversal was confirmed by a break above the 200 day moving average in April. The 50 day moving average is quickly approaching the 200 day moving average from below and a Resurrection Cross is coming.

Source: South Korea GDP Beats and How To Play
SIMO Reports Earnings Today Should Have Positive Earnings Surprise. The EPS forecast of SIMO has been rising over the last 90 days from $0.40 to $0.44 per share.
SIMO has had a positive earnings surprise for the last 7 quarters in a row. Will it continue that streak today when they report after market close? I'm thinking it's going to beat again.
Silicon Motion Technology stock has a P/S of 3.92 which suggests it is fairly priced in relation to the amount of sales the company has. The excellent PEG of 0.31 suggests the company is undervalued in relation to its earnings growth. The hot P/B of 0.87 suggests the company’s market value is attractively priced in relation to the assets it has. The P/E of 6.86 and forward P/E of 13.15 suggest the company is undervalued in relation to its earnings.
The chart shows a 61.8% retracement took place last week.

Source: Silicon Motion Technology Stock Shocking PEG of 0.31
KNX EPS Forecast Just Raised and the catalyst that can drive Knight Transportation stock higher, is that an increase in consumer spending and improved new home starts, will push the earnings of trucking stocks higher.
Knight Transportation stock chart shows a giant Triangle pattern just like the Transportation industry. However the stock chart looks a bit more bullish like an Ascending Triangle pattern.

Source: Knight Transportation Stock EPS Forecast Just Raised
Consumer Stocks Earnings Beat Strengthening US Consumer.
Amazon, Coca-Cola, Dunkin Brands, Domino’s Pizza, Dr Pepper Snapple Group, all beat estimates over the last few days and restaurant companies are reporting good earnings as well.
We may finally be seeing the effects of low interest rates, falling unemployment, and lower gasoline prices on U.S. consumption.
Boris Schlossberg of BK Asset Management said his firm is watching the consumer progression chart which goes from restaurants, to housing. I created this infographic based on Boris' comments today on CNBC's Trading Nation:

Source: Earnings Season Update: US Consumers Are Coming Back
$TNK EPS Growth of +760% YoY and rising EPS forecast. About 90 days ago, the EPS forecast was $0.29 per share. As of April 22, 2015, the EPS forecast has been raised to $0.34 per share.
The stock chart shows a continuation pattern inside a longer term Symmetrical Triangle pattern.

The entire Shipping and Ports industry began turning around a few months ago.
Source: Teekay Tankers Stock In Continuation Pattern
FRGI EPS Up +254.5% and EPS Forecast Rising! The catalyst is that as/if consumers get stronger, they will continue to eat at more fast-casual restaurants. This catalyst has been working since November 2014 and now the Restaurant industry is consolidating in a Symmetrical Triangle pattern after a huge run up. The industry chart overall looks very strong.
A divergence has taken place between the EPS forecast and the price of this stock. This is a rare event as a rising EPS forecast usually powers a stock higher.
The stock chart of FRGI shows it is coming out of oversold, with a candle over candle bounce today:

Source: Fiesta Restaurant Group Stock Divergence With EPS
$HRTG EPS +2317% quarter over quarter. Catalyst is that insurance companies will benefit from Federal Reserve rate hikes later this year.
Heritage Insurance Holdings has a P/S of 2.69, a P/B of 2.47, a P/E of 12.94, and a forward P/E of 6.68!
The chart is consolidating but some heavy insider selling last week and stock is in danger of breaking below 50 day moving average so BECAREFUL!

Source: Heritage Insurance Holdings Stock Forward P/E of 6.6!
CGI momentum and continuation pattern play. Celadon Group has had nice EPS forecast hikes over the last 90 days. Revenue growth has increased for this company as a result of the improving U.S. economy and an increase in trading/shipping between the U.S., Canada, and Mexico.
EPS has increased by 71% quarter over quarter.

The chart shows a continuation pattern where it has repeatedly bounced off the 50 day moving average in a strong uptrend after the Resurrection Cross of the 50 day MA crossing above the 200 day MA back in early January 2015.
Source: Celadon Group Stock Continuation Pattern Play
That I do not know. It all depends on central bank action and if the Federal Reserve reverses itself which would devalue the dollar and drive money into US stocks more.
I prefer to just raise the trend higher.
Do you have any targets?
$AFAM grows EPS +1,340% quarter over quarter. Explosive growth and turn around play in the hot Medical Care industry.
EPS forecasts are rising. Also, company has had a positive earnings surprise and beat for the last 8 quarters!
Has done a 38.2% Fib retracement last week.
Volume has been building nicely for the last few months as more on Wall Street discover this stock.
Two catalysts that are benefiting this stock are: people living longer so uptrend in home Medical care services, and the Affordable Care Act.

Source: Almost Family Stock At 38.2% Fibonacci Retracement Level
EPS forecast hike of +700%! Wow. Crazy EPS forecast hike in TravelCenters of America! Like $0.03 EPS 60 days ago, to $0.23 today.
The chart shows the 26% Fib retracement level is holding although not sure for how long.
Another awesome thing about this stock is that Brean Capital just gave it a 'buy' rating today.

Source: TravelCenters of America Buy Rating From Brean Capital
$EURL Ascending Triangle Breakout. This 3x leveraged play is on the catalyst of the global oligarchy and their coordinated central bank action. EURL could be in an uptrend for another year or more. This is my favorite catalyst for 2015-2016.

Full Report The Global Oligarchy and the Flow of Money
American Woodmark (AMWD) EPS Forecast Explodes Higher ! Crazy EPS forecast hikes over the last couple of weeks while the stock has been consolidating which means EPS forecast hikes not yet priced into stock. I think that will end soon.
The catalyst is that improving housing market will boost demand for cabinets and vanities that are made by American Woodmark. The entire Home Furnishings & Fixtures industry is in a strong uptrend right now so this is a hot sector to be in. Full report American Woodmark Stock EPS Forecast Rockets Higher
Yeah, check out the EPS forecast revision upward just in the last day! Holy cow. From $0.56 per share to $0.68. Very nice revenue growth too.
MEI Methode Electronics EPS Forecast Explodes Higher. Crazy move from $0.56 per share to $0.68 per share in just the last day and yet stock has not had a chance to follow the move higher yet. Nice PEG of 0.97 with P/E of 14.55. Company sits on $167 million in cash with only $20 million in debt.
Chart is rounding over so wait for candle over candle reversal. Very nice EPS growth and revenue growth. Trades in the Electronic Components industry. I do not hold any stock in this company at the time of writing this. Full report Methode Electronics Stock EPS Estimate Explodes Higher
MONSTER NVGN Gap up open and $15,000, one day, overnight win. Swing trader Jason Bond hit a HUGE $15,000 win in NVGN today. Wow! Details of what the pattern was he saw and why he bought NVGN Jason Bond Hits $15,000 50% Win Overnight In NVGN
ALL EYES ON ALCOA ON WEDNESDAY AS EARNINGS SEASON KICKS OFF. Everyone is wondering if the rising U.S. dollar is going to rip into Alcoa's revenue and earnings.
Alcoa is going to be the first big international corporation that reports and it may serve as a leading indicator for earnings across corporate America this earnings season.
Now before I get too bearish here, I did blow it in October earnings season because I thought the effects of the rising U.S. dollar would be much greater than what they actually were. Earnings were not nearly as negative impacted as I had talked about in the weekend Saturday show.
Still, Alcoa's stock did a Burial Cross in March, worse, in just the last 7 days, the EPS forecast was lowered. Full report here Eyes On Alcoa Stock As Earnings Season Begins April 8 2015
Biotech Bull Rush!!! It's all about biotech stocks right now. Biotechs are acting as a leading indicator right up there with the U.S. dollar. Basically, traders are looking at institutional traders and each other trying to figure out if we are moving into a risk-off or risk-on trading environment. If it's risk-on, traders not too worried about first rate hike, If it's a risk-off, traders are very worried about first rate hike. That puts risk-on biotech stocks at the center of everyones leading indicator watchlist. I talk more about this here Massive Bull Charge Turns The Tide
Oil storage is running out in the U.S. Traders are trying to store as much oil as possible right now, and then sell it when oil prices rise. This change in behavior is creating a storage problem in the U.S. Some oil tanks are being raised above the safety level and being topped off. God forbid some earthquake or tornado causing the oil inside the tanks to move and slosh over the top. We could see a rise in oil spills and oil leaks as more and more oil is being stored at a level not seen since the 1930s. Full report Oil Storage in the U.S. Running Out
Institutional trader selling detected on the TICK. Yikes! I'm starting to get a little TICKed (pun) off at Janet Yellen and the Federal Reserve.
She keeps spewing forth this BS that everything we are seeing is nothing more than a "transitory" phase. She is the one that keeps saying traders need to look at the economic data to make their decisions, just like the Federal Reserve is doing. Over and over again, she hides questions behind the answer that everything they do is "data dependent". I'm starting to think she's a hypocrite. She tells everyone else to look at the economic data meanwhile she's on a hell bent, economic data be damned, path to normalization of Fed policy.
The U.S. dollar is up more than +20% over the last year and the energy sector has crashed. Now manufacturer is crashing. Exporters are crashing. WTF? Who is not letting the economic data guide their actions?
Now, like a rotten cherry on top, on March 25, 2015, the TICK detected institutional trader selling. I did a report on the TICK here if you're interested: Institutional Investor Selling Detected on the TICK
I'm surprised no one is posting on this board right now with the huge flow of money coming out of US stocks and going into European stocks.
I like VGK and also EURL for the higher risk/reward play.
The UK CPI number that was released on March 24, 2015 showed the UK CPI fell to zero, the lowest level EVER. That is just another data point for the ECB to consider further QE like stimulus.
Think about it. I mean this is REALLY drinking the Kool-Aid but what the heck. With the start of the ECB QE program, could European markets be where the US market was when it started QE back in early 2009?
I did a full report on European stocks here: UK CPI Hits Zero and How To Play For Big Profit
FOMC Analysis and Prediction For Week March 23 2015.
The FOMC announcement and the press conference after did not disappoint. That was hugely important for stock traders and investors as it set the tone for stock market predictions going forward.
The Bulls clearly dominated the Bears last week as evidenced by the stock market prediction algorithm giving the Bulls a huge advantage; however, I had to trump the score and tone down the Bulls advantage to only "slightly" over the Bears. The reason was the NYAD to the S&P 500.
Rate hikes are definitely coming by the end of 2015. In the weekly Saturday show, I spent 30 minutes breaking down the FOMC announcement and press conference. Here is that analysis:
Prediction for March 16 2015 shows lots of uncertainty in the market but the real thing that got me was the institutional trader selling detected on the TICK.
The TICK, if you already know this then sorry, is +1 for a buy order and -1 for a sell order. Most institutional trader activity tools are fake. Even looking at level II is not very helpful because fake orders are entered then cancelled milliseconds later to mask activity. In any event, the TICK is used to "suggest" institutional trader activity because when institutional traders buy (or sell) across many sectors, market makers have trouble matching up a buy order with a sell order and hence the TICK closes outside the -600 to +600 range. On days that happens, you then look at the best (or worst) performing sectors for that day to get a guess at what institutional traders are doing.
Using this less than perfect method, the TICK detected institutional selling on both Tuesday March 10, and Wednesday, March 11, 2015. On both days, the sectors that sold off where bearish. This by itself doesn't mean that the market is going to sell off next week but I think what is somewhat surprising is institutional traders are talking a very bullish scenario over the mainstream financial media.
In this week's show, I talk more about this:
Thank you PB and like your forecast. Also I'd like to add to the concept of a market correction is not a bad thing. When I started trading, there were limited opportunities to take advantage of a market correction. We had like physical gold and bonds, and that was pretty much it. Today, with the proliferation of ETFs and ETNs, there are so many more opportunities to make money during a market correction.
MiX Telematic Explodes on rising EPS forecast. Demand continuing to grow for GPS tracking technology. MiX Telematic offers a variety of different types of tracking technology.

The PEG is a smoking hot 0.62! Huge buying today after the stock has been in a strong downtrend for months. Very low short interest so buying on March 4, 2015 was not short covering. Full report: Heavy Buying In MiX Telematics Stock
Margin debt gives major Bear market signal. Attention weekend warriors, the margin debt level released by the NYSE a couple of days ago has given a major Bear market signal.
Here is the margin debt chart:

Notice the gold colored 10 month MA line that was broke which is the signal line.
My fellow weekend warriors, first off, I'm no perma-Bull. I trade best when I'm absolutely neutral and have no biases and let the market dictate my actions. That's just me. Each to their own. With that said, I'm not so sure we can view this drop in the margin debt as being the equivalent of previous drops.
Think about the CPI. If you chart the CPI, it has done something that it only does at the start of a major bear market. It plunges. However, not all CPI plunges should be viewed equally. In this case, the CPI is not dropping because businesses are having to cut prices just to move product. In the scenario, businesses have totally lost pricing power and are selling below cost just to reduce inventory. That's not the situation we have today with the CPI. The CPI, today, is dropping because the price of oil dropped, and the energy cost savings businesses are experiencing are being passed on to the consumer. I know there's the US dollar perspective but let's just stay on the side of market demand right now. Could not the margin debt be like the CPI? That is margin debt is dropping because oil is what was used as collateral a lot of margin buying. With the drop in oil, sovereign wealth funds are having to reduce their margin debt levels. In that scenario then, the margin debt break of the 10 month MA in the chart above is not as bearish as previous signals. If this interests you, I posted a report and video here: Does Margin Debt Break Signal Stock Market Crash 2015
Prediction For Week of March 2 2015 is that the Bulls have a slight advantage over Bears.
The month of March can be described in one word according to the Stock Trader's Almanac: turbulent. It's not really a VIX spike sort of turbulence, although that could happen, it's more of a price swing situation. The month of March has been starting off strong with Bulls dominating, but sometime around middle to late March, Bears dominate.
Last week's testimony by Janet Yellen where she and Republicans started going at it was awesome. Janet Yellen is one tough cookie. I've seen men crack under that type of pressure but for Yellen, she holds her own.
In my opinion, the big news last week was the positive surprise in the Durable Goods report. Instead of coming in at 2%, it was 2.8%. That's a big surprise folks. Could this FINALLY be the start of what we've all been waiting for--the lower price of oil starting to show up in consumer demand? We need more data to know for sure.
Below is the weekly financial show, broadcast every Saturday evening on YouTube, where I talk more about the U.S. economy and stock market prediction for the week ahead. I was sooo sick when I did the show this week guys. Tried not to show it but had to keep stopping as I hacked a lung out.
Huge forecast EPS being raised for King Digital. In my opinion, the P/E is so low because traders and investors got their arse handed to them in Zynga. Zynga was a colossal train wreck. The fear was that King Digital Entertainment would go the way of Zynga in terms of being a "one hit wonder".
The last earnings release on February 12, 2015, in my opinion, settled the debate once and for all if King Digital was a one hit wonder with their Candy Crush Saga line. A whopping 55% of booking in the 4th quarter came from non-Candy Crush games.
No don't get me wrong. I'm not drinking the Kool-Aid here. King Digital Entertainment needs to expand into other revenue streams beyond just the "free" mobile gaming market. I think the company knows this which is why they bought Z2Live a couple of weeks ago. We know this is an issue when we compare the price action on King Digital to the Electronic Gaming & Multimedia industry. Still, massive growth in mobile gaming, increasing consumer discretionary income, and a proven management team producing top revenue games over and over again, yeah, great catalysts.
Full report: King Digital Rides Mobile Gaming Growth
I agree.
Thank you so much Miles. I appreciate your kind words and support.

