 News
News  Market Data
  Discover
Support: 888-992-3836
Copyright © 2023 InvestorsHub Inc.


Register for free to join our community of investors and share your ideas. You will also get access to streaming quotes, interactive charts, trades, portfolio, live options flow and more tools.
Drop in Investor Optimism Could Spell Trouble
By: Schaeffer's Investment Research | May 8, 2024
• An underperforming market usually follows drops in the percentage of bullish newsletters
• Significant stock underperformance could be ahead
Editors at Investors Intelligence (II) collect more than 100 stock market newsletters and designate them bullish, bearish, or calling for a correction (short-term bearish, but longer term bullish). They publish the outcomes of this newsletter survey on a weekly basis.
Recently, their report showed the biggest weekly drop in optimism we have seen in a long time, after three consecutive weeks of losses for stocks. In the analysis below, I study how stocks tended to perform after newsletters suddenly soured on the market.
DRAMATIC DROPS IN OPTIMISM
Three weeks ago, 57% of newsletters were bullish and just 14.5% bearish according to II, meaning bulls outpaced bears by 42%. The following week, the bulls fell to 46% while the bears jumped to 21.5% -- a 25% difference. The 10% drop in bulls and 17% drop in bulls minus bears were the largest weekly drops since 2018.
The table below summarizes S&P 500 Index (SPX) returns after the percentage of bulls in the II survey fell at least 10% from one week to the next. These signals have not been contrarian. An underperforming market usually follows dramatic drops in the percentage of bullish newsletters.
Six months after these drops, the SPX averaged a loss of roughly 0.5%. One year later, the index averaged a flat return, with less than half of returns positive. This is significant underperformance.

Newsletter sentiment data was much more volatile in the 1970s. The first table above shows 49 drops in bulls of 10% or more, with 42 occurring in the 70s. The table below shows the seven drops since 1980.

Even in the more recent data, poor stock performance followed these 10% shifts lower in bulls. In fact, the SPX averaged a loss three months to a year later after these instances.
In a similar analysis, I looked at the times the weekly bulls minus bears figure fell 17% or more. Stocks underperform going forward, but not as bad as what we saw above. I’m not sure if that’s comforting or not. Six months after these signals, the SPX averaged a gain of 2.16% with 58% of the returns positive. Typically, stocks average a return of 4.35% with 69% of the returns positive.

Again, the overwhelming majority of the signals occurred in the 1970s. The signals since 1980 are below. The SPX performed well the last time we saw this in December of 2018, adding almost 30% over the next year. The signal before was exactly a year from the 2008-2009 financial crisis lows.

Read Full Story »»»
 DiscoverGold
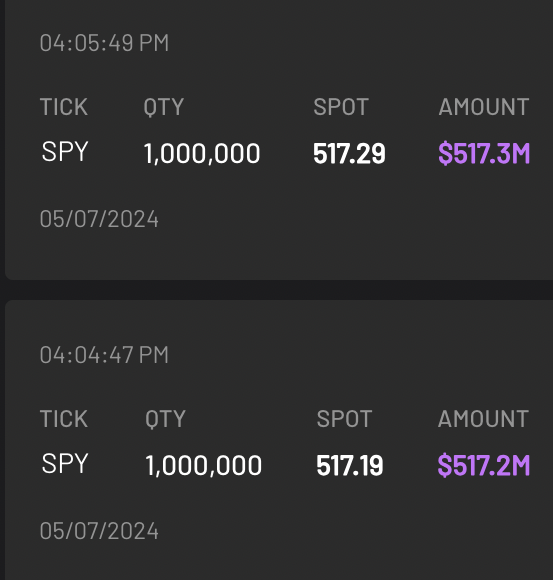
$SPY $1 BILLION+ worth of singular Dark Pool prints were just executed after-hours (Unusual)
By: Cheddar Flow | May 7, 2024
• $SPY $1 BILLION+ worth of singular Dark Pool prints were just executed after-hours (Unusual)
1M shares each
Read Full Story »»»
DiscoverGold
The 10 Top/Bottom S&P 500 Index percent net change performers
By: Thom Hartle | May 8, 2024
• Today (8:34 CST), the 10 top/bottom percent net change performers in the S&P 500 Index.

Read Full Story »»»
DiscoverGold
Markets Monthly Pattern »» Watchlist - Top 10
By: Marty Armstrong | May 8, 2024
• Dow Jones Industrials Index »» New Pattern Forming
• NASDAQ Composite Index »» New Pattern Forming
• NASDAQ 100 Index »» Turning BACK DOWN
• S&P 500 Index »» New Pattern Forming
• Russell 2000 Index »» New Pattern Forming
• US Dollar Index »» Temp Pause
• CBOE VIX Index »» New Pattern Forming
• NY Gold Futures »» Top High Close
• NY Silver COMEX Futures »» Holding
• NY Crude Oil Futures »» Turning BACK DOWN
DiscoverGold
$SPX Big Picture
By: Tom Bowley | May 7, 2024
The monthly PPO continues to push higher and away from centerline support. This is indicative and consistent with how the S&P 500 behaves during secular bull markets. Also, note that RSI 40 support tests have been successful since the financial crisis in 2008/2009. This is another sign that the secular bull market remains alive and kicking.
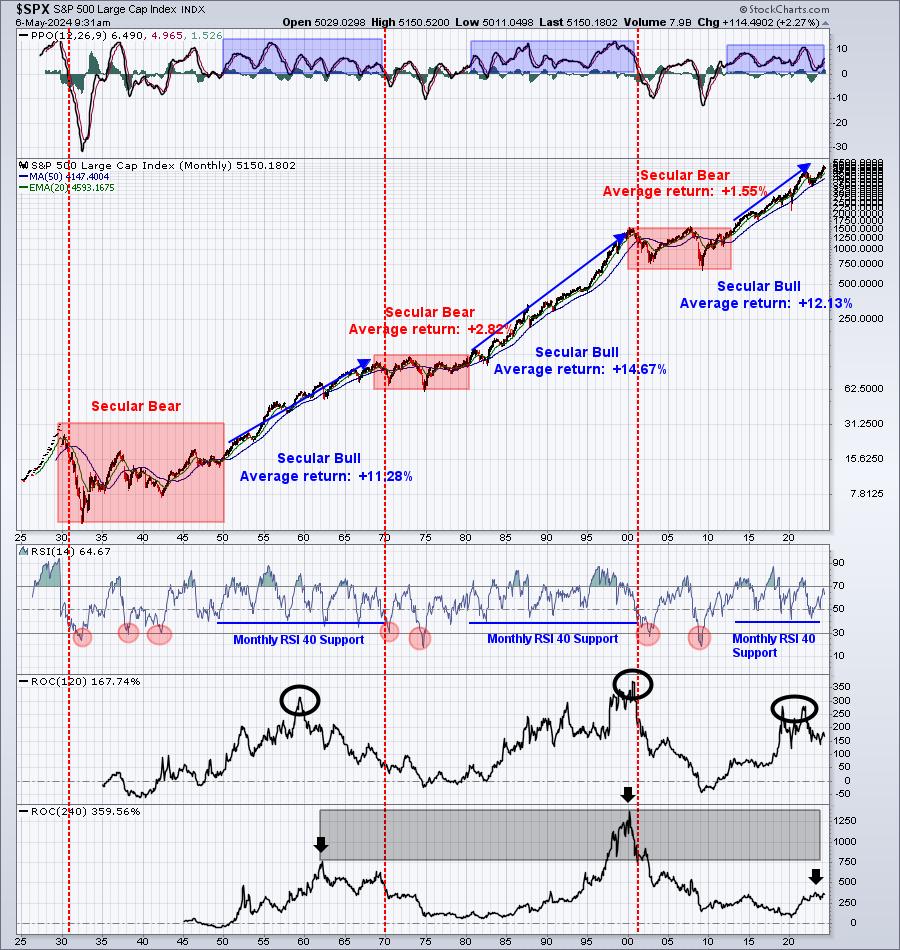
Both our 10-year and 20-year rate of change (ROC) panels show that highs during this secular bull market have not come close to previous secular bull market highs. It's telling me we still have much further to go.
Sentiment
Let's revisit the 253-day SMA of the equity only put call ratio ($CPCE). I want to refresh everyone's memory as to what happens to the S&P 500 when this sentiment indicator tops with readings showing EXTREME fear:
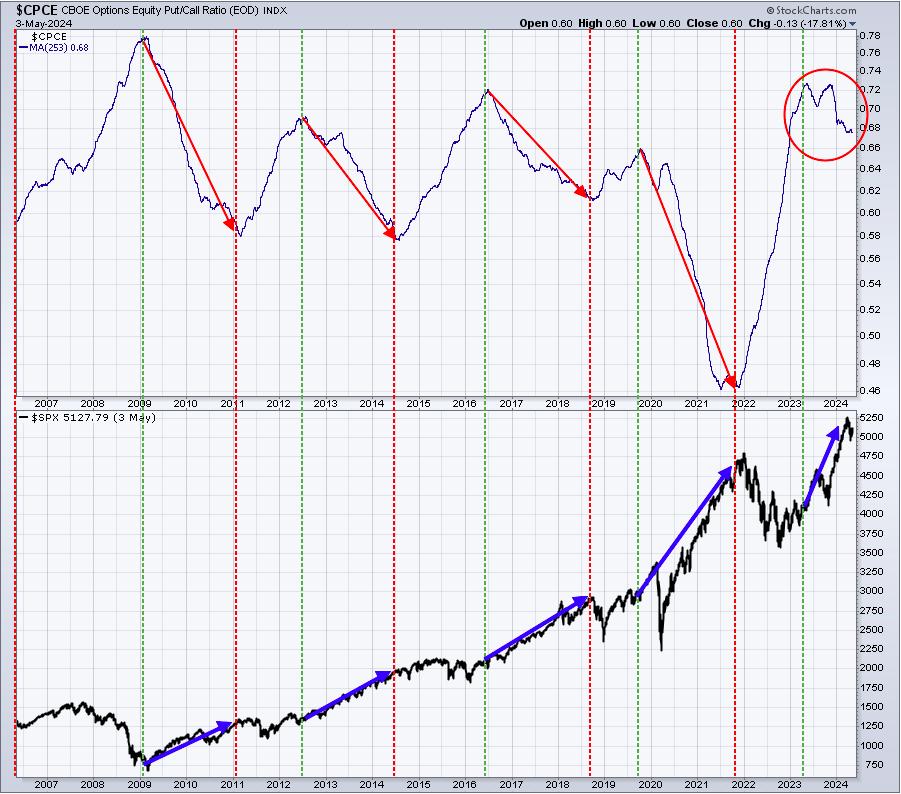
Bet against this chart at your own risk. Personally, I believe that sentiment plays a much bigger role in stock market direction than most folks give it credit for. Every single major S&P 500 advance during this secular bull market has occurred with a significant top in the 253-day SMA of the CPCE. When this moving average is falling, you want to be on the long side.....PERIOD! This doesn't mean there aren't pullbacks. There simply aren't pullbacks that morph into bear markets.
Rotation/Intermarket Analysis
Here's the latest look at our key intraday ratios as we follow where the money is traveling on an INTRADAY basis (ignoring gaps):
QQQ:SPY
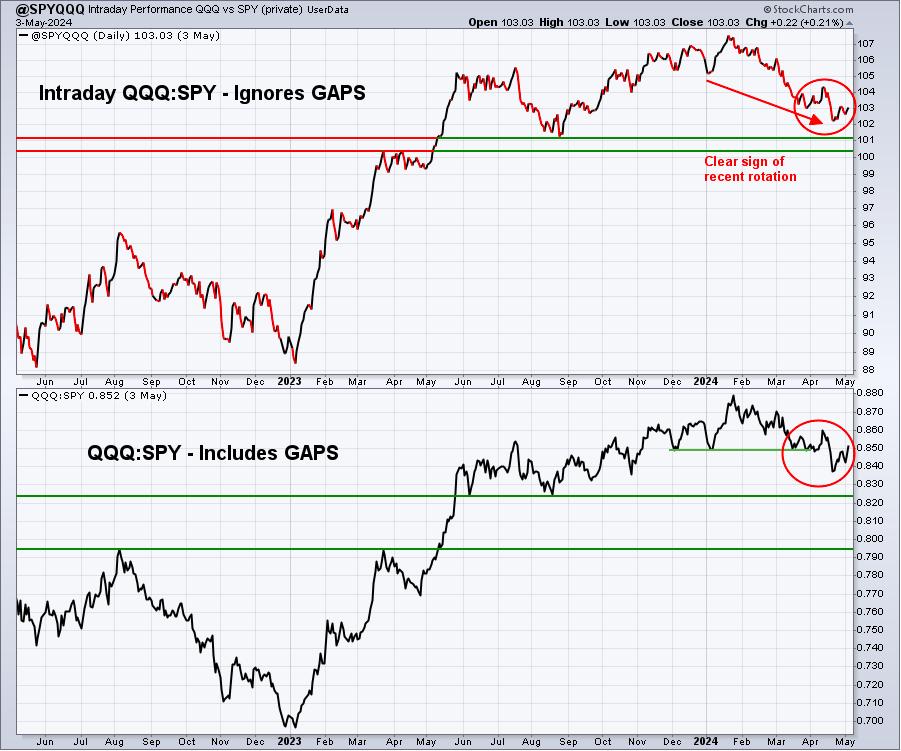
First, a quick reminder. While this chart is named "@SPYQQQ", it's actually the QQQ divided by the SPY. When this line is rising, it means the QQQ is outperforming the SPY ("risk on" environment). When it's falling, it means the SPY is outperforming the QQQ ("risk off" environment). We've clearly been in a downtrend as money has rotated towards defensive- and value-oriented stocks. The past few days, this has changed and you can see the lines turning higher. The key to a sustainable upside move will be the continuation of this ratio to the upside.
Read Full Story »»»
DiscoverGold
$SPY $2.9 Million Far OTM Put (Very Unusual)
By: Cheddar Flow | May 7, 2024
• $SPY $2.9M Far OTM Put (Very Unusual)
This print is an opening order and volume had a major uptick today
*Above the Ask*


Read Full Story »»»
DiscoverGold
$SPX - 1st Target from the 'Broadening' Hit
By: Sahara | May 7, 2024
• $SPX - 1st Target from the 'Broadening' Hit.
Tipped the Outer Uppr-Parallel & 'Gap' Fill too. If it doesn't get rejected here then its going to B/Out...

Read Full Story »»»
DiscoverGold
The 10 Top/Bottom NASDAQ 100 Index percent net change performers
By: Thom Hartle | May 7, 2024
• Today (8:34 CST), the 10 top/bottom percent net change performers in the NASDAQ 100 Index.

Read Full Story »»»
DiscoverGold
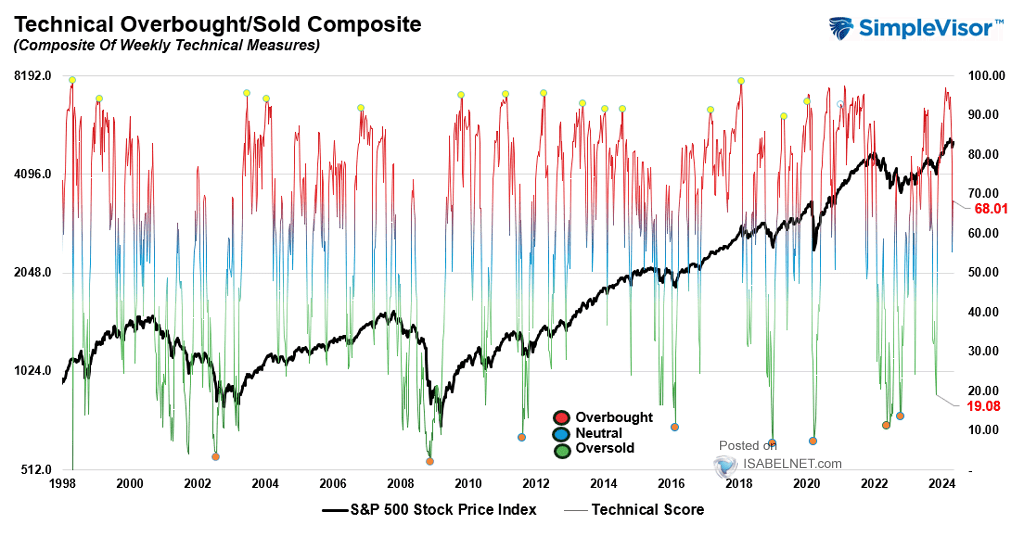
S&P 500: The US stock market is not considered overbought at the moment, as the current reading of 68.01 suggests there is still upside potential
By: Isabelnet | May 7, 2024
• S&P 500
The US stock market is not considered overbought at the moment, as the current reading of 68.01 suggests there is still upside potential
Read Full Story »»»
DiscoverGold
Typical May Up Early, Weak Middle, Strong Finish
By: Almanac Trader | May 7, 2024

Over the last 21 years, the first three days of May have historically traded higher, and the S&P 500 has been up 18 of the last 26 first trading days of May. Bouts of weakness often appear around or on the fourth, sixth/seventh, and twelfth trading days of the month while the last four or five trading days have generally enjoyed respectable gains on average, but the last day of May has weakened noticeably with only NASDAQ gaining ground.
Monday before May monthly option expiration is much stronger than monthly expiration day itself albeit weaker for small caps. S&P 500 has registered only ten losses in the last thirty-four years on Monday. Monthly expiration day is a loser nearly across the board except for Russell 2000 with a slight average gain (+0.01%). The full week had a bullish bias that is fading in recent years with DJIA down seven of the last eight and S&P 500 down six of the last seven. The week after options expiration week now tends to favor tech and small caps. NASDAQ has advanced in 24 of the last 34 weeks while Russell 2000 has risen in 26 of the last 34 with an average weekly gain of 0.88%.
Read Full Story »»»
DiscoverGold
Best Returns Last 10 Years...
By: Charlie Bilello | May 6, 2024
• Last 10 Years...
NVIDIA $NVDA: +20,081%
Bitcoin $BTC: +14,740%
$AMD: +3,486%
Tesla $TSLA: +1,208%
Amazon $AMZN: +1,112%
Netflix $NFLX: +1,105%
Microsoft $MSFT: +1,104%
Apple $AAPL: +887%
Facebook $META: +640%
Google $GOOGL: +521%
S&P 500 $SPY: +225%
Gold $GLD: +72%
US CPI: +32%
Read Full Story »»»
DiscoverGold
$SPY $3.8 Million Far OTM Put (Highly Unusual)
By: Cheddar Flow | May 6, 2024
• $SPY $3.8M Far OTM Put (Highly Unusual)
This order has a near-term expiration and a lot of premium
Contract volume has seen a substantial uptick today


Read Full Story »»»
DiscoverGold
Major Ultra-Bullish Signal is Approaching
By: Lucas Downey | May 6, 2024
Last week we took a deep dive in our data and found something interesting. When the BMI falls 40+ points in 16 weeks, it’s extraordinary.
In fact, over the past 30 years, it’s occurred 303 times.
While that may not seem exceptional on the surface, in reality most of those instances cluster around 17 discrete episodes throughout the 3 decade period including back-tested data.
But history proves these prolonged money flow dips are quite bullish over the medium to long-term. Even more striking are periods that are very similar to today’s environment.
I’m referring to conditions when the BMI fell 40+ points from a red-hot overbought reading over the next 4-month trading period.
Let’s visualize one from recent memory.
We experienced a similar peak to drop like now after the pandemic. From mid to late 2020, the BMI dropped from the 90 area to the low 50s, eerily similar to today.
By far this is the closest analog to today’s situation:
- Investors were still spooked by the unprecedented macro environment
- Bearish rhetoric was all over the media given the unfolding pandemic
That pullback eventually ended with a powerful rally starting soon later:
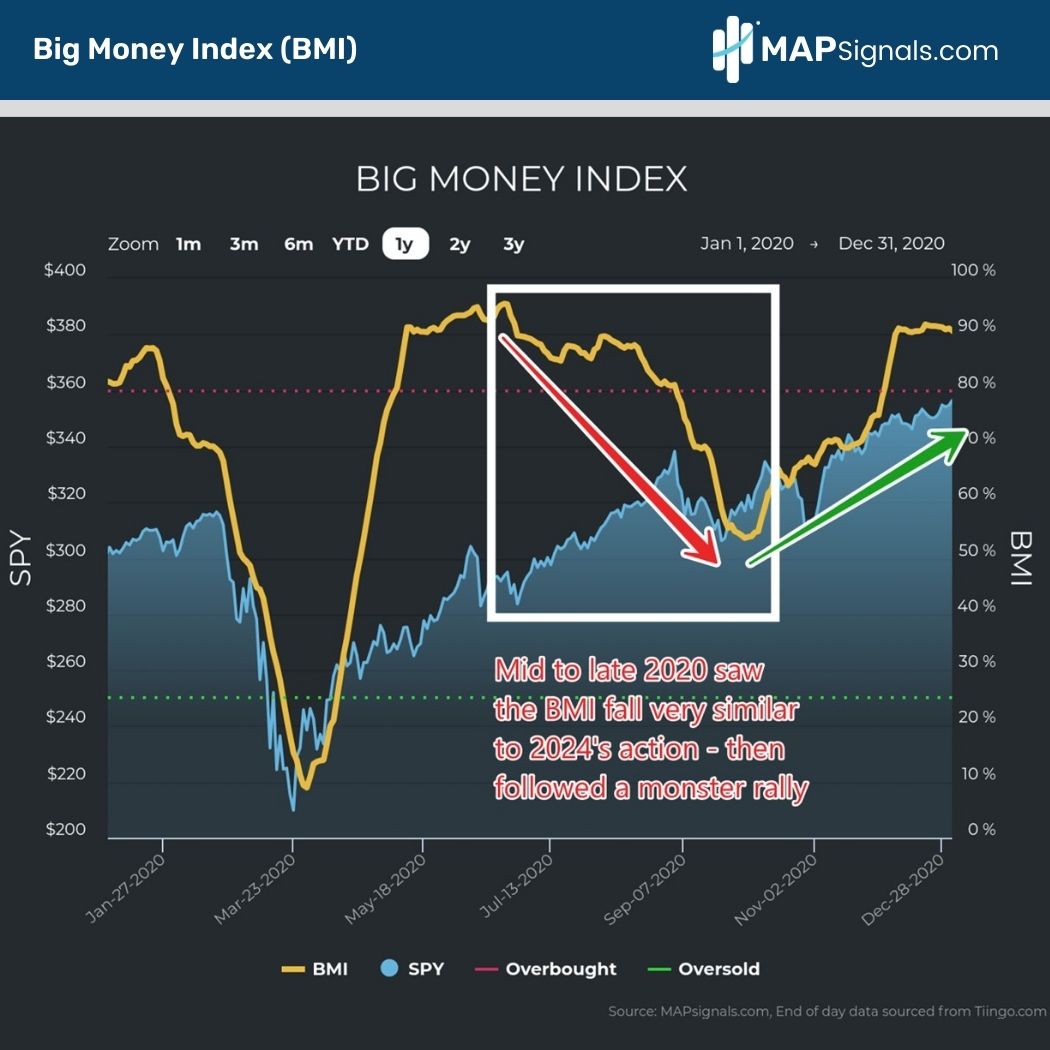
What’s important to note is that market lows were eventually hit and the BMI began rallying well ahead of the surge that followed.
Turns out, this similar pattern has been rather predictable in our data.
If you’re allergic to an extremely bullish setup, LOOK AWAY NOW.
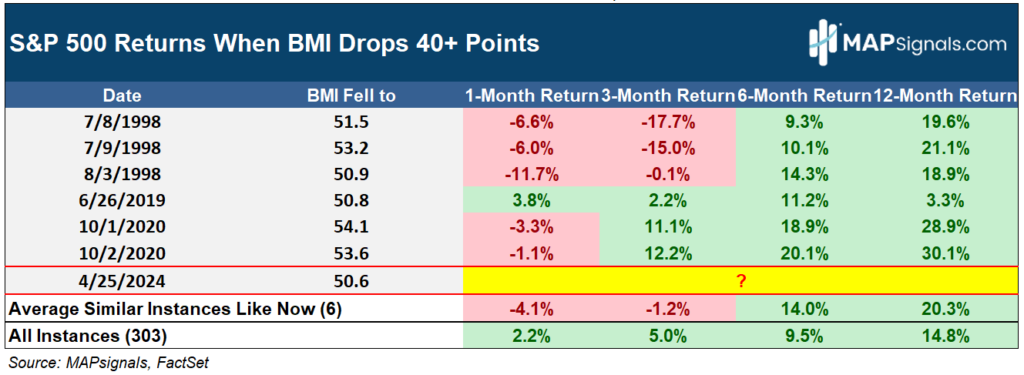
When we single out similar BMI pullbacks to now, we find 6 instances ranging from 1998, 2019, & 2020.
What we find is near-term stocks struggle with the S&P 500 falling 4.1% a month later and 1.2% 3-months later.
But the underlying message that you need to heed is stocks zoom 6 and 12 months later with average gains of 14% and 20.3% respectively.
If that doesn’t impress you, I’ve included all 303 instances as well. In aggregate, they forecast market beating forward returns:
But I don’t want to stop with the coming bullish message.
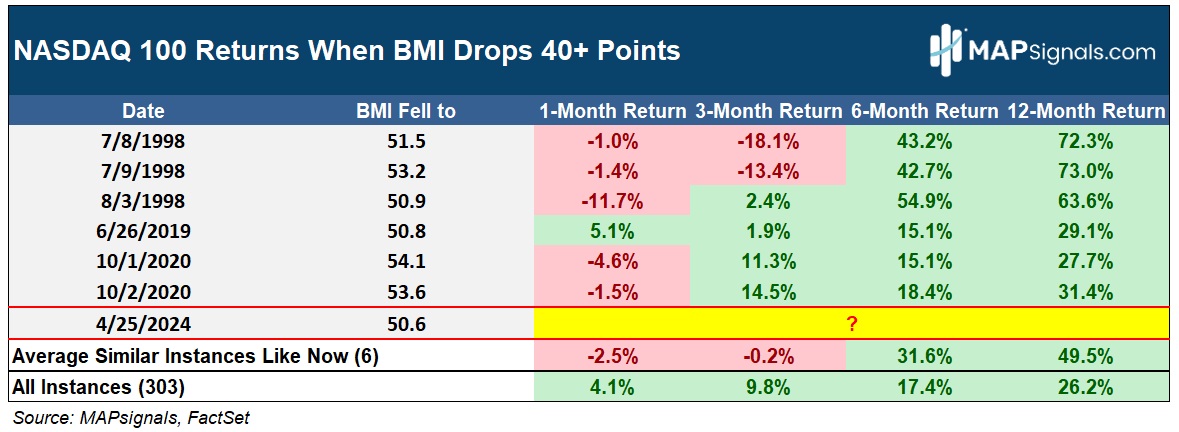
For those that think Technology stocks are not going to shine again…keep dreaming.
This massive BMI drop favors those bold enough to bet on high-quality growth stocks.
Here I’ve performed the same analysis but with the NASDAQ 100 (NDX). The same weakness is seen 1 to 3 months out, with -2.5% and -.2% returns respectively.
But that’s when you want to be accumulating best of breed stocks. 6-months later the NDX surges 31.6% and 12-months later an awe-inspiring 49.5% jolt is seen.
And for those curious, the 303 instances offer outstanding forward gains too:
Folks, stop worrying about interest rates. You might risk missing a major ultra-bullish situation.
Instead, follow evidence-based data.
New market leaders are under heavy accumulation…now isn’t the time to bounce, it’s the time to pounce.
We are getting our subscribers ready for when the all-clear signal finally strikes. I firmly believe it’s around the corner.
Just like we sent out some of the best stocks to buy in October, we’re prepping for a similar rip.
A market map is the way.
Here’s the bottom line: Investors are looking for clarity in this turbulent market. Data has more answers than the news ever will.
We are currently witnessing a rare 40+ point drop in the Big Money Index (BMI). History says a little more pain will lead to monster gains in the coming months.
Not only that, whenever the BMI drops 40+ points from a red-hot overbought period similar to now, stocks have never been lower a year later, with the NASDAQ averaging a 49.5% twelve-month gain.
Don’t stop and stare. PREPARE!
After doing this study, earlier this week we sent 3 stocks to our PRO Members that we love for this coming uptrend. And chances are they aren’t names you’re familiar with…but the Big Money loves them!
Listen, a major ultra-bullish signal is approaching.
Don’t wait for the media bull whistle to blow…it’ll be too late.
Follow the money and you’ll be ahead of the move.
Read Full Story »»»
DiscoverGold
The 10 Top/Bottom S&P 500 Index percent net change performers
By: Thom Hartle | May 6, 2024
• Today (8:34 CST), the 10 top/bottom percent net change performers in the S&P 500 Index.

Read Full Story »»»
DiscoverGold
The 10 Top/Bottom NASDAQ 100 Index percent net change performers
By: Thom Hartle | May 6, 2024
• Today (8:34 CST), the 10 top/bottom percent net change performers in the NASDAQ 100 Index.

Read Full Story »»»
DiscoverGold
After 2 Up Weeks, Major US Indices End Last Week Right On 50-DMA, Which Is Flat And Itching To Turn Down
By: Hedgopia | May 6, 2024
After peaking in March and dropping in mid- to-high single-digit percent, the major US equity indices have rallied the last two weeks, ending last week right on the 50-day. A takeout of the average, which was lost three weeks ago, is likely but a sustained move higher is unlikely as overhead resistance is galore.
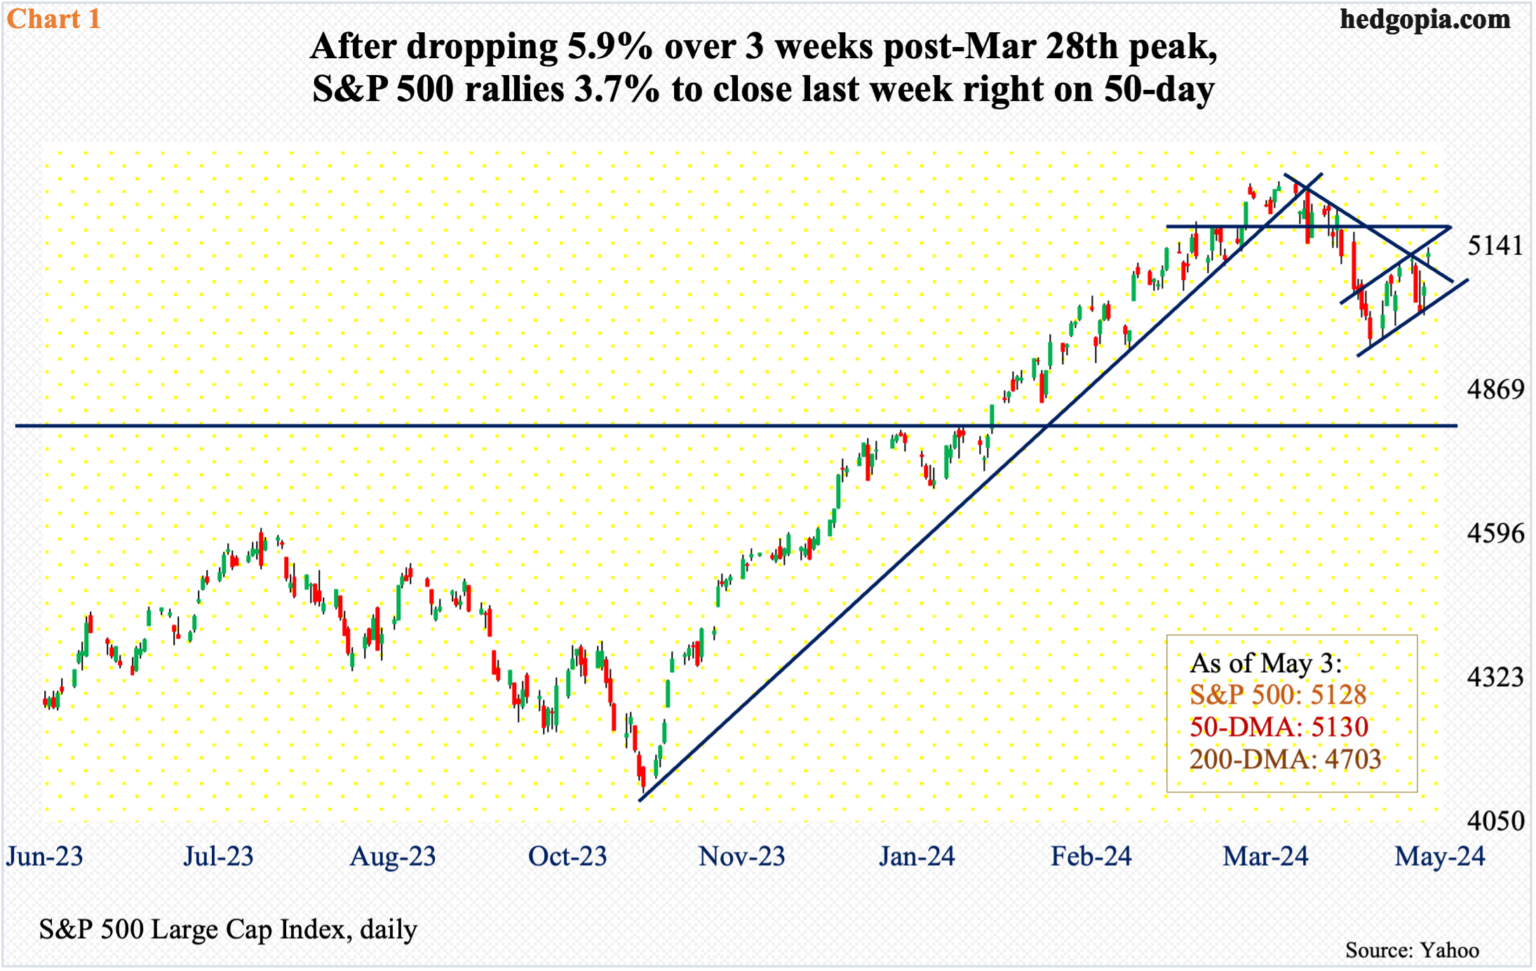
From the March 28th peak of 5265, the S&P 500 gave back 5.9 percent through the April 19th low of 4954. From that low, the large cap index rallied nicely to test the 50-day last Monday but was rejected. This was an opportunity for equity bears to press, which they did, managing to exert downward pressure last Tuesday and Wednesday. The downward momentum even continued early Thursday, with the index down 1.7 percent for the week through the session low of 5011, which got bought. By Friday, momentum had completely swung the other way, as the session gapped up to tick 5139 intraday but close the week at 5128, up 0.6 percent for the week and essentially right at the 50-day (5129).
It is likely the average – currently flat – gets taken out this week. As a matter of fact, Friday’s 1.3-percent jump helped the index push through a falling trendline from the March 28th high. But there are other levels where selling is likely to pick up. Since the April 19th low, the index has traded within a rising channel; Last Friday’s high just about touched the upper end. It is entirely possible the index continues higher all along the rising channel, which in due course will then line up with horizontal resistance at 5170s (Chart 1).
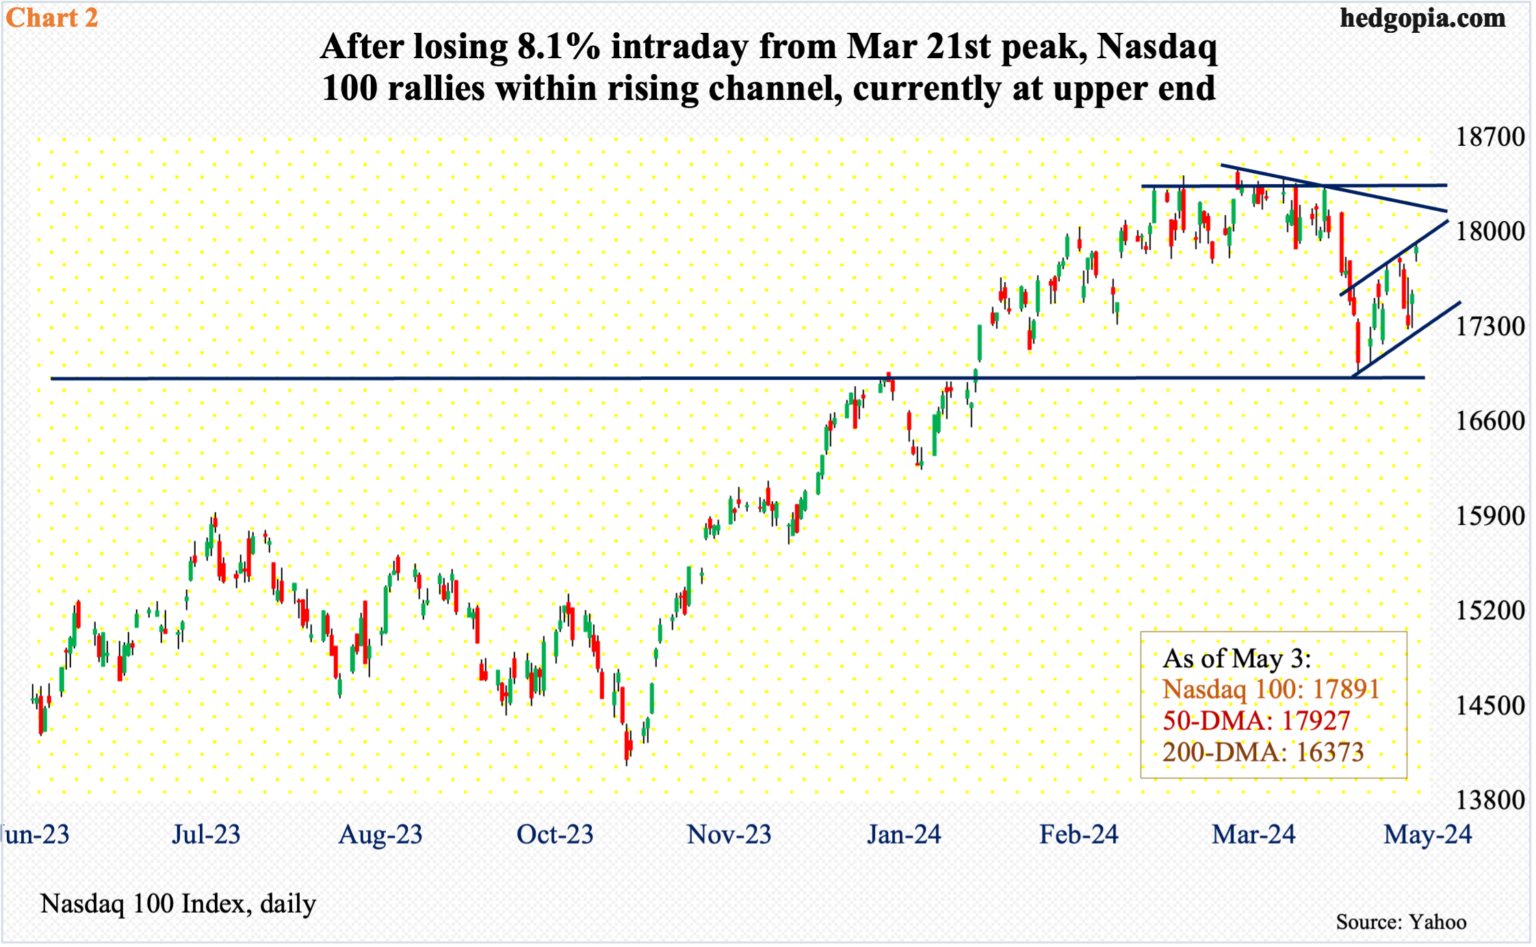
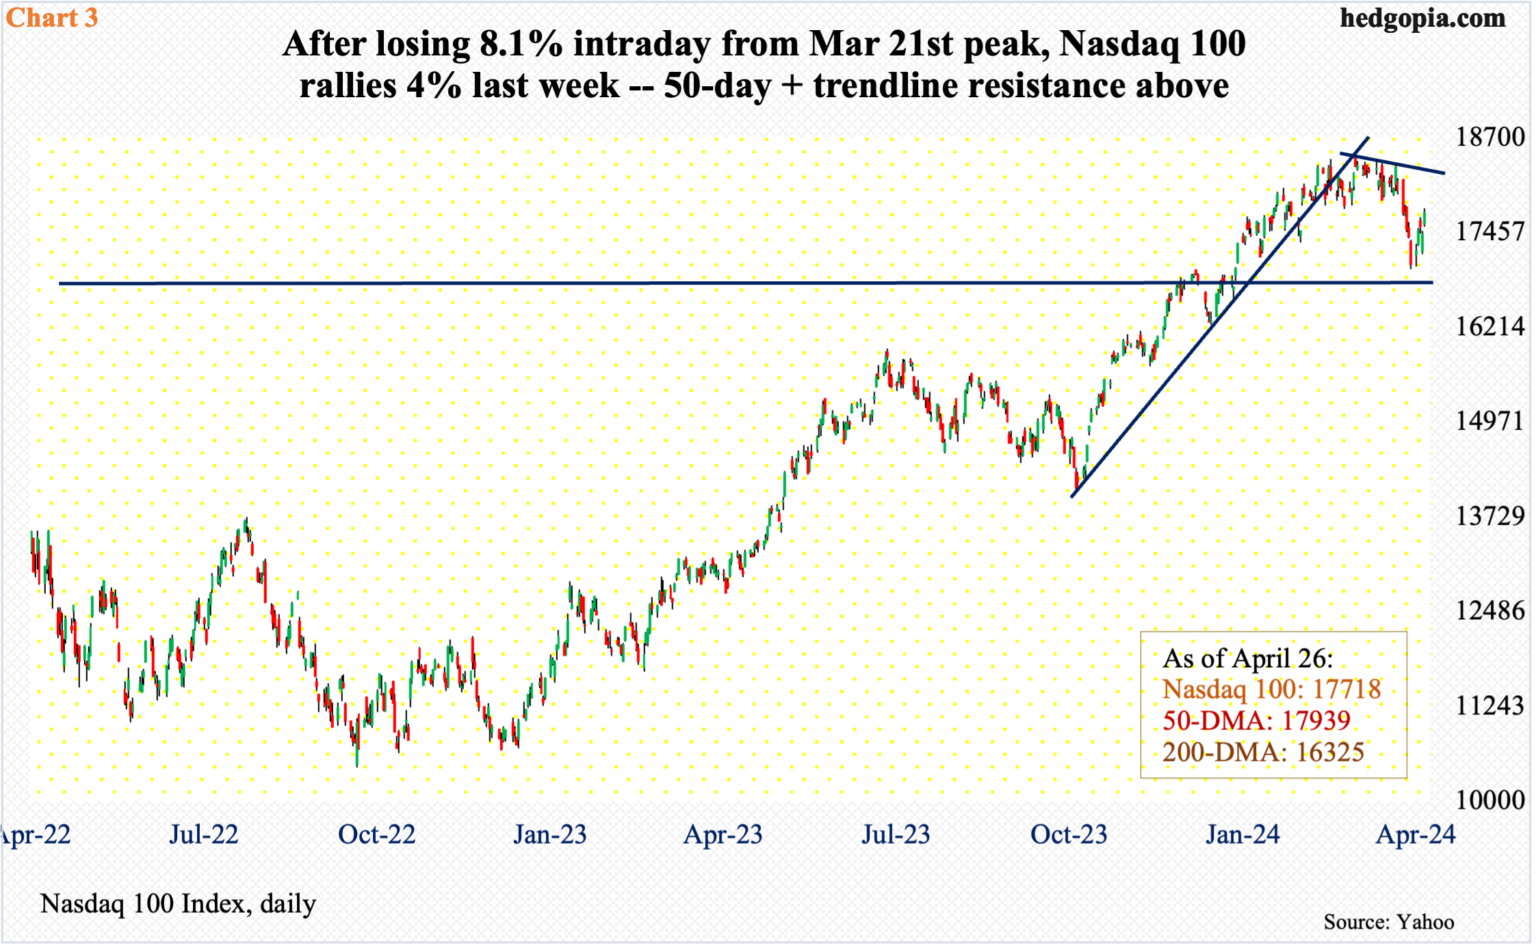
Things have evolved similarly on the Nasdaq 100, which between the March 21st peak of 18465 and the April 19th low of 16974, dropped 8.1 percent. Last week, it closed at 17891, with the tech-heavy index touching the 50-day (17927) intraday. The index has been under the average for 15 sessions now – which is also the case with the S&P 500. The average is also flat on the Nasdaq 100.
As is the case with the S&P 500, the Nasdaq 100 has traded within a rising channel since last month’s low; last week’s one-percent rally brought the index right to the upper end. Should it manage to break out, there is no shortage of levels overhead where tech bears are likely to get more aggressive.
At 18100 lies trendline resistance from the March 21st high. Then, there is 18300s, which the Nasdaq 100 failed to decisively break out of several times over seven weeks beginning March 1st (Chart 2).
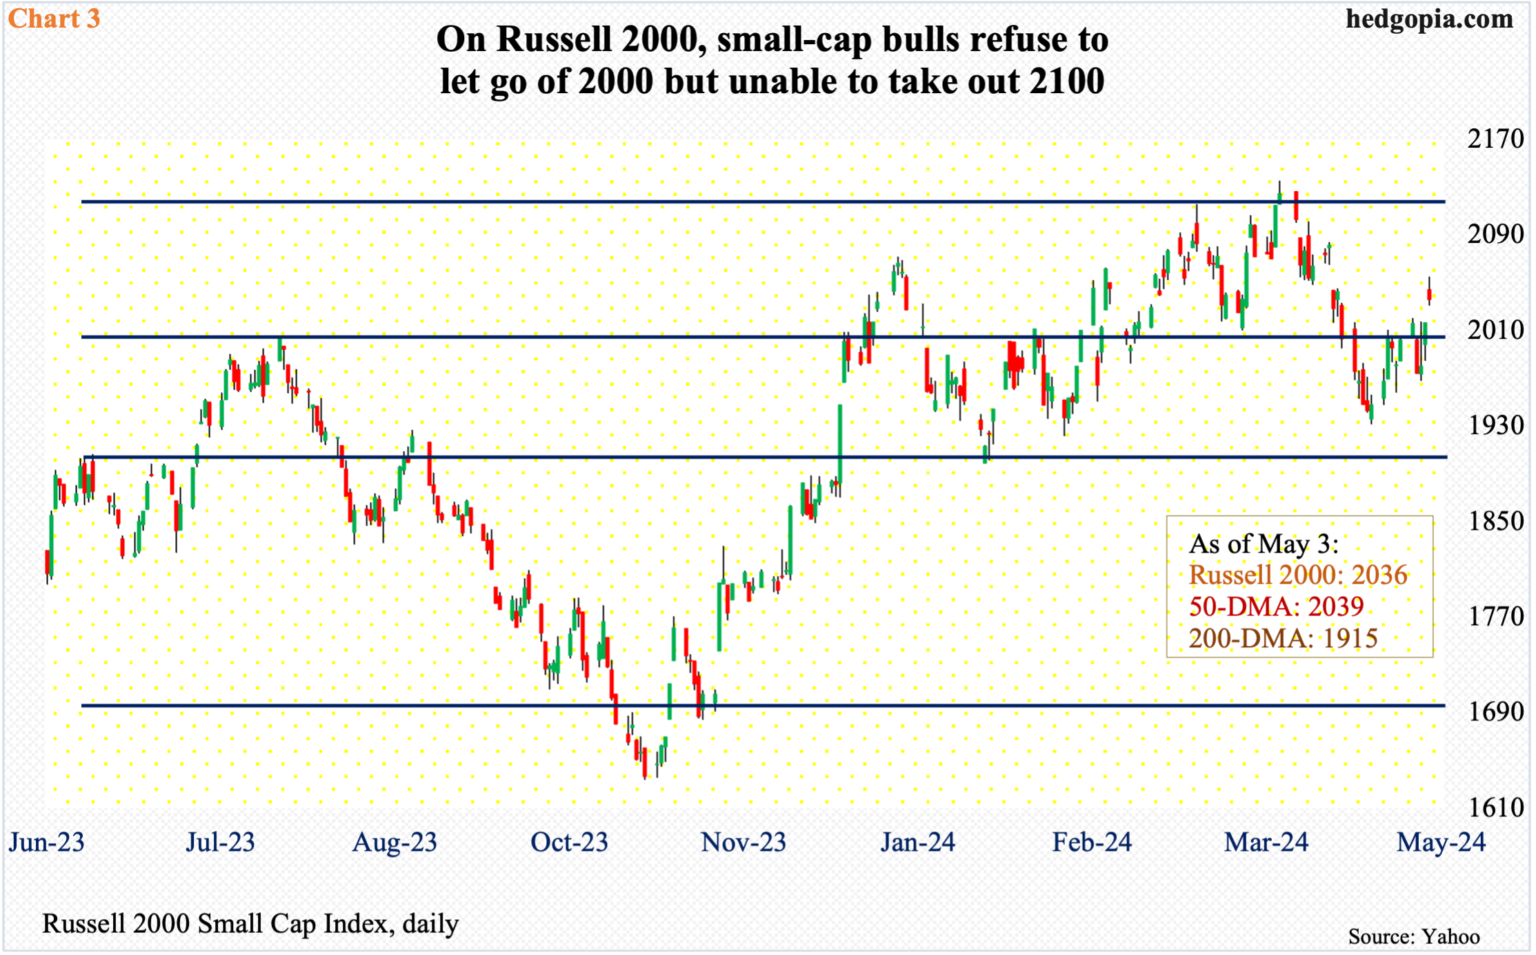
The story is different in the small-cap arena, not the least because the Russell 2000 remains way under its November 2021 peak of 2459. Last week, it closed at 2036, having rallied as high as 2135 on March 28th (Chart 3).
Earlier, after peaking in 2021, the small cap index touched 1641 in June 2022 and 1642 in October that year. These lows were successfully tested last October as the index ticked 1634 before reversing higher.
A 61.8-percent Fibonacci retracement of the peak-to-trough drop comes to 2144. After losing the level in January 2022, the index has found stiff resistance at 2100, which also represents a measured-move price target post-breakout at 1900 last December. Before that, the Russell 2000 essentially played ping pong between 1700 and 1900 going back to January 2022.
Until 2100 gives way, small-cap bulls get no bragging rights. Ditto with the bears who need to at least push the index below 2000 to build some momentum. For now, the Russell 2000 is in no man’s land. And, as is the case with its large-cap cousins, it ended last week right on its 50-day. It did gap up to rally one percent last Friday, but ended the session in a weak note, as it was up as much as 1.9 percent at the session high.
On each of the three indices, the 50-day is flat. Unless the bulls get their act together – and quick – the average could very well be looking to turn down.
Read Full Story »»»
DiscoverGold
Why Extended Choppy Price Action May Lie Ahead
By: Schaeffer's Investment Research | May 6, 2024
• Last week’s action was a net positive for bulls
• Bulls and bears are fighting for control
“Last week’s rally that followed the expiration-week decline was encouraging, but there is still work to be done from a technical perspective. On Friday, the SPX closed just below the confluence of its declining 20-day and flattening 50-day moving averages in the 5,115-5,125 zone. Moreover, the 5,111 level is a 50% retracement of the March closing high and this month’s closing low. And finally, there is potential trendline resistance connecting lower highs in the first two weeks of this month. That trendline comes into the week at 5,135 and at week’s end will be around 5,110. ”
-Monday Morning Outlook, April 29, 2024
The S&P 500 Index (SPX – 5,127.79) rally that followed April standard expiration week was encouraging, but as I suggested, there was work to be done. The index was below technical resistance from multiple perspectives, leaving room for a Monday rally that quickly gave way to selling.
The 50-day moving average and the area coinciding with a 50% retracement of the late March closing high and mid-April closing low acted like a brick wall. Choppy action then followed the SPX’s break below the 50-day trendline, as both bulls and bears tried to seize control.
Support last week, while flimsy, was around the SPX’s unpopular, yet at times significant 80-day trendline, situated around 5,048. This trendline marked support in early May and mid-August 2023. Crosses below it in September and back above it in mid-November marked sell and buy signals, respectively.
A full or near full candle close below the moving average in a week outside of standard expiration may be viewed as a potential sell signal, based on this trendline’s importance in the past year. If a sell signal indeed materializes, the next support level will be around 4,940-4,965. The former is 20% above the October 2023 closing low, while the latter is marking April’s closing low around 4,965.
A move below this region of support would increase the possibility of the SPX revisiting 4,800 – the site of its previous all-time high from January 2023, before it gave way to a January breakout.
So far, the SPX bounced off the supportive 80-day moving average, reaching potential resistance levels again. The first was the trendline connecting highs at the start of the current decline, which the index breached on Friday. It comes into the week at 5,102 and will be at 5,077 at the end of the week, meaning it's sloping five points lower each day.
However, the convergence of the 30- and 50-day moving averages at 5,130 should be on your radar as a point of potential resistance to watch, if the see-saw action continues. The SPX closed under this level on Friday, putting the trendline breakout in an awkward position heading into next week. Early price action may determine if the SPX breaks out or re-enters the choppy environment.

On the sentiment front, a few sentiment indicators were neutral. The weekly National Association of Active Investment Manager’s (NAAIM) survey suggests 60% of active managers are invested, with extremes being either 15-20% invested or fully invested.
This group could be in a holding pattern for now, after no major surprises emerged from the Federal Open Market Committee (FOMC) meeting. This week brings another batch of economic indicators, however, including inflation and retail sales data. With these reports due out during standard May expiration week, the options market could exaggerate its reactions.
One sentiment indicator that moved in options bulls' favor last week was the 10-day, buy-to-open put/call volume ratio on SPX components. It is now showing hints of rolling over from a relatively high level. This type of behavior typically comes up as the market begins a basing period around the eventual lows, withs some rollovers in the ratio coinciding with bottoms.
If the SPX moves above the technical levels discussed above, this indicator will be more valid. Both sentiment and technical indicators suggest extended choppy price action this week, with the potential for the needle being moved during standard expiration week.

Read Full Story »»»
DiscoverGold
Is this a Dead-Cat Bounce or a Bounce with Legs?
By: Arthur Hill | May 3, 2024
• A key short-term breadth indicator became oversold in mid April.
• Stocks are bouncing after this oversold reading.
• Breadth, however, has yet to show a serious expansion in participation.
Stocks fell sharply into late April and then rebounded over the last two weeks. SPY fell 5.34% from March 28th to April 19th and then rebounded with a 3.26% gain the last two weeks. Does this bounce have legs? Chartists can separate serious bounces from dead-cat bounces using breadth. Today's example will use the S&P 500 and the percentage of S&P 500 stocks their 20 day SMAs.
There are two steps. First, the indicator needs to become oversold (setup). Second, we need to see a significant increase (breakout) in upside participation (signal). An oversold reading signals a significant decline and provides the setup for a bounce. Aggressive traders can trade the oversold condition. A subsequent move above the breakout level signals adequate participation to sustain the advance. Now comes the subjective part. We must choose our oversold and breakout levels. I am choosing 10 and 70 percent for SPX %Above 20-day SMA.
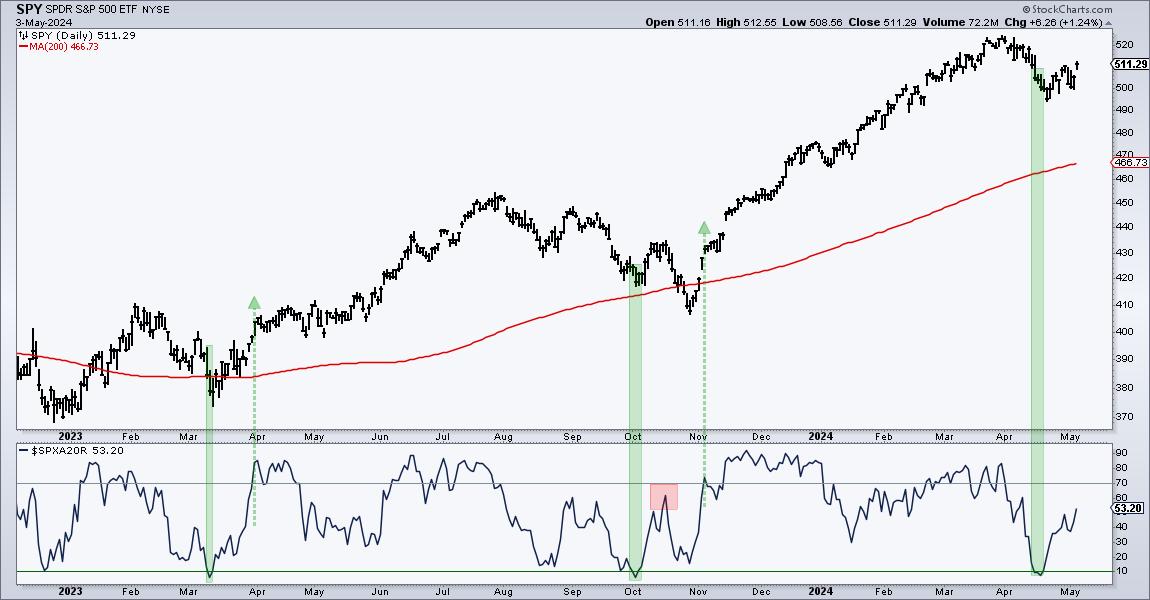
The green shading on the chart above shows when SPX %Above 20-day became oversold and the green arrow-lines mark the subsequent move above 70%. There were setup-signals in March-April and again in October-November. Both led to significant bounces. Notice the red shading where the indicator failed to clear 70% in mid October. This was a feeble bounce and SPY moved to a new low in late October. SPX %Above 20-day then surged above 70% in early November for a signal. Recently, the indicator became oversold here in mid April for a setup and moved back above 50% this week. An oversold bounce is indeed underway, but I need to see a move above 70% to show a participation breakout.
We are monitoring the rebound in the S&P 500 and Nasdaq 100 at TrendInvestorPro (ChartTrader). Our 10 indicator composite indicator became oversold in mid April, but we have yet to see the required breadth thrust to signal a strong increase in participation.
Read Full Story »»»
DiscoverGold
CoT: Peek Into Future Through Futures, How Hedge Funds Are Positioned
By: Hedgopia | May 4, 2024
• Following futures positions of non-commercials are as of April 30, 2024.
E-mini S&P 500: Currently net long 43.1k, down 24.5k.
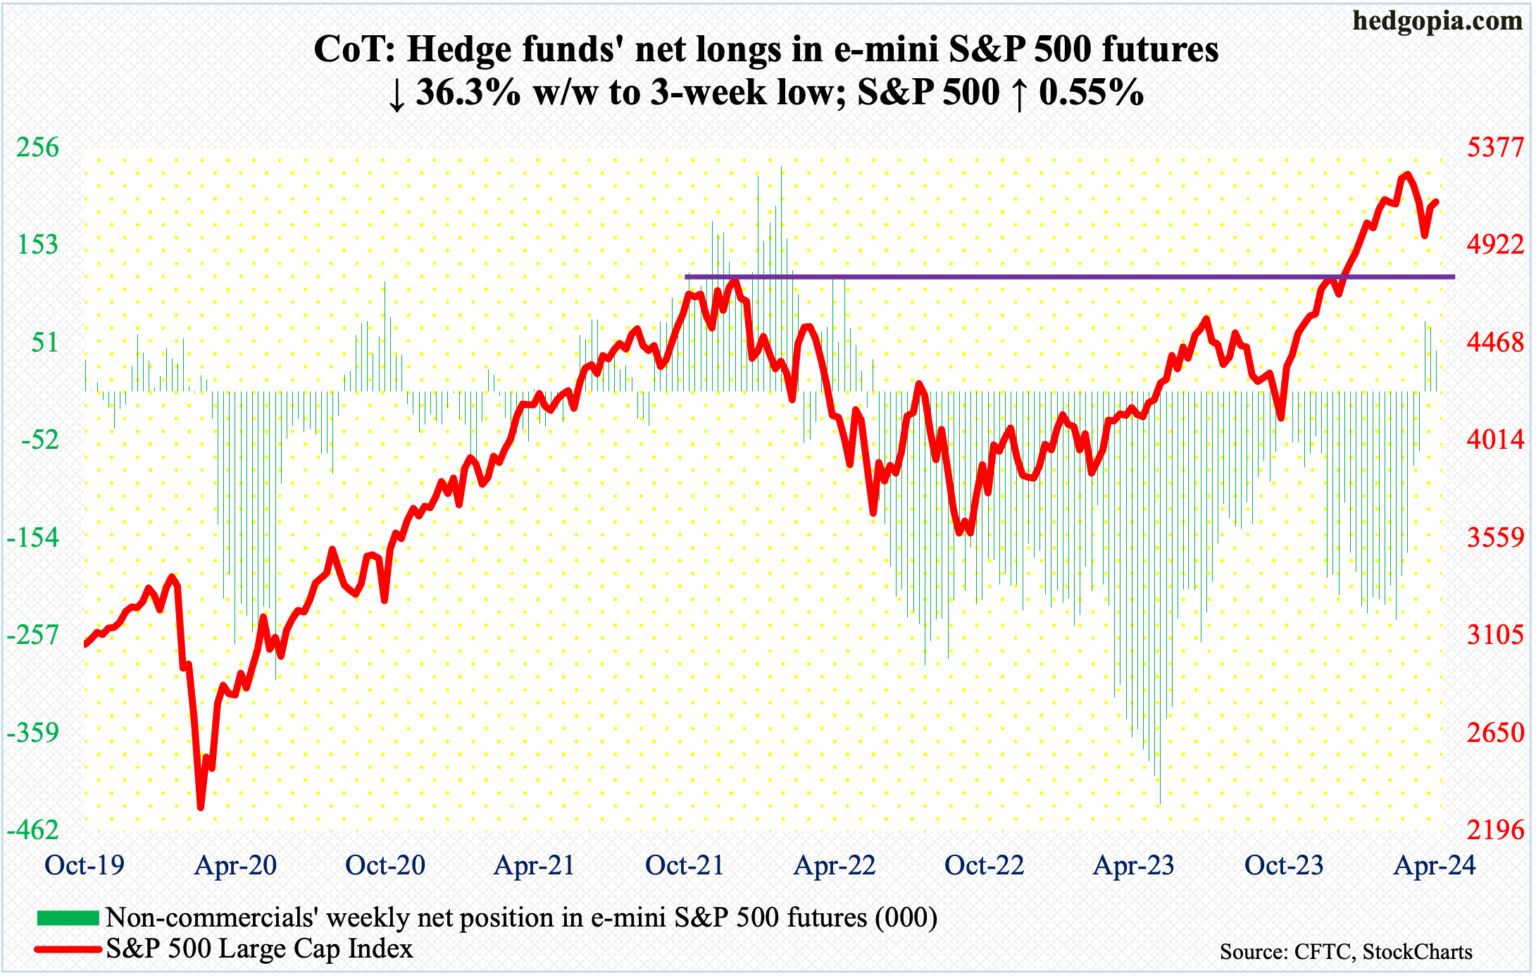
Equity bulls should be very happy with how things turned out this week. The S&P 500 rallied 0.6 percent but at Thursday’s low of 5011 was down 1.7 percent for the week. That low was bought, with the bulls gapping up the index (5128) on Friday to close out the week at the 50-day (5130). Earlier on Monday, their advance was stopped at that average. In the likely event the average gets taken out next week, the next layer of resistance lies at 5170s.
The large cap index peaked at 5265 on March 28th and the subsequent selling stopped at 4954 on April 19th.
Nasdaq (mini): Currently net long 2.8k, down 3.4k.
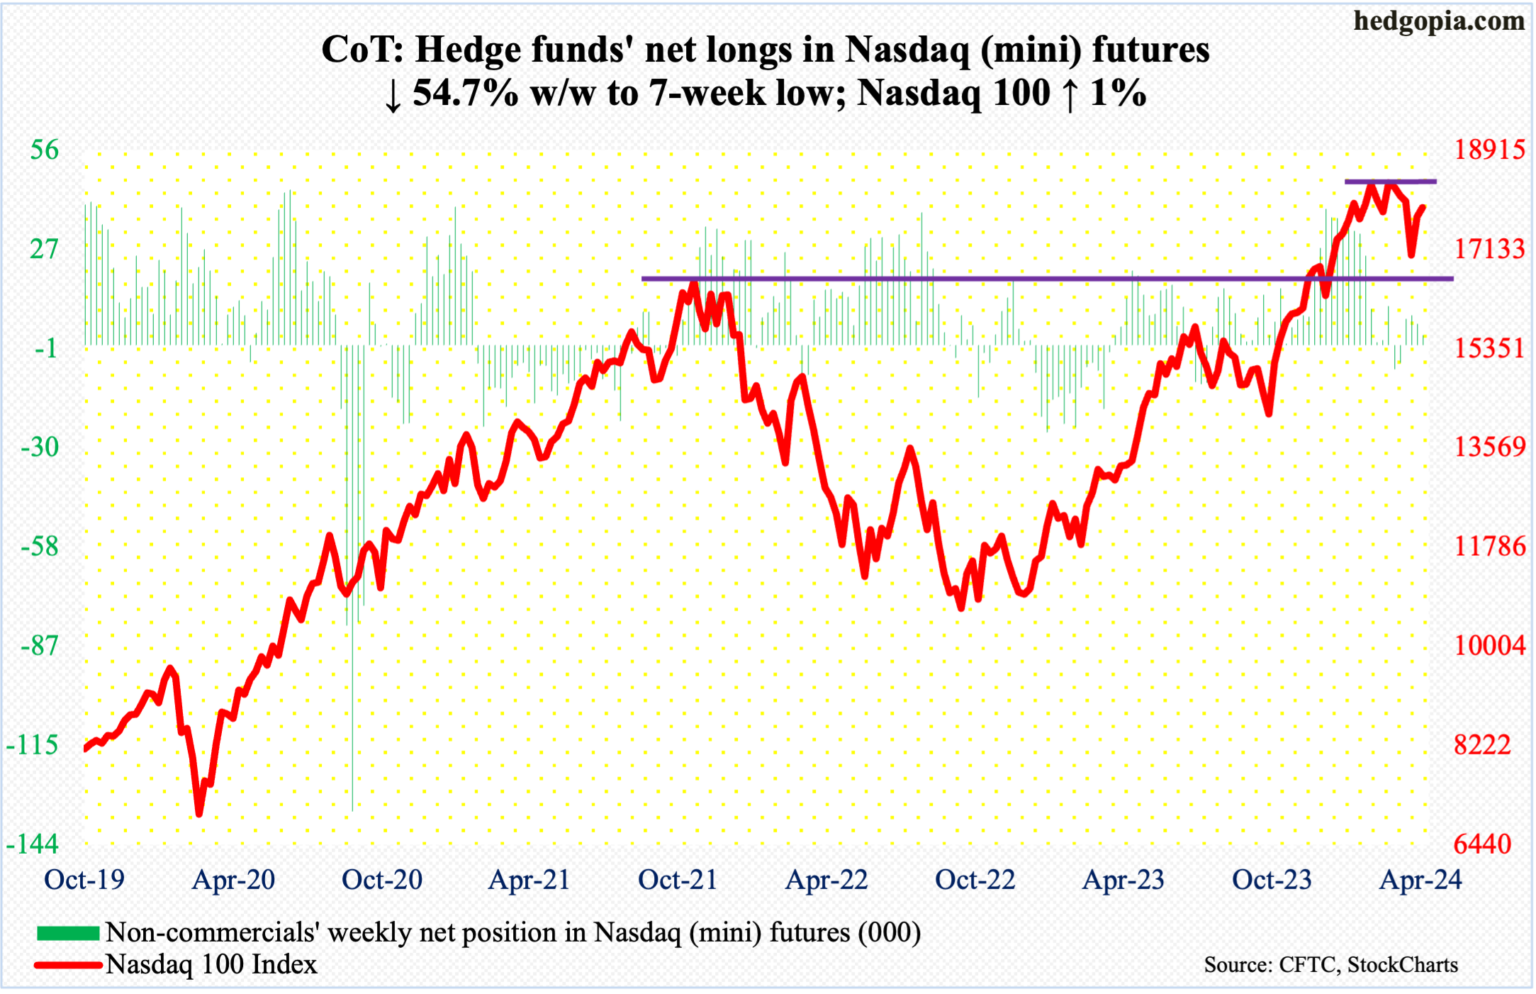
Tech bulls got help from both the FOMC and earnings this week (more on this here). On Wednesday, Chair Jerome Powell shot down the idea of the possibility of a rate hike (more on this here). Then, March-quarter results from both Amazon (AMZN) and Apple (AAPL) pleased investors. The rally in the last two sessions culminated in a one-percent gain for the week, which at one point was down 2.4 percent.
When it was all said and done, the Nasdaq 100 (17891) finished just under the 50-day (17927). The tech-heavy index peaked at 18465 on March 21st, failing to sustainably break out of 18300s for seven weeks before rolling over. Before this resistance gets tested, tech bulls will first have to clear 18100, which represents trendline resistance from that high.
Russell 2000 mini-index: Currently net short 40.3k, up 4.2k.
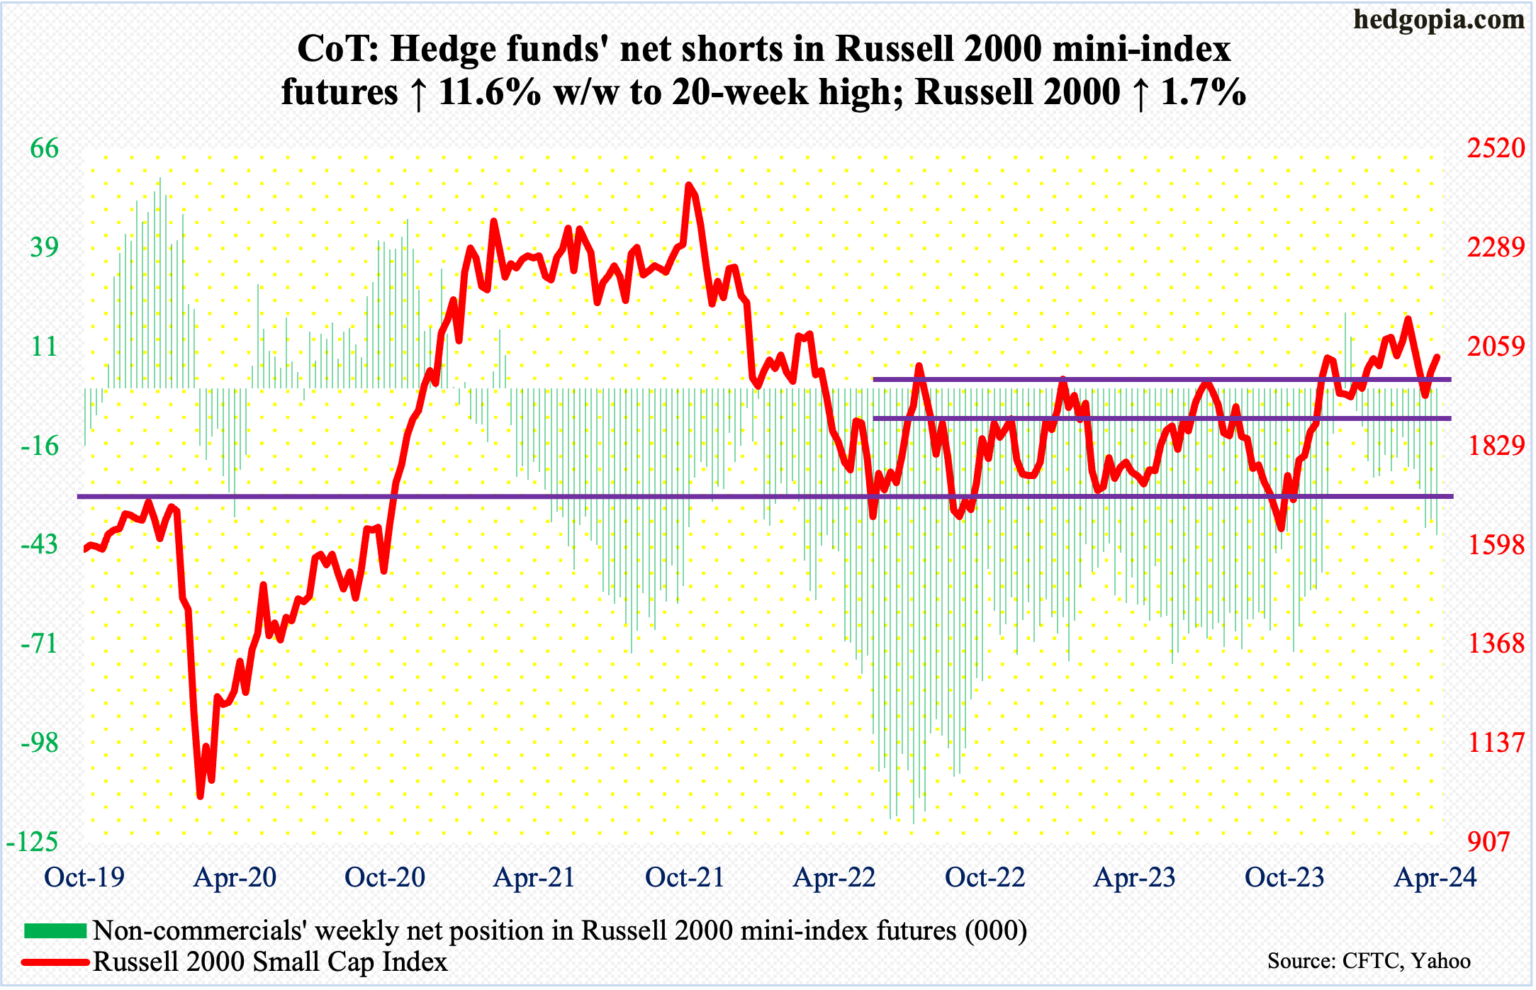
The Russell 2000 rallied 1.7 percent for the week, but small-cap bulls are probably not happy with how Friday fared; the session gapped up to add 1.9 percent intraday but only to reverse to end up one percent to 2036 – just under the 50-day at 2039.
On a closing basis, support at 2000 was breached both Tuesday and Wednesday, touching 1968 intraday Wednesday. At the same time, the small cap index retreated well before reaching 2100 resistance, ticking 2055 on Friday.
The index remains rangebound.
US Dollar Index: Currently net short 35, down 178.
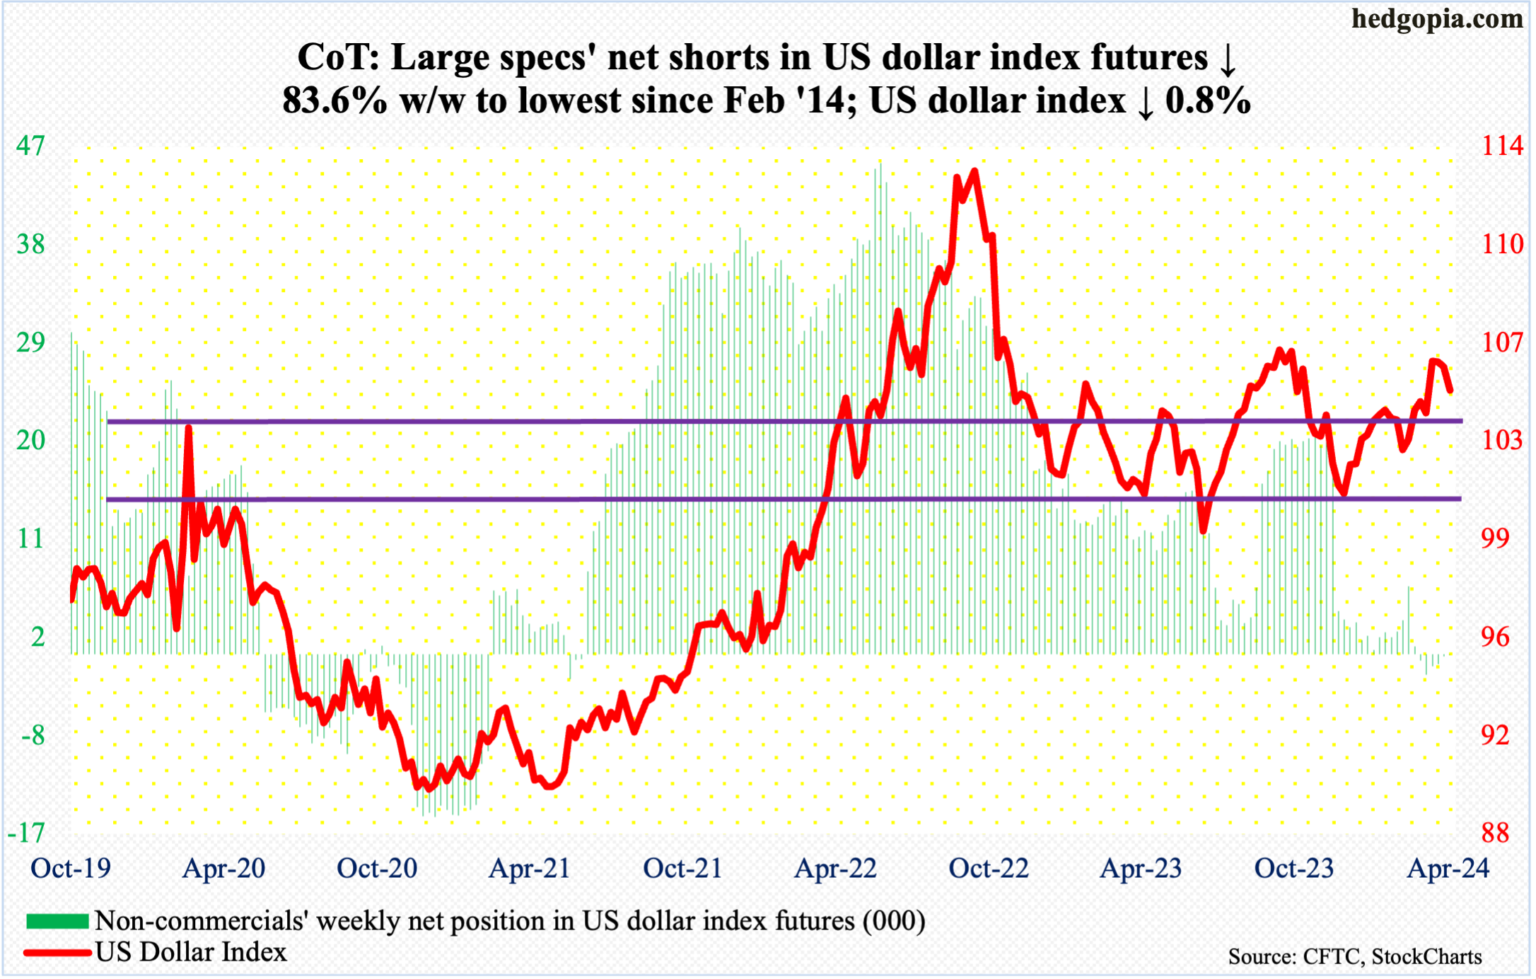
On Wednesday, the US dollar index rallied as high as 106.38 but only to retreat. By Friday, it was down 0.8 percent for the week to 104.92. This was the fourth week in a row the index stalled just north of 106.
Earlier, the index bottomed at 100.32 last December, followed by a takeout three weeks ago of 103-104, which goes back to December 2016.
A crucial test lies ahead. A rising trendline from the December low draws to 104. It is unlikely this support is lost right away. Even on Friday, the intraday low of 104.41 – barely above the 50-day at 104.39 – was bought. That said, the weekly remains way overbought and it is just a matter of time before this trendline is compromised.
VIX: Currently net short 22.4k, up 4.4k.
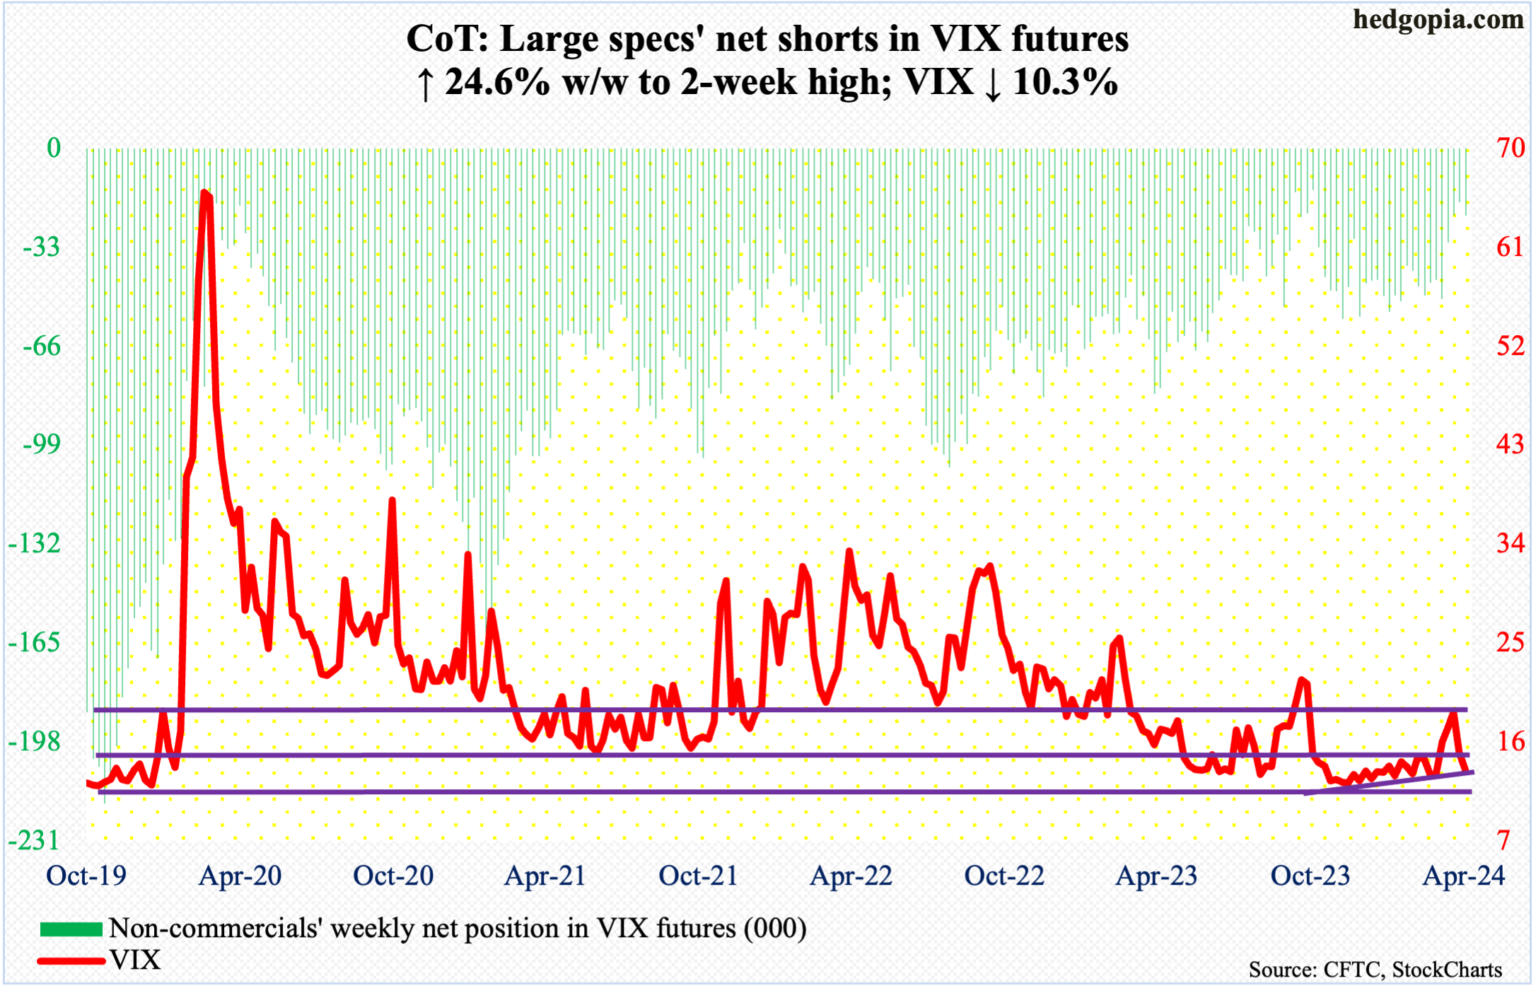
The last time VIX’s weekly RSI rallied above 70 was March 2020; since then, the momentum metric has struggled to rally above 63. This was also true this time, when it turned back down three weeks ago; this was when the volatility index tagged 21.36 and retreated. VIX fell in the subsequent two weeks, with this week’s close of 13.49 comfortably breaching the 50- and 200-day.
VIX is oversold on the daily, and this could very well be a make-or-break moment for volatility bulls. The index closed the week right on a rising trendline from last December when it ticked 11.81 and rallied. This is a must-save.
Read Full Story »»»
DiscoverGold
S&P 500 Index (SPX) »» Weekly Summary Analysis
By: Marty Armstrong | May 4, 2024
S&P 500 Cash Index opened above the previous high and closed above it as well warning of a bullish posture right now. It closed today at 512779 and is trading up about 7.50% for the year from last year's settlement of 476983. This price action here in May is reflecting that this is within the scope of a bearish reactionary move on the monthly level thus far.
ECONOMIC CONFIDENCE MODEL CORRELATION
Here in S&P 500 Cash Index, we do find that this particular market has correlated with our Economic Confidence Model in the past. The Last turning point on the ECM cycle low to line up with this market was 2009 and 2002. The Last turning point on the ECM cycle high to line up with this market was 2022 and 2007 and 2000.
MARKET OVERVIEW
NEAR-TERM OUTLOOK
The S&P 500 Cash Index has continued to make new historical highs over the course of the rally from 1974 moving into 2024. Noticeably, we have elected two Bullish Reversals to date.
This market remains in a positive position on the weekly to yearly levels of our indicating models. Pay attention to the Monthly level for any serious change in long-term trend ahead.
Focusing on our perspective using the indicating ranges on the Daily level in the S&P 500 Cash Index, this market remains neutral with resistance standing at 513877 and support forming below at 512349. The market is trading closer to the support level at this time. An opening below this level in the next session will imply a decline is unfolding.
On the weekly level, the last important high was established the week of March 25th at 526485, which was up 22 weeks from the low made back during the week of October 23rd. We have been generally trading up for the past 2 weeks from the low of the week of April 15th, which has been a move of 3.745%. When we look deeply into the underlying tone of this immediate market, we see it is currently still in a weak posture. Immediately, this decline from the last high established the week of March 25th has been important closing sharply lower as well. Before, this recent rally exceeded the previous high of 479330 made back during the week of December 25th. That high was likewise part of a bullish trend making higher highs over the week of October 16th. This immediate decline has thus far held the previous low formed at 410378 made the week of October 23rd. Only a break of that low would signal a technical reversal of fortune and of course we must watch the Bearish Reversals. Right now, the market is below momentum on our weekly models casting a bearish cloud over the price action as well as trend, long-term trend, and cyclical strength. Looking at this from a wider perspective, this market has been trading up for the past 17 weeks which from a timing perspective warrants concern.
INTERMEDIATE-TERM OUTLOOK
YEARLY MOMENTUM MODEL INDICATOR
Our Momentum Models are rising at this time with the previous low made 2022 while the last high formed on 2023. However, this market has rallied in price with the last cyclical high formed on 2022 warning that this market remains strong at this time on a correlation perspective as it has moved higher with the Momentum Model.
Looking at the longer-term monthly level, we did see that the market has made a low following the previous high of March at 495356. The fact that the market for April close below the previous month's low is a sign of near-term weakness with a possible decline into the next turning point on the Array. So far here in May this market has held above last month's low reaching 501105.
Critical support still underlies this market at 438504 and a break of that level on a monthly closing basis would warn that a sustainable decline ahead becomes possible. Immediately, the market is trading within last month's trading range in a neutral position.
DiscoverGold
Nasdaq Composite Index (COMP) »» Weekly Summary Analysis
By: Marty Armstrong | May 4, 2024
ECONOMIC CONFIDENCE MODEL CORRELATION
Here in NASDAQ Composite Index Cash, we do find that this particular market has correlated with our Economic Confidence Model in the past. The Last turning point on the ECM cycle low to line up with this market was 2022 and 2009 and 2002. The Last turning point on the ECM cycle high to line up with this market was 2007 and 2000.
MARKET OVERVIEW
NEAR-TERM OUTLOOK
The NASDAQ Composite Index Cash has continued to make new historical highs over the course of the rally from 2009 moving into 2024. Clearly, we have elected four Bullish Reversals to date.
This market remains in a positive position on the weekly to yearly levels of our indicating models. Pay attention to the Monthly level for any serious change in long-term trend ahead.
Looking at the indicating ranges on the Daily level in the NASDAQ Composite Index Cash, this market remains moderately bullish currently with underlying support beginning at 1615465 and overhead resistance forming above at 1625141. The market is trading closer to the support level at this time. An opening below this level in the next session will imply a decline is unfolding.
On the weekly level, the last important high was established the week of March 18th at 1653886, which was up 21 weeks from the low made back during the week of October 23rd. We have been generally trading up for the past 2 weeks from the low of the week of April 15th, which has been a move of 6.450%. When we look deeply into the underlying tone of this immediate market, we see it is currently still in a weak posture. Immediately, this decline from the last high established the week of March 18th has been important Before, this recent rally exceeded the previous high of 1515007 made back during the week of December 25th. That high was likewise part of a bullish trend making higher highs over the week of October 9th. This immediate decline has thus far held the previous low formed at 1254386 made the week of October 23rd. Only a break of that low would signal a technical reversal of fortune and of course we must watch the Bearish Reversals. Right now, the market is neutral on our weekly Momentum Models warning we have overhead resistance forming and support in the general vacinity of 1604656. Additional support is to be found at 1586263. Looking at this from a wider perspective, this market has been trading up for the past 17 weeks which from a timing perspective warrants concern.
INTERMEDIATE-TERM OUTLOOK
YEARLY MOMENTUM MODEL INDICATOR
Our Momentum Models are rising at this time with the previous low made 2022 while the last high formed on 2023. However, this market has rallied in price with the last cyclical high formed on 2021 warning that this market remains strong at this time on a correlation perspective as it has moved higher with the Momentum Model.
Looking at the longer-term monthly level, we did see that the market has made a low following the previous high of March at 1522278. The fact that the market for April close below the previous month's low is a sign of near-term weakness with a possible decline into the next turning point on the Array. So far here in May this market has held above last month's low reaching 1555764.
Critical support still underlies this market at 1405840 and a break of that level on a monthly closing basis would warn that a sustainable decline ahead becomes possible. Immediately, the market is trading within last month's trading range in a neutral position.
DiscoverGold
Markets Monthly Pattern »» Watchlist - Top 10
By: Marty Armstrong | May 3, 2024
• Dow Jones Industrials Index »» Still Under Pressure
• NASDAQ Composite Index »» New Pattern Forming
• NASDAQ 100 Index »» New Pattern Forming
• S&P 500 Index »» New Pattern Forming
• Russell 2000 Index »» Neutral at this time
• US Dollar Index »» Temp Pause
• CBOE VIX Index »» Turning BACKDOWN
• NY Gold Futures »» New Pattern Forming
• NY Silver COMEX Futures »» Holding
• NY Crude Oil Futures »» Turning BACKDOWN
DiscoverGold
$SPX Woah $Millions of Calls
By: Cheddar Flow | May 3, 2024
• $SPX Woah

Read Full Story »»»
DiscoverGold
The 10 Top/Bottom NASDAQ 100 Index percent net change performers
By: Thom Hartle | May 3, 2024
• Today (8:34 CST), the 10 top/bottom percent net change performers in the NASDAQ 100 Index.

Read Full Story »»»
DiscoverGold
Dovish Message Likely To Ignite Positive Wealth Effect From Equities And Home Prices
By: Hedgopia | May 2, 2024
Markets were on pins and needles as to if Powell would be open to the possibility of a rate hike. He hardly sounded hawkish Wednesday. A dovish message hardly helps cool down the positive wealth effect coming from equities and home prices. It could rather be helping inflation remain sticky.
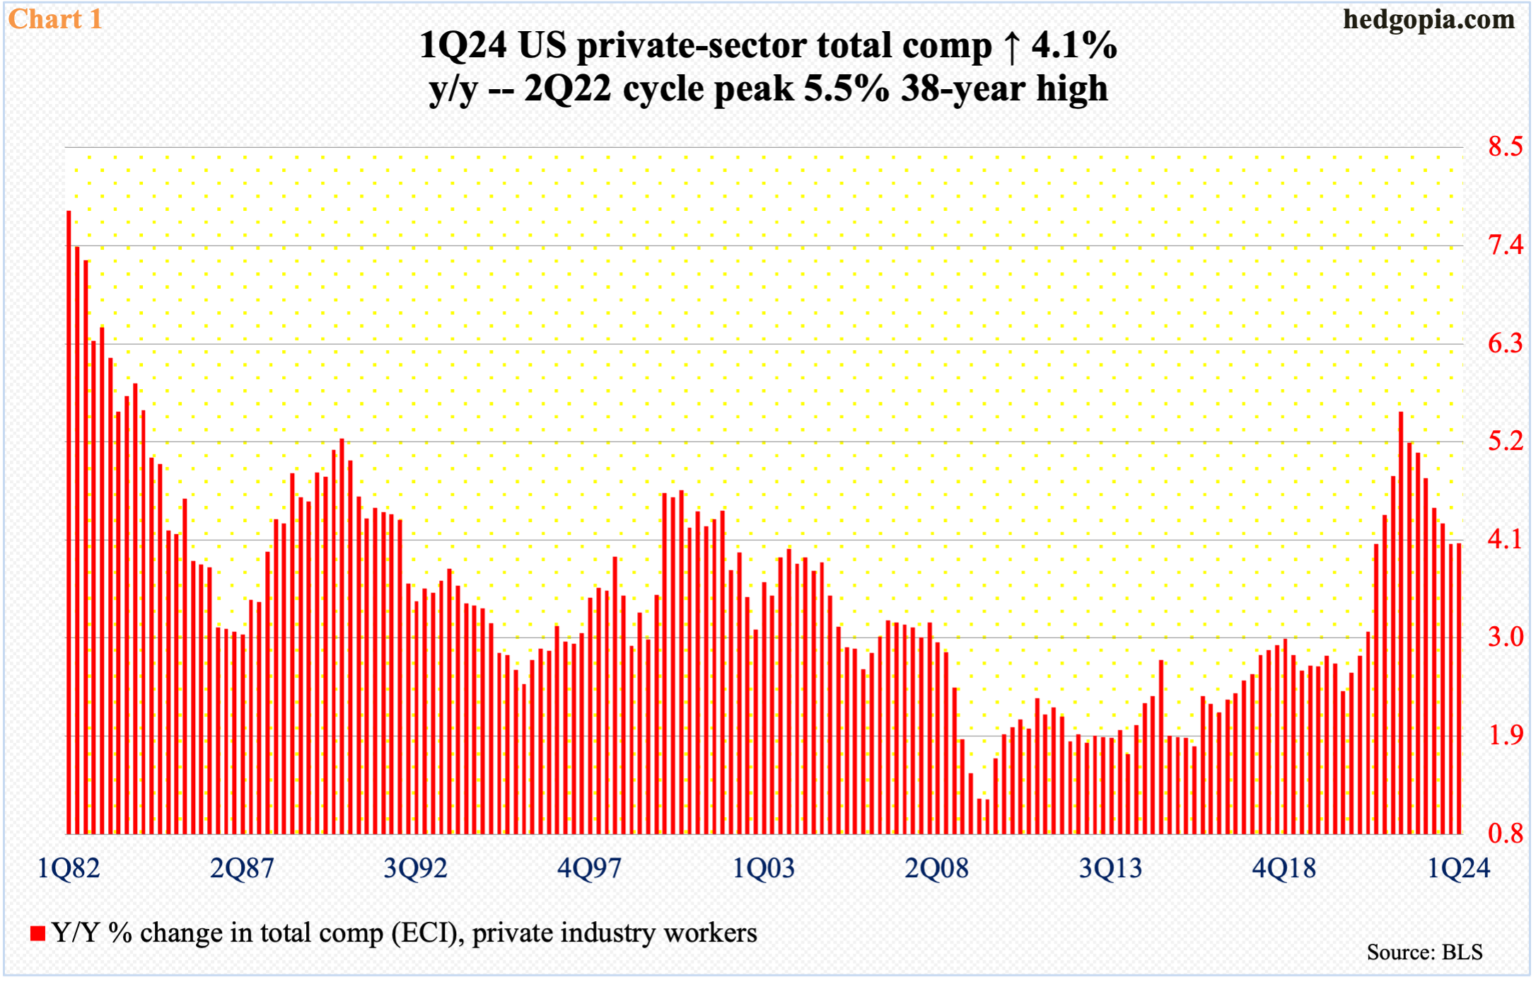
A day prior to the conclusion of the two-day FOMC meeting, the employment cost index for the March quarter was released, and it came in hotter than expected. Private-industry total compensation increased 4.1 percent from a year ago. The series peaked in 2Q22 at 5.5 percent, which was a 38-year high, and has been north of four percent for 11 quarters now (Chart 1).
This comes on the heels of hotter-than-expected readings in recent months in both the consumer price index and personal consumption expenditures. Price increases are not dropping at the rate many had hoped.
Of late, several FOMC members have sounded alarmed by prospects of sticky inflation, with some even stating only one rate cut – at best – was needed this year; the March-meeting dot plot showed FOMC members expected three 25-basis-point cuts. The fed funds rate, after having been raised from a range of zero to 25 basis points in March 2022 to between 525 basis points and 550 basis points through last July, was once again left unchanged this week.
With most economic data coming in stronger than expected of late, markets were nervous if Chair Jerome Powell would open the door to the possibility of a hike, if the need be. He did not, stating in the post-meeting presser that “I think it’s unlikely that the next policy rate move will be a hike. I’d say it’s unlikely.”
When pressed what it would take for them to hike, he said, “I think we’d need to see persuasive evidence that our policy stance is not sufficiently restrictive to bring inflation sustainably down to two percent over time. That is not what we think we’re seeing.”
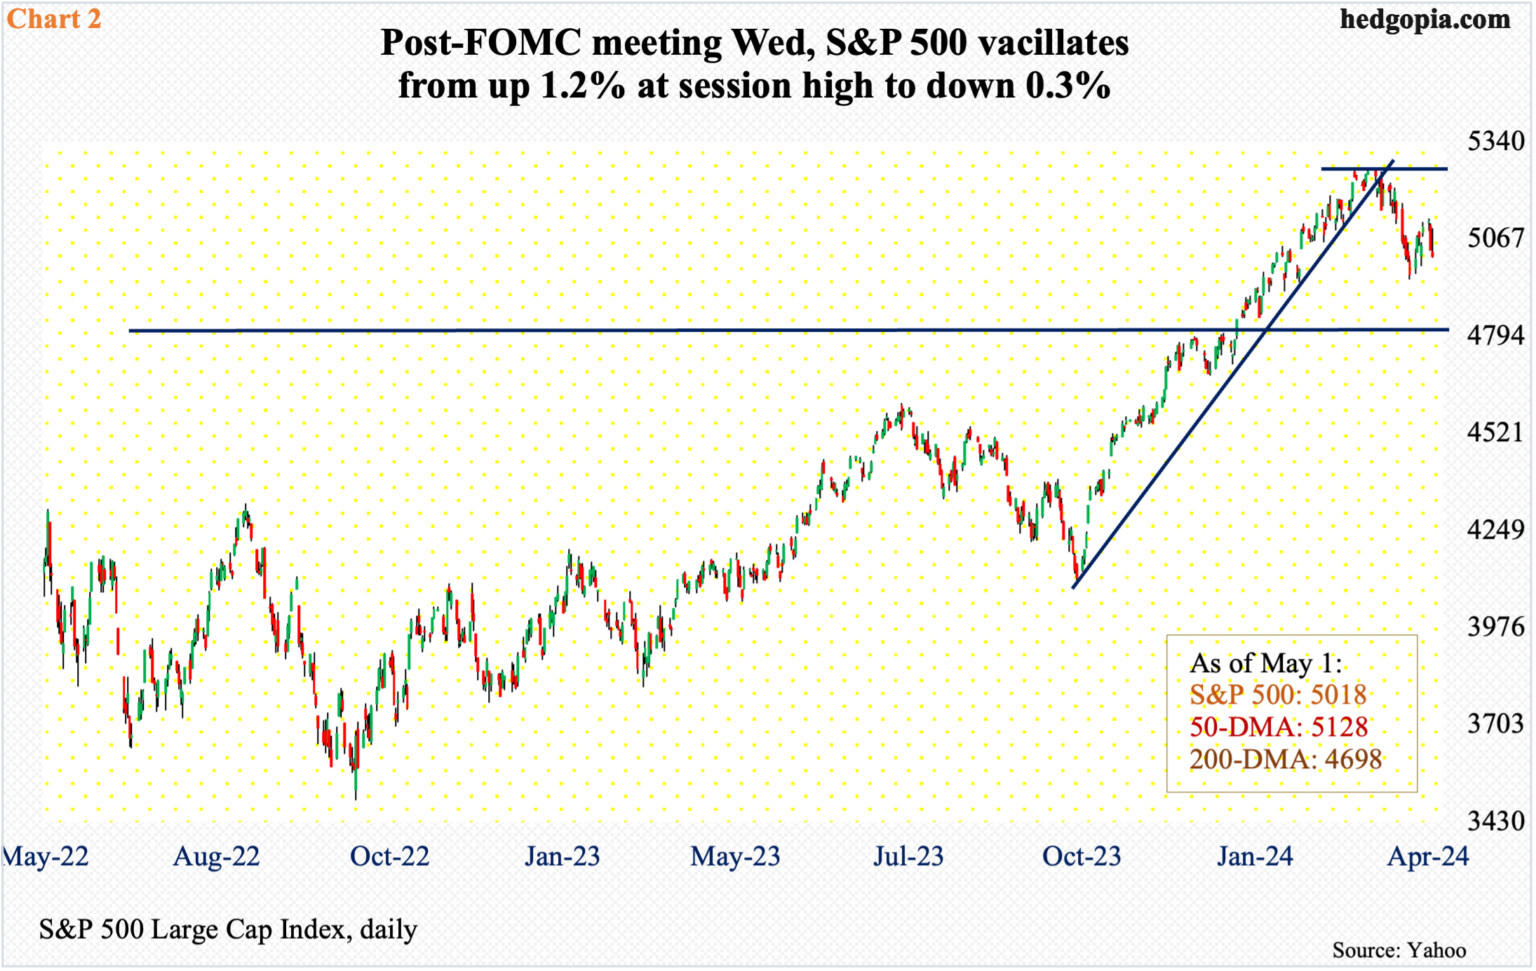
On Wednesday, markets were confused, and this was reflected in how equities traded. Stocks took off at 2:30, rallied hard for half an hour until they rolled over at 3:00. The S&P 500 reversed from up 1.2 percent at the session high to down 0.3 percent at close, with a massive shooting star (Chart 2); on Monday, sellers showed up at 50-day moving average.
Deep down, Powell’s body language suggests there is a clear bias toward easing. But they need data to cooperate. Apart from the economy refusing to show signs of deceleration, stocks have rallied huge since last October’s low, adding trillions in market cap, and that helps consumer mood/spending. Ditto with housing. Home prices are rising once again.
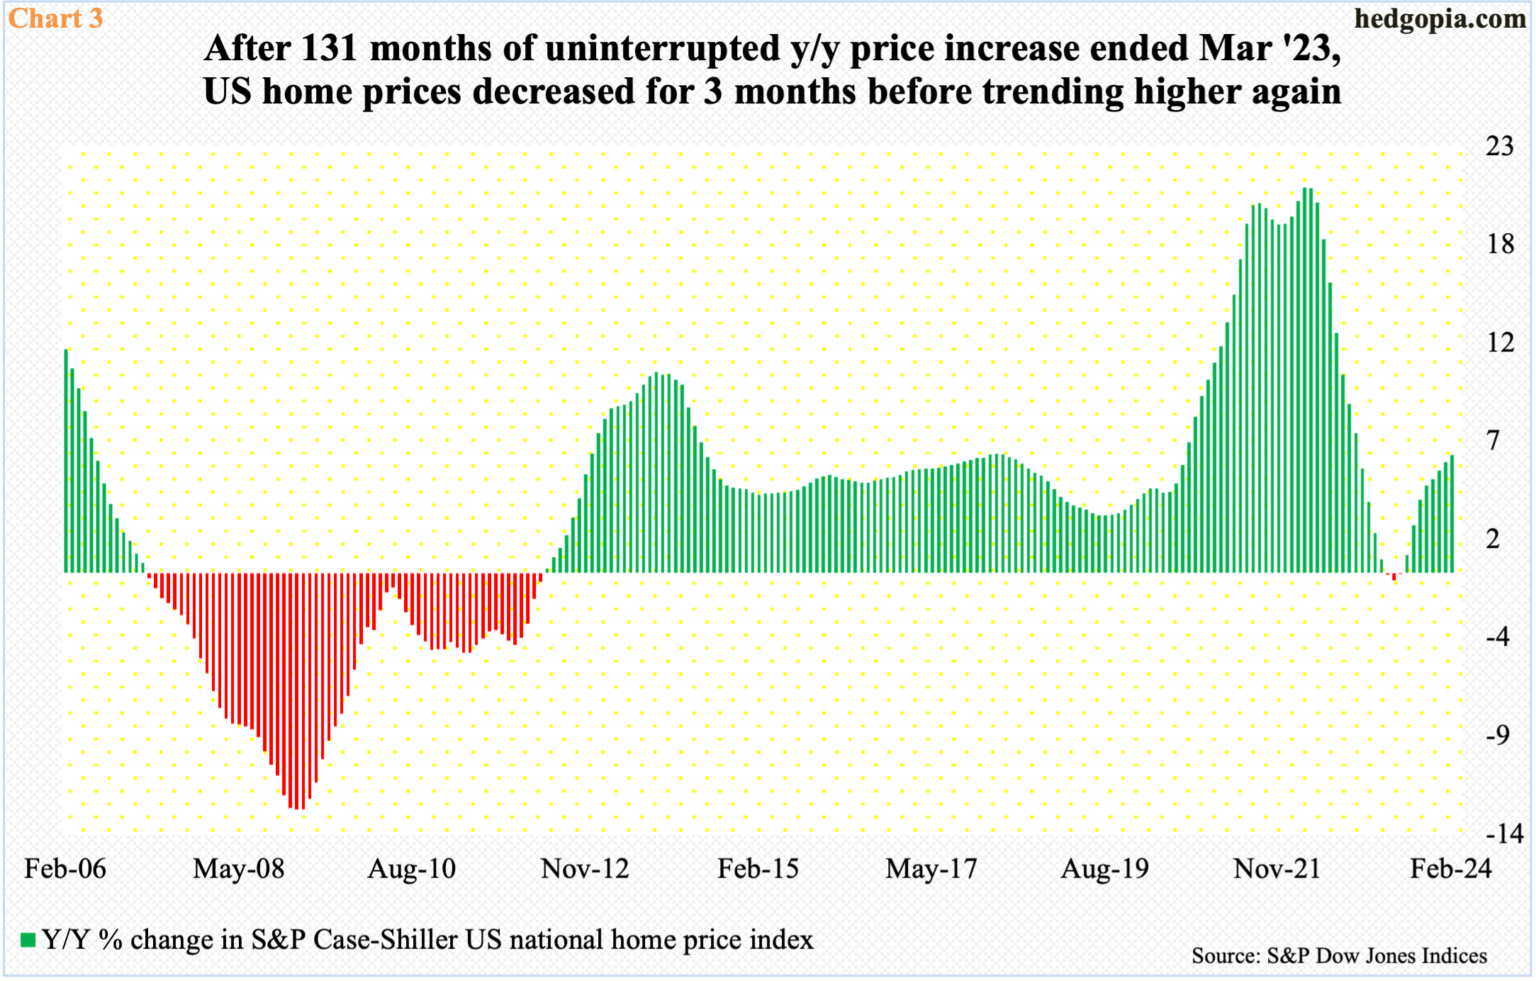
In February, using the S&P Case-Shiller home price index, US home prices firmed up 6.4 percent year-over-year. This was the steepest price appreciation in 15 months. In March 2022, prices were rising at a record 20.8 percent, before going the other way. For three months from April through June last year, prices dropped, albeit marginally (Chart 3). Since last July, the growth rate has been in acceleration.
The Federal Reserve has time on its side and likely takes time on rate cuts. One can argue the monetary policy is not restrictive enough to particularly impact equities and home prices, which influence inflation through the wealth effect. A dovish message at a time like this does not help.
Read Full Story »»»
DiscoverGold
S&P 500 Election Year 2024 vs. 1968 & 2012
By: Almanac Trader | May 3, 2024

With all the college protests in the news it brings comparisons of 1968 to mind. 2024’s Big Election Year Q1 gains have already put the 2012 analog in my sights. Both were election years with somewhat correlated yet somewhat different narratives to 2024. The chart is from my members only webinar yesterday. S&P is clearly tracking 2012, not 1968 so far this year.
1968 was marked by escalations in Vietnam, the Tet Offensive, and protests on US college campuses and elsewhere. Sitting President Lyndon Johnson dropped out of the race on March 31. Robert Kennedy senior, the leading democratic candidate, was assassinated on June 6. George Wallace ran a formidable third-party candidacy garnering 13.5% of the popular vote and won 5 states and 46 electoral votes. But Q1 was down, and April was up.
In 2012 sitting President Barak Obama ran and won reelection. It was a year with the market driven by the Fed and interest rates. Zero interest rate policy (ZIRP) and quantitative easing (QE) were dug in deep. The Fed spun out QE3 and Operation Twist. Q1 was up big followed by a down April. Again, aside from the protests and wars 2024 is correlated more closely to 2012 than 1968.
This updated S&P 500 Election Year Seasonal Pattern chart underscores the market’s tendency to be weaker in April and May after big Q1 gains in election years 1956, 1964, 1972, 1976, 1988, 1996, 2012. However, the market is likely to be flatter than the green line above due to inflation, the Fed, interest rates, a prominent third party candidate and two ongoing wars. Page 26 of the 2024 Stock Trader’s Almanac reminds us that “War Can Be a Major Factor on Presidential Races. Democrats historically lost on foreign shores while Republicans lost at home.

Read Full Story »»»
DiscoverGold
Money managers Increased their exposure to the US Equity markets since last week...
DiscoverGold
NAAIM Exposure Index
May 2, 2024 
The NAAIM Number
61.97
Last Quarter Average
87.84
»»» Read More…
$SPY $2.8M OTM Call Volume for this strike + expiration has been rising steadily all week
By: Cheddar Flow | May 2, 2024
• $SPY $2.8M OTM Call
Volume for this strike + expiration has been rising steadily all week
*Above the Ask*


Read Full Story »»»
DiscoverGold
The 10 Top/Bottom S&P 500 Index percent net change performers
By: Thom Hartle | May 2, 2024
• Today (8:34 CST), the 10 top/bottom percent net change performers in the S&P 500 Index.

Read Full Story »»»
DiscoverGold
The AAII Investor Sentiment
By: AAII | May 2, 2024
Bullish 38.5%
Neutral 29.0%
Bearish 32.5%
• Historical 1-Year High
Bullish: 52.9%
Neutral: 37.4%
Bearish: 50.3%
Read Full Story »»»
DiscoverGold
Interest Rates & Fed Policy
By: Marty Armstrong | May 2, 2024
The major resistance is 6.25%, and support is 4.5%. Powell fully understands what is going on. Inflation will not die. As we have laid out, we are looking at STAGFLATION.
The Yearly Timing Array further confirms that we are considering rising rates into 2027. This is the War Cycle from every possible direction we investigate. Any reduction is possible briefly by a quarter point if he sees the economy turning down in July. Real Estate jumped 6%+ in February, and all this money handed out to Ukraine is inflationary, just as the Vietnam War broke the back of Bretton Woods.
DiscoverGold
$SPY $1.2 Million Unusual Far OTM Put Ahead of FOMC
By: Cheddar Flow | May 1, 2024
• $SPY $1.2M Unusual Far OTM Put Ahead of FOMC
The majority of similar prints have been above or at the ask with stable volume
It seems like this is a hedge prior to the event


Read Full Story »»»
DiscoverGold
S&P 500: Should long-term investors ignore the old adage "sell in May and go away?"
By: Isabelnet | May 1, 2024
• S&P 500
Should long-term investors ignore the old adage "sell in May and go away?".

Read Full Story »»»
DiscoverGold
The net difference between bulls and bears reflects the overall sentiment and suggests a temporary pullback within a bullish market trend
By: Isabelnet | May 1, 2024
• Sentiment
The net difference between bulls and bears reflects the overall sentiment and suggests a temporary pullback within a bullish market trend.

Read Full Story »»»
DiscoverGold
The 10 Top/Bottom NASDAQ 100 Index percent net change performers
By: Thom Hartle | May 1, 2024
• Today (8:33 CST), the 10 top/bottom percent net change performers in the NASDAQ 100 Index.

Read Full Story »»»
DiscoverGold
$SPX - Micro-Chart Update of the 'Broadening' Plot formed within the lrgr one from yesterdays 5-Min chart. Here shown on a 1-Min...
By: Sahara | May 1, 2024
• $SPX - Micro-Chart Update
An update of the 'Broadening' Plot formed within the lrgr one from yesterdays 5-Min chart. Here shown on a 1-Min...

Read Full Story »»»
DiscoverGold
More Pain Ahead for the NASDAQ100?
By: Dr. Arnout Ter Schure | April 30, 2024
• A counter-trend rally has most likely been completed, contingent on holding below at least $18100, and the index should be ready to drop to $15900+/-500.
Was That a Dead Cat Bounce?
In our previous update from early April (see here), we found that the NASDA100 (NDX) had peaked at $18464 on March 21, which was only 0.81% below the ideal target of ~$18615 we had set forth three weeks prior. As such, we concluded:
“…Thus, our preferred [Elliott Wave Principle] (EWP) count is for a larger top to have formed, … and [the Index] is heading for the ideal black W-4? target zone of $15900+/-200.”
Over the next seven trading days, the index lost an additional 5.8%, validating our warning, but it has since staged a 5% rally to yesterday’s $17820 high. Thus, is the correction over, or did we experience a “Dead cat bounce”?
Once again, the EWP can greatly help us. Namely, the rally from the April 19 low has so far been in three (green) waves. See the chart in Figure 1 below. Three-wave rallies are counter-trend rallies, aka “dead cat bounces.”
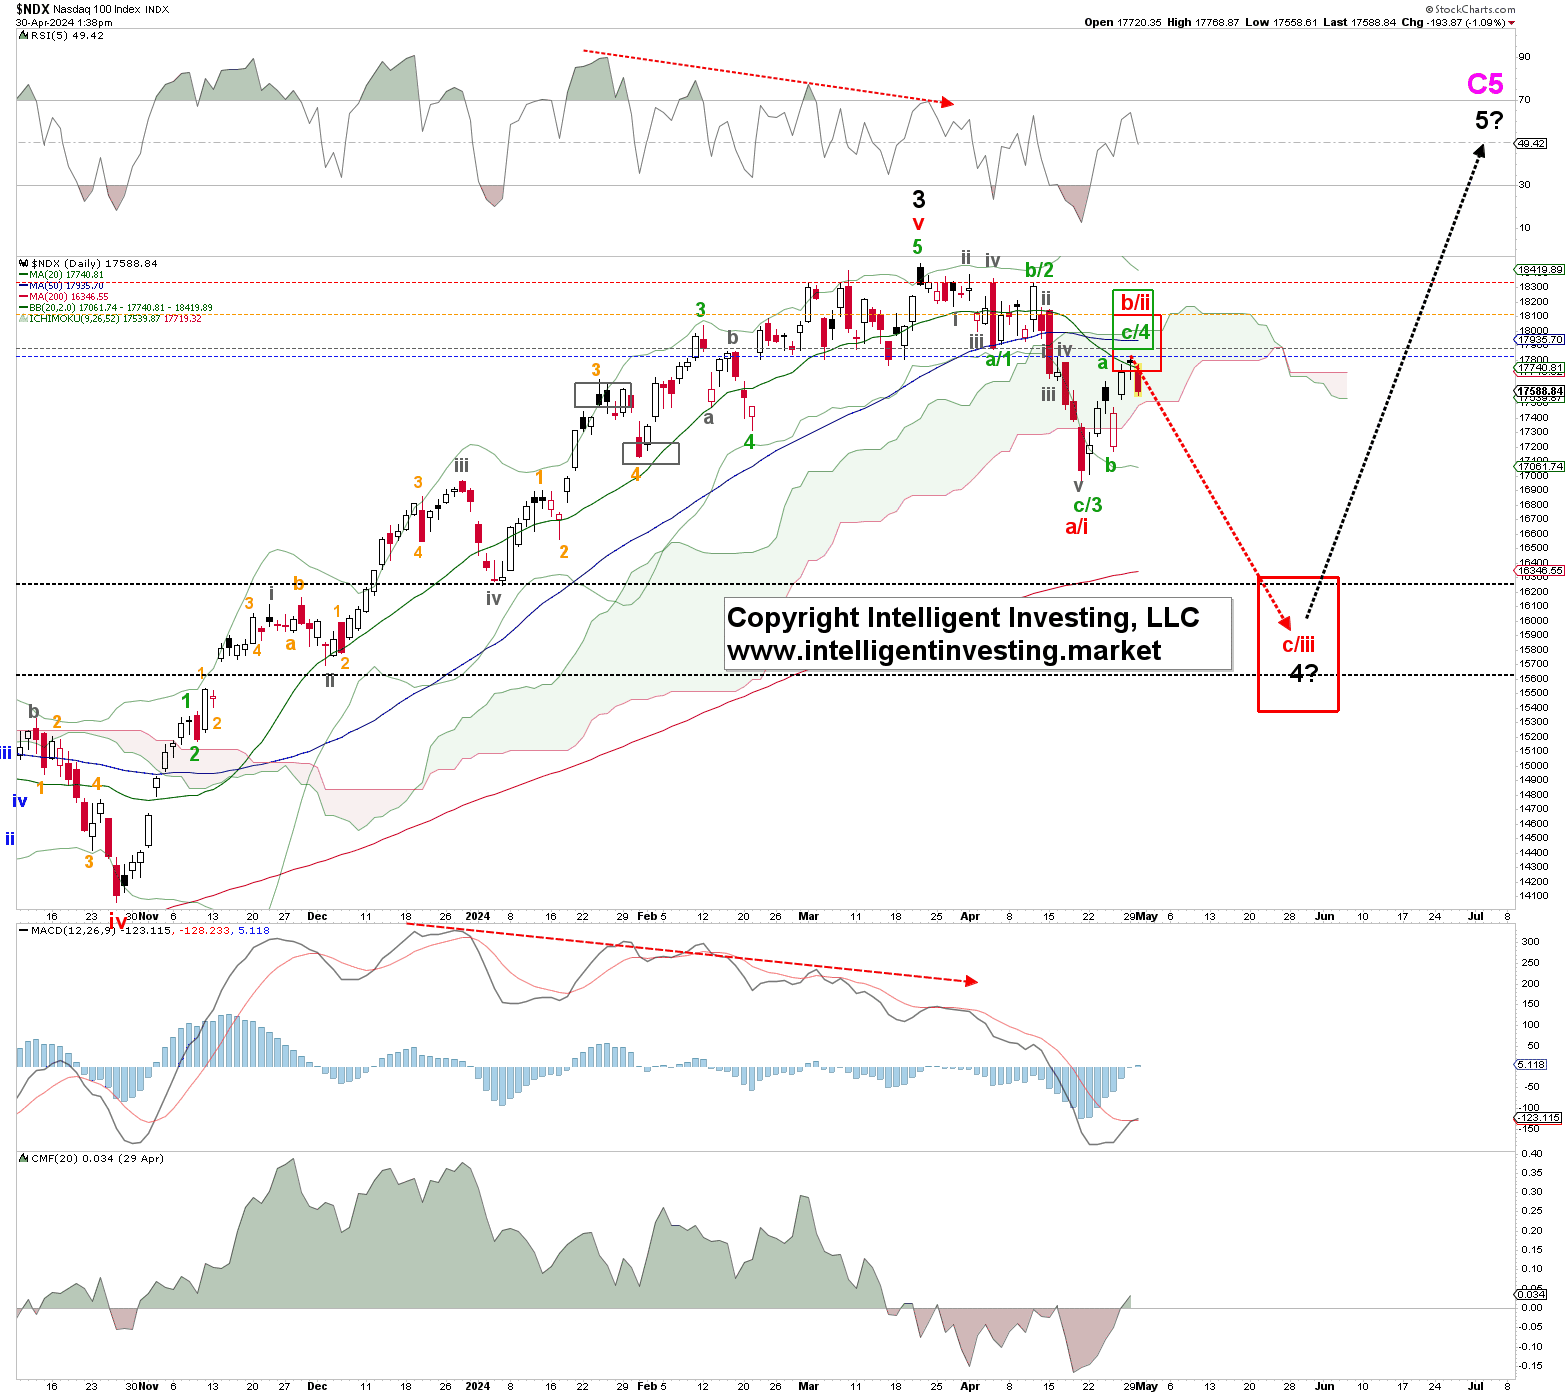
Thus, our preferred EWP count is for a larger top to have formed yesterday, the red W-b/ii, contingent on holding below the colored warning levels shown in Figure 1 above. The index should now be ready to embark on its red W-c/iii leg lower to ideally $15900+/-500, depending on the Fibonacci extension of this second leg lower.
Our less likely alternative is that yesterday’s high was only a fourth wave and a smaller decline to around $16700+/-100 awaits. The “countertrend rally and the next leg-lower” sequence can commence there.
Seasonality and the Anatomy of a Three-wave Rally
However, based on seasonality for an election year, where we look at the Dow Jones because it allows us to have 32 data points vs. only ten if we use the much younger NDX, the recent April 19 low and April 29 high were right on queue. See Figure 2 below. Moreover, as you can see from our X/Twitter profile here, we have accurately forecasted every market high and low since last week using a counter-trend scenario/EWP count. Forecasts like these dramatically help our premium members to stay on the right side of the market.
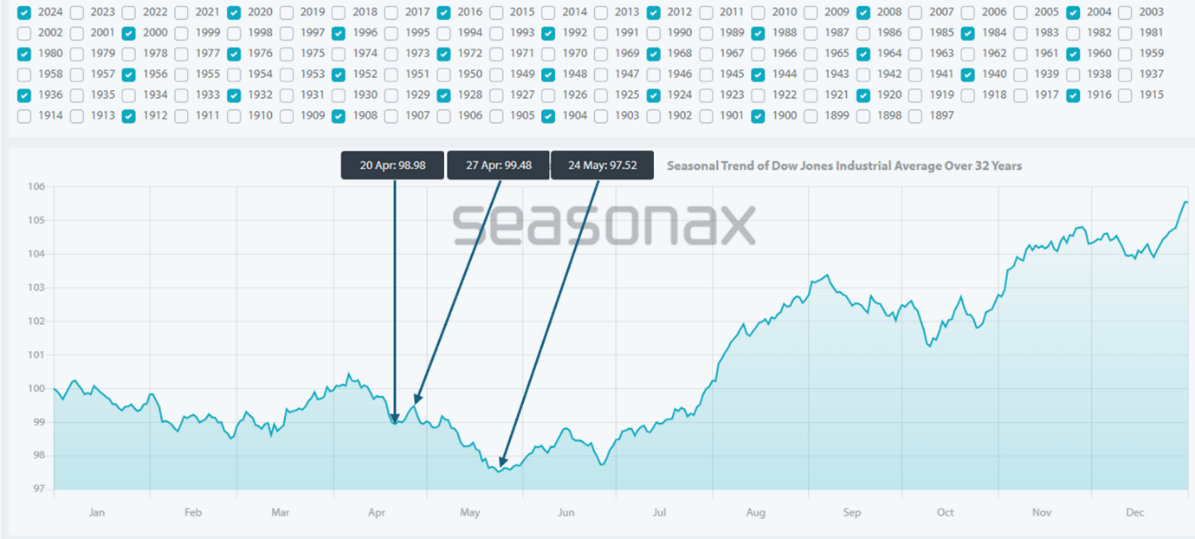
Figure 2. Dow Jones average seasonality for an election year since 1897, resulting in 32 data points.
Thus, six weeks ago, we found the NDX would likely top at around $18615, and we got $18464. Three weeks ago, we warned that a significant top could have formed and were validated with a 5.8% decline since. The current rally off the recent low counts best as a counter-trend rally and, together with seasonality, suggests the next leg lower to ideally $15900+/-500, is underway, contingent on holding below the warning levels for the Bears outlined in this article. Lastly, please note that a break below the October 2023 low tells us the bull market is over.
Read Full Story »»»
DiscoverGold
May’s First Trading Day: S&P 500 and Russell 2000 Higher 69.2% of the Time
By: Almanac Trader | April 30, 2024

The first trading day of May has had a bullish history over the past 26 years. DJIA, S&P 500 and NASDAQ have all averaged around 0.4% on the day. S&P 500 and Russell 2000 have the best track records, up 18 times or 69.2% of the time since 1998. With an average gain of 0.21%, Russell 2000 is slightly weaker. May’s first trading day’s worst loss was in 2020. DJIA and S&P 500 shed over 2.5% while NASDAQ and Russell 2000 dropped over 3%.

Read Full Story »»»
DiscoverGold
$SPX Hello there $145+ Million Calls
By: Cheddar Flow | April 30, 2024
• $SPX Hello there

Read Full Story »»»
DiscoverGold
$SPX Large $40+ Million ATM Call Roll
By: Cheddar Flow | April 30, 2024
• $SPX Large $40M+ ATM Call Roll
This whale is likely rolling their 4/30's to 5/31 here for end of month rebalancing
Even though both are above the ask, the split, expiration change and timing make it a contract roll

Read Full Story »»»
DiscoverGold
The 10 Top/Bottom S&P 500 Index percent net change performers
By: Thom Hartle | April 30, 2024
• Today (8:33 CST), the 10 top/bottom percent net change performers in the S&P 500 Index.

Read Full Story »»»
DiscoverGold
The 10 Top/Bottom NASDAQ 100 Index percent net change performers
By: Thom Hartle | April 30, 2024
• Today (8:33 CST), the 10 top/bottom percent net change performers in the NASDAQ 100 Index.

Read Full Story »»»
DiscoverGold
S&P 500: The current reading of 68.37 indicates that the US stock market is not yet overbought, suggesting that there is still upside potential
By: Isabelnet | April 30, 2024
• S&P 500
The current reading of 68.37 indicates that the US stock market is not yet overbought, suggesting that there is still upside potential.

Read Full Story »»»
DiscoverGold
The Zweig Breadth Thrust is considered the granddaddy of thrusts, with an excellent record of signaling ends to corrections...
By: SentimenTrader | April 30, 2024
• The Zweig Breadth Thrust is considered the granddaddy of thrusts, with an excellent record of signaling ends to corrections. It got close to triggering this time but fell short.
Even so, its behavior so far is compelling and may be enough of a tailwind for bulls, even if it's far from "official."

Read Full Story »»»
DiscoverGold
The S&P 500 Financials triggered a bullish signal when the percentage of stocks trading above their 10-day average surged above 80%, following more than 80% of the issues achieving an oversold condition. This surge from an oversold status occurred within the context of more than 80% of members closing above their 200-day average
By: SentimenTrader | April 29, 2024
• The S&P 500 Financials triggered a bullish signal when the percentage of stocks trading above their 10-day average surged above 80%, following more than 80% of the issues achieving an oversold condition. This surge from an oversold status occurred within the context of more than 80% of members closing above their 200-day average.

Read Full Story »»»
DiscoverGold
Markets Monthly Pattern »» Watchlist - Top 10
By: Marty Armstrong | April 30, 2024
• Dow Jones Industrials Index »» Pendulum Swing to Downside
• NASDAQ Composite Index »» ReTesting Support
• NASDAQ 100 Index »» ReTesting Support
• S&P 500 Index »» ReTesting Supportr
• Russell 2000 Index »» New Pattern Forming
• US Dollar Index »» Knee Jerk Low
• CBOE VIX Index »» Temp High
• NY Gold Futures »» Pressing Higher
• NY Silver COMEX Futures »» Possible Sharp Rally
• NY Crude Oil Futures »» New Pattern Forming
DiscoverGold
The Market Greed/Fear Index stands at 60.07, which is now far from extreme greed territory, indicating a more neutral sentiment in the market
By: Isabelnet | April 29, 2024
• Sentiment
The Market Greed/Fear Index stands at 60.07, which is now far from extreme greed territory, indicating a more neutral sentiment in the market.

Read Full Story »»»
DiscoverGold
In election years, historical data shows that the S&P 500 tends to perform strongly during the months of June, July, and August, as investors gain confidence from the clarity provided by the election process
By: Isabelnet | April 29, 2024
• S&P 500
In election years, historical data shows that the S&P 500 tends to perform strongly during the months of June, July, and August, as investors gain confidence from the clarity provided by the election process.

Read Full Story »»»
DiscoverGold
$SPX - Latest Watching a Pot'l 'Diamond' Plot...
By: Sahara | April 29, 2024
• $SPX - Latest
Watching a Pot'l 'Diamond' Plot...

Read Full Story »»»
DiscoverGold
For Equities To Repeat Last Week’s Feat, They Will Need Help From Both FOMC And Tech Earnings This Week
By: Hedgopia | April 29, 2024
In the latter part of last week, tech delivered, helping the major US equity indices rally big. Two issues could make or mar this week. The FOMC meets, and two more tech behemoths report earnings.
The FOMC meets this week, and what comes out of it could prove to be crucial for risk assets.
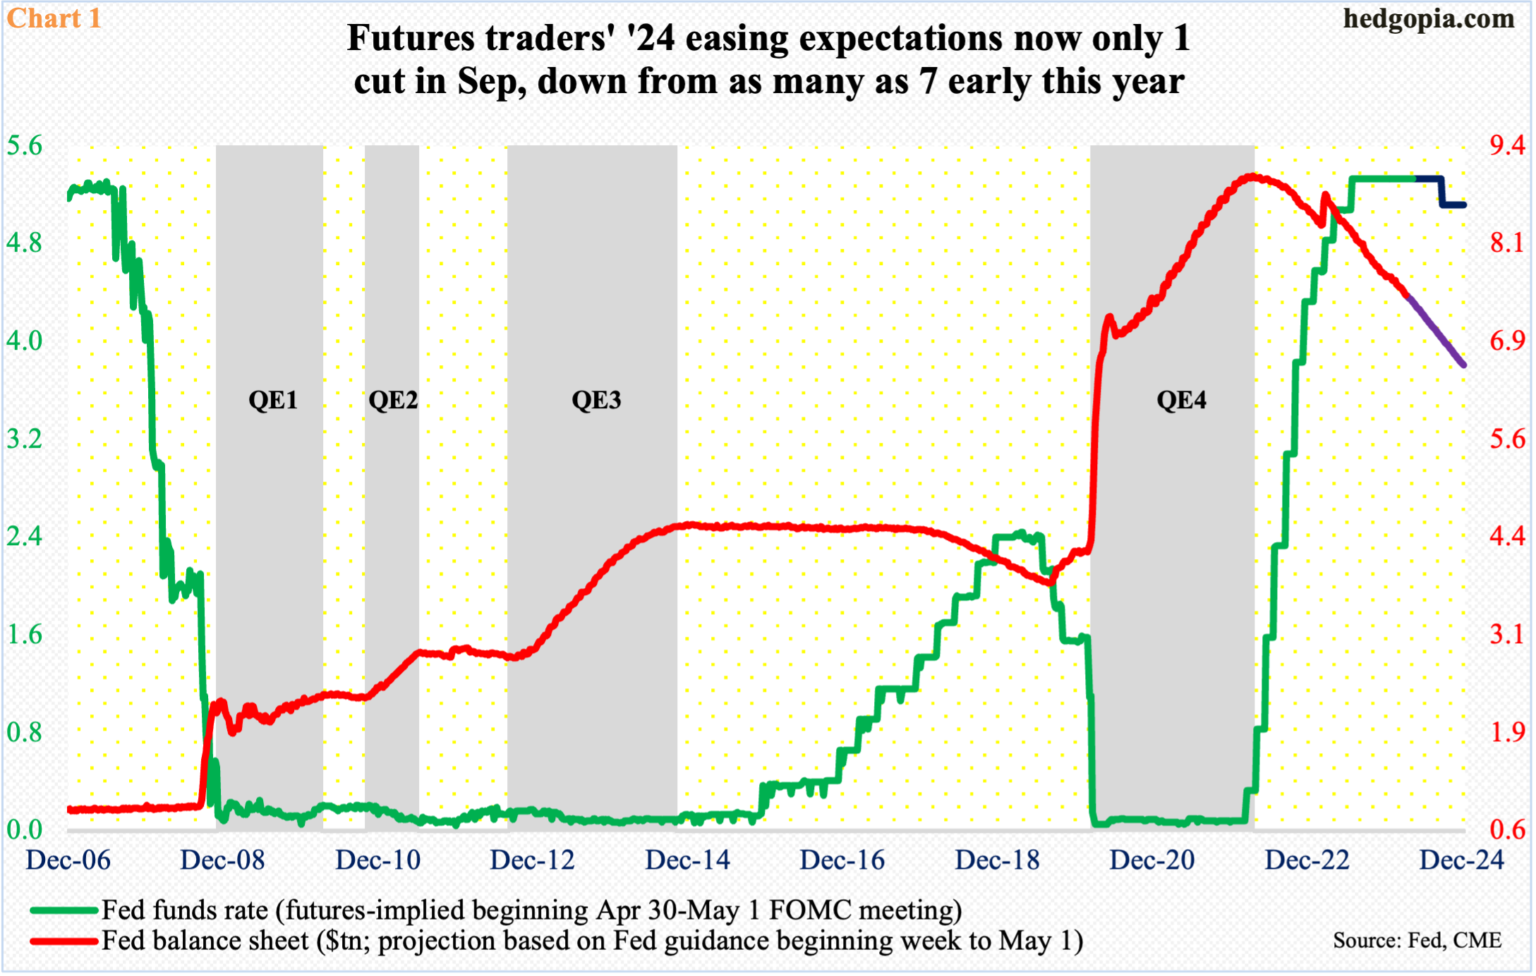
US stocks bottomed last October and took off post-December 13th FOMC meeting when Chair Jerome Powell made a dovish pivot. Soon, the futures market was consistently betting on as many as six 25-basis-point cuts this year – pricing in even seven at one point. This began to get modeled in analyst forecasts, and risk assets, including equities, shifted into higher gear.
Fast forward to now, futures traders now expect only one cut – in September (Chart 1). Earlier, the Federal Reserve tightened from a range of zero to 25 basis points in March 2022 to between 525 basis points and 550 basis points last July, even as it continues to shrink its still-inflated balance sheet.
Persistent strength in most economic data, including jobs, and sticky inflation has forced even the dovish FOMC members to change their tune and lean hawkish. There are some that are now vouching for no cut to maybe one cut. Until the March meeting, the dot plot expected three cuts this year.
It is possible Powell on Wednesday will lean hawkish outright, or at least not sound as dovish as in December or later. From risk assets’ perspective, the worse is if he openly espouses one cut, let alone talk about the possibility of a hike.
For tech investors, with tech-focused indices such as the Nasdaq 100 having rallied massively from last October’s low on optimism of loads of rate cuts, the interest-rate outlook matters. Thus the importance of this week’s FOMC meeting. Then, there is March-quarter earnings.
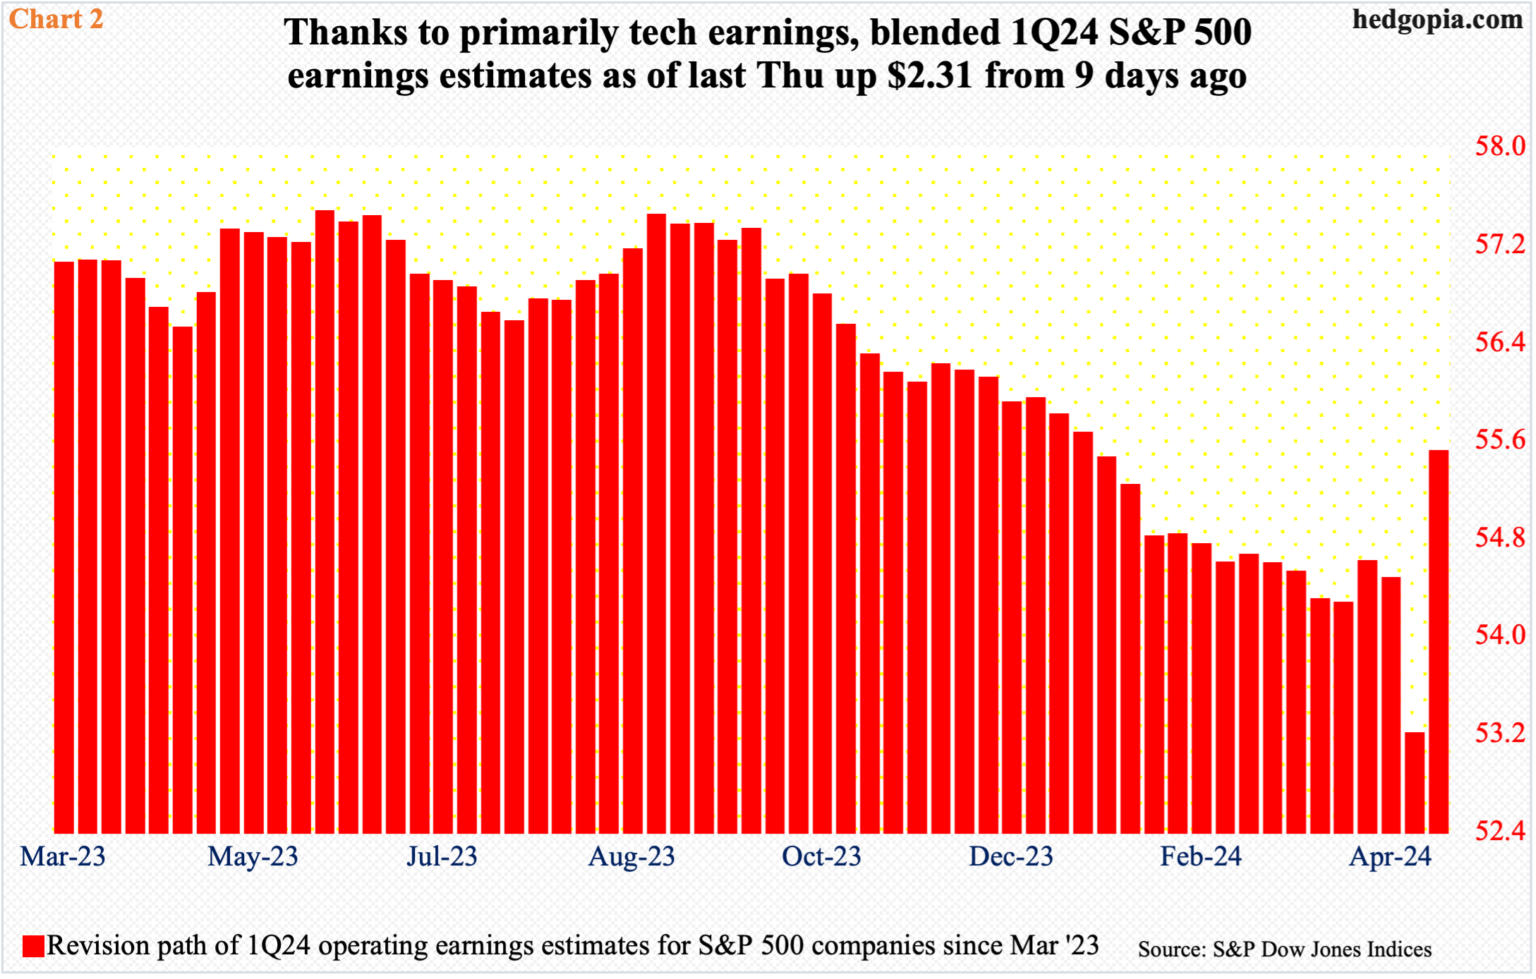
Last week, the big ones delivered. Facebook owner Meta (META) bettered the consensus estimates but its outlook came up short and was punished. Microsoft (MSFT) and Google owner Alphabet (GOOG), on the other hand, pleased investors with both their quarterly results and the outlook.
As a matter of fact, thanks primarily to tech earnings, the blended earnings estimates for S&P 500 companies as of last Thursday jumped $2.31 from nine days ago to $55.49, which is the highest since mid-January (Chart 2). This week, Amazon (AMZN) reports on Tuesday and Apple (AAPL) on Thursday. Going into this, AAPL’s estimates are flat to ever so slightly lower from a month ago, while AMZN’s is flat.
If both these events cooperate – FOMC and earnings – there is room for the Nasdaq 100 to continue to push higher.
Last week, the tech-heavy index jumped four percent to 17718. This followed four consecutive down weeks. Earlier, it posted a new intraday high of 18465 on March 21st but struggled to decisively break out of 18300s for seven weeks before sellers took control. By the 19th, the Nasdaq 100 ticked 16974, down 8.1 percent from the high.
Ahead, the 50-day, which is now slightly pointing lower, rests at 17939, with the index under the average for 10 sessions. At 18000 lies trendline resistance from last month’s high (Chart 3). Even in a scenario in which the index rallies, sellers probably will get active at this resistance.
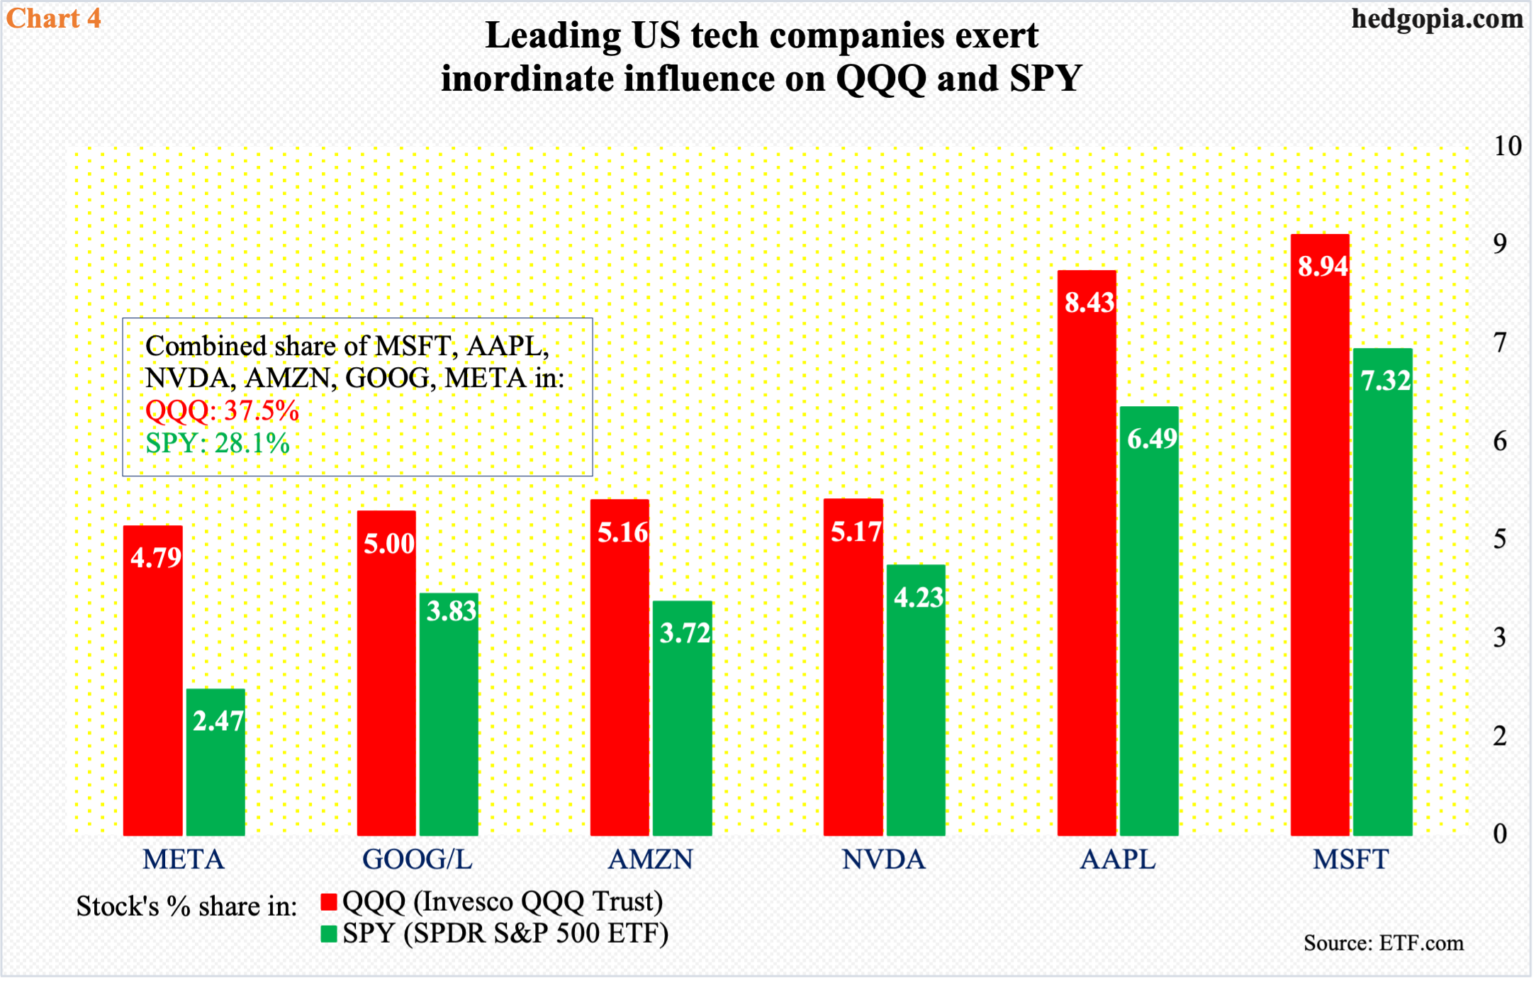
The S&P 500 is the other one to get impacted the most by this. Both these indices are market cap-weighted, and the bigger companies are obviously given bigger weights. The top six – MSFT, AAPL, Nvidia (NVDA), AMZN, GOOG and META – account for 37.5 percent of the Nasdaq 100 and 28.1 percent of the S&P 500 (Chart 4).
This is a massive amount of concentration in just a select a few. This cannot be considered healthy from many respects, but the fact remains that they are also the ones minting a lot of money with healthy margins.
If AAPL and AMZN deliver this week and the stocks rally, the share of the six will only expand.
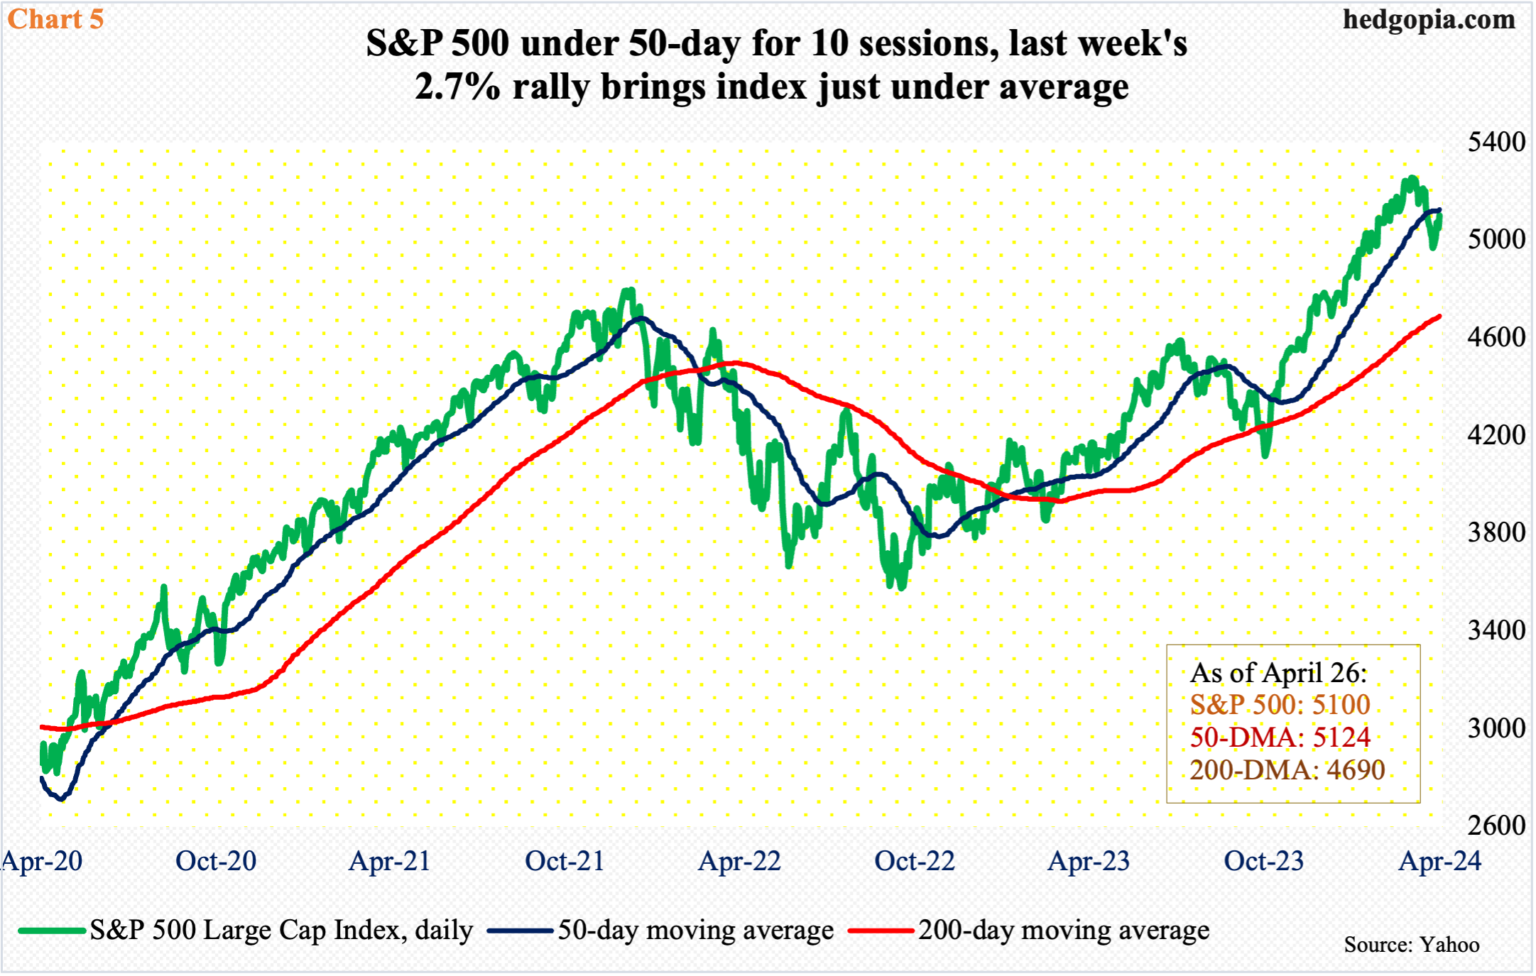
The two are reporting even as the S&P 500 finds itself just under the 50-day. Last week, the large cap index rallied 2.7 percent to 5100, with Friday’s intraday high of 5115 just about testing the average at 5124 (Chart 5).
The index has remained under the average for 10 sessions, having dropped for three weeks in a row before last week’s rally. Earlier, it ticked 5265 on March 28th and turned lower, failing to clear 5260s in three sessions over seven. Bulls put foot down at 4954 on the 19th – for a 5.9-percent drop from high to low.
Importantly, several daily indicators such as the RSI have now risen to the median. This is an opportunity for the bears to force the metric turn down, which will then lead to a reassertion of downward momentum. Bulls put their foot down last week, and they will have to do it again this week. For that, they will need help from both Powell and tech earnings.
Read Full Story »»»
DiscoverGold
|
Followers
|
178
|
Posters
|
|
|
Posts (Today)
|
6
|
Posts (Total)
|
67964
|
|
Created
|
06/10/03
|
Type
|
Free
|
| Moderators DiscoverGold | |||
:::::::::::: Welcome to S&P 500 & Nasdaq Analysis and Trends :::::::::::::
• The purpose of this board is to help others with Short & Long term S&P 500 & Nasdaq analysis and direction.
• This is strickly an educational board helping traders to learn market direction, swing and bottom trading.
• I ask that everyone respect opinions on the board whether you agree with them or not. We are all here to make money and avoid the
minimum loss we can.
Rules of the Board
Most of this board's WATCHERS are "lurkers" who appreciate info available without the need to sift through tons of "empty" posts.
1. Respect everyone opinions on trades.
2. No Pumping of Stocks.
3. No OTCBB or PINK STOCKS
*********************************************************************************************************
To help us evaluate our performance, please "BoardMark" the board if you find it useful.
To do so, just click on "Add to Favorites" Button at Right just above the Posts Dates.
 Presently, the Board has 178 Boardmarks, Thank you!
*Information Posted on this Board is not Meant to Suggest any Specific Action, But to Point Out the Technical Signs That Can Help Our Readers Make Their Own Specific Decisions. Your Due Deligence is a Must.
EXCHANGE TRADED FUNDS~ETFs COMPONENTS~RSI and I/V charts#msg-5495097 COMPONENTSFOR ^NDX / QQQQ ~ I/V charts #msg-9787995
Gold~ Silver~ HUI~ XAU~ US$~ €uro~ Crude #msg-29347660 (thanks,bob)
Cookies/Bandwidth/Security/Privacy #msg-9353921 PIEs/Cookies/Macromedia/Flash #msg-9412363 PerformanceTips for WinXP #msg-9854670
| Volume | |
| Day Range: | |
| Bid Price | |
| Ask Price | |
| Last Trade Time: |


