Is this a Dead-Cat Bounce or a Bounce with Legs? By: Arthur Hill | May 3, 2024
• A key short-term breadth indicator became oversold in mid April. • Stocks are bouncing after this oversold reading. • Breadth, however, has yet to show a serious expansion in participation.
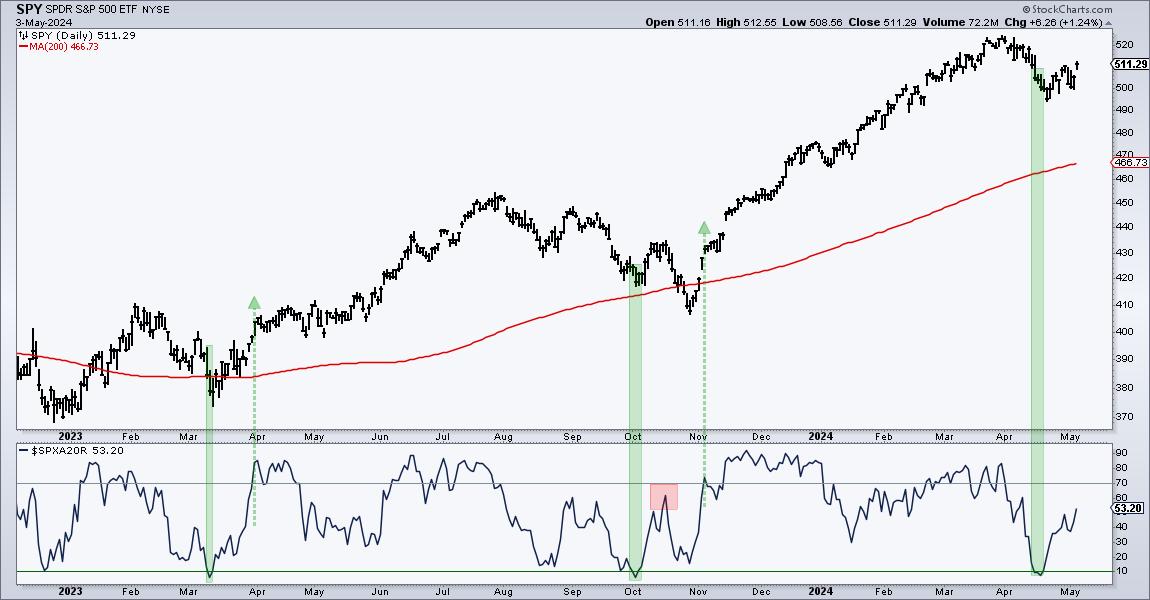
Stocks fell sharply into late April and then rebounded over the last two weeks. SPY fell 5.34% from March 28th to April 19th and then rebounded with a 3.26% gain the last two weeks. Does this bounce have legs? Chartists can separate serious bounces from dead-cat bounces using breadth. Today's example will use the S&P 500 and the percentage of S&P 500 stocks their 20 day SMAs.
There are two steps. First, the indicator needs to become oversold (setup). Second, we need to see a significant increase (breakout) in upside participation (signal). An oversold reading signals a significant decline and provides the setup for a bounce. Aggressive traders can trade the oversold condition. A subsequent move above the breakout level signals adequate participation to sustain the advance. Now comes the subjective part. We must choose our oversold and breakout levels. I am choosing 10 and 70 percent for SPX %Above 20-day SMA.
The green shading on the chart above shows when SPX %Above 20-day became oversold and the green arrow-lines mark the subsequent move above 70%. There were setup-signals in March-April and again in October-November. Both led to significant bounces. Notice the red shading where the indicator failed to clear 70% in mid October. This was a feeble bounce and SPY moved to a new low in late October. SPX %Above 20-day then surged above 70% in early November for a signal. Recently, the indicator became oversold here in mid April for a setup and moved back above 50% this week. An oversold bounce is indeed underway, but I need to see a move above 70% to show a participation breakout.
We are monitoring the rebound in the S&P 500 and Nasdaq 100 at TrendInvestorPro (ChartTrader). Our 10 indicator composite indicator became oversold in mid April, but we have yet to see the required breadth thrust to signal a strong increase in participation.
Information posted to this board is not meant to suggest any specific action, but to point out the technical signs that can help our readers make their own specific decisions. Caveat emptor! • DiscoverGold
Register for free to join our community of investors and share your ideas. You will also get access to streaming quotes, interactive charts, trades, portfolio, live options flow and more tools.


 News
News  Market Data
  Discover