 News
News  Market Data
  Discover
Support: 888-992-3836
Copyright © 2023 InvestorsHub Inc.


Register for free to join our community of investors and share your ideas. You will also get access to streaming quotes, interactive charts, trades, portfolio, live options flow and more tools.
Investor Sentiment Takes Hit, But Yet To Hit Meaningful Low To Signal Durable Bottom
By: Hedgopia | April 26, 2024
After a ferocious rally from last October’s low, US equities gave back some of the gains this month. This has impacted bullish sentiment, but not enough to make a durable bottom in stocks.
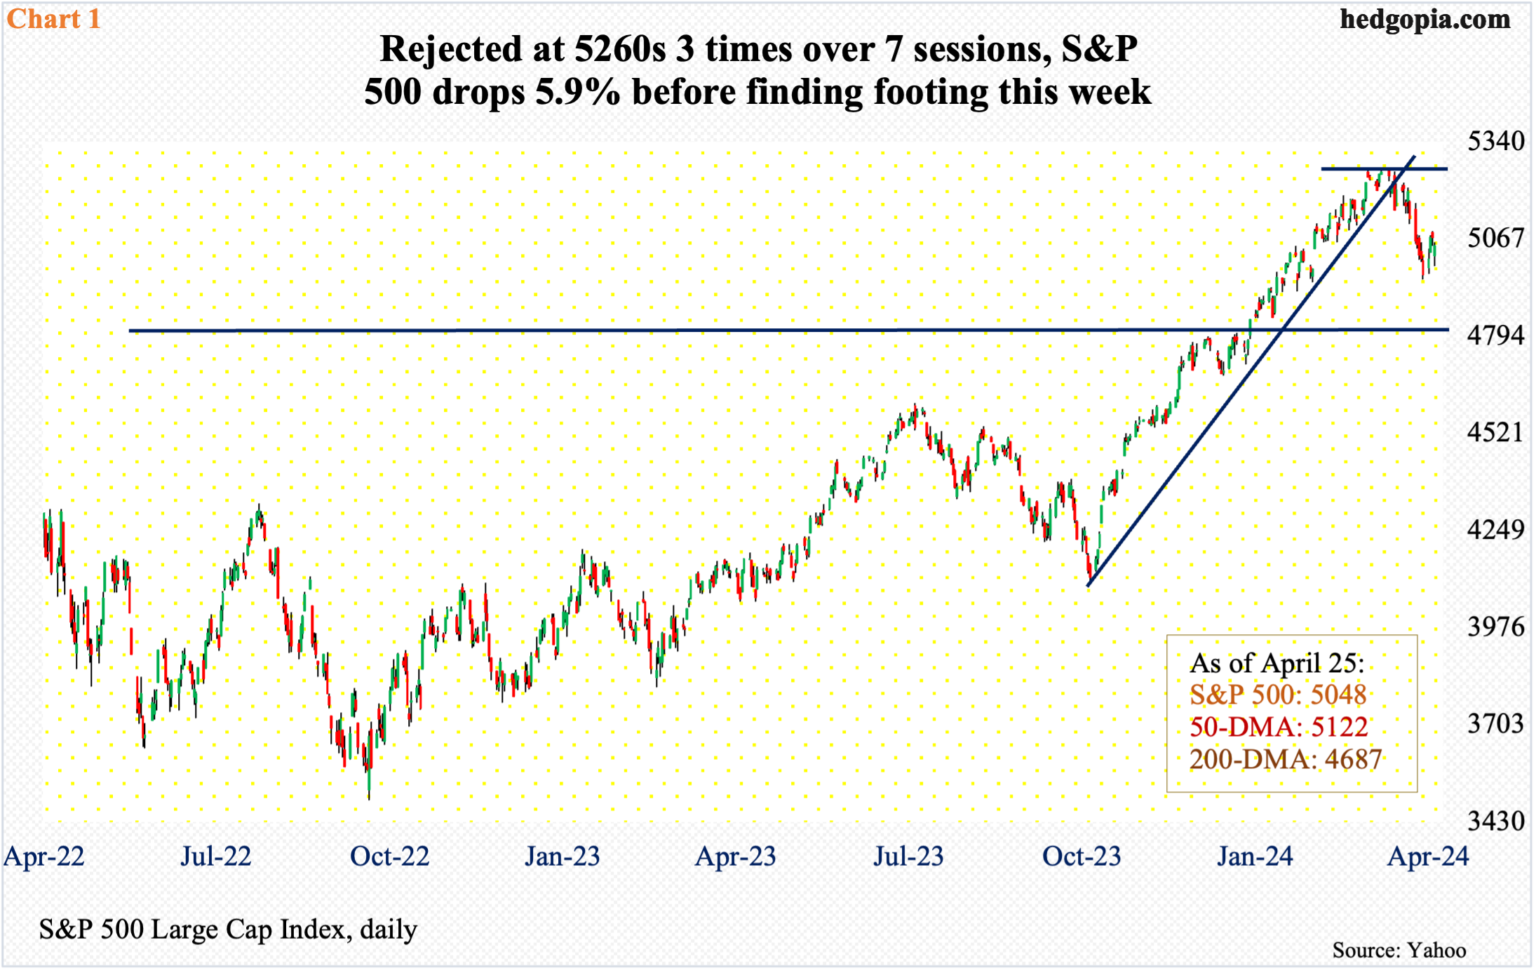
The S&P 500 shed 5.9 percent from its March 28th peak before finding a footing this week. Earlier, from the October 27th low of last year, the large cap index shot up 28.3 percent. Big picture, April’s giveback is nothing given the five-month scorching rally.
Between late-March and early-April, bulls began to face difficulty at 5260s, hitting the level three times over seven sessions, including the March 28th all-time high of 5265 (Chart 1). Bears took control right from the beginning this month. The index suffered three weekly declines before recovering. This week, with a session to go, the S&P 500 is up 1.6 percent.
The recent selloff has impacted bullish sentiment.
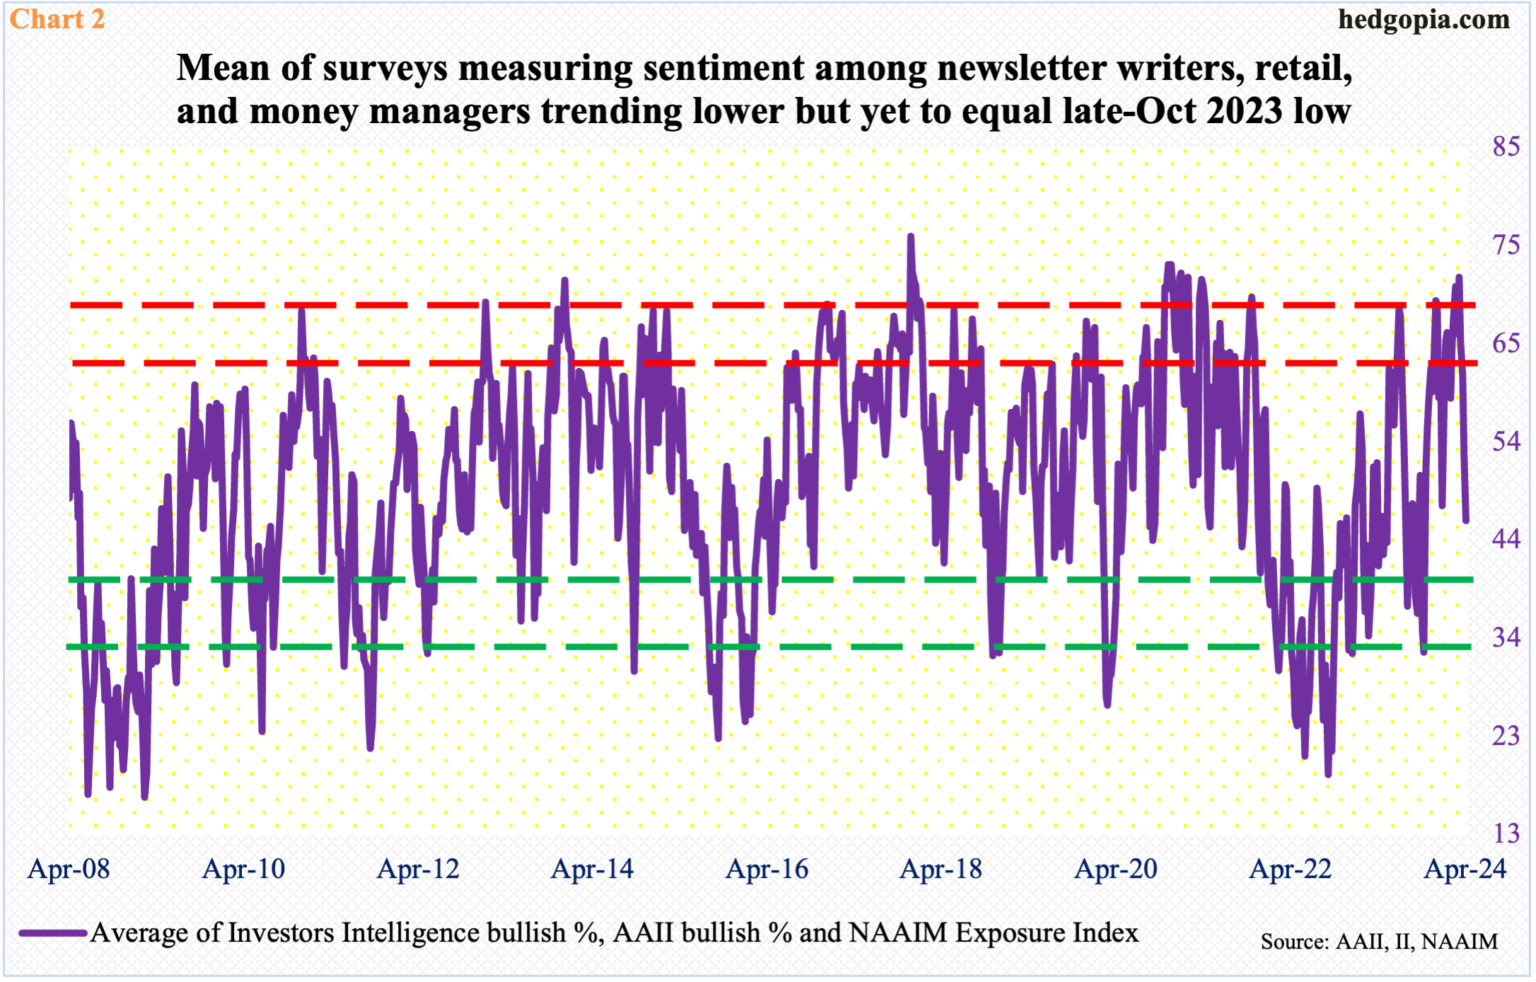
In the week to Tuesday, Investors Intelligence bulls tumbled 10.3 percentage points week-over-week to 46.2 percent. In the week to Wednesday, the NAAIM Exposure Index dropped 3.5 points w/w to 59.5, while American Association of Individual Investors bulls in the week to Thursday declined 6.2 percentage points w/w to 32.1 percent. The three surveys respectively measure sentiment among newsletter writers, money managers, and retail investors. This week’s readings represent a decent drop from the recent highs.
Investors Intelligence bulls hit 62.5 percent in the week to April 2nd. This was the highest reading since April 2021 and the fourth consecutive weekly reading of 60-plus. The NAAIM Exposure Index printed 103.9 in the week to March 27th; two weeks before that, it hit 104.8, which was the highest since November 2021. And AAII bulls hit 50 percent in the week to March 28th; three weeks prior, bulls reached 51.7 percent, which was an 11-week high.
Chart 2 combines the three surveys and takes out an average. A reading of 71.5 in the last week of March was the highest since January 2021. This week, the average dropped to 45.9, which is low but not low enough to even match last October’s low, when it dropped to 32.1, let alone the late-September 2022 trough of 19.3. Equities reached a major low in October 2022.
The bottom line is that investor sentiment has taken a hit but not enough to signal a durable bottom in equities.
Read Full Story »»»
 DiscoverGold
The 10 Top/Bottom S&P 500 Index percent net change performers
By: Thom Hartle | April 26, 2024
• Today (8:33 CST), the 10 top/bottom percent net change performers in the S&P 500 Index.

Read Full Story »»»
DiscoverGold
The 10 Top/Bottom NASDAQ 100 Index percent net change performers
By: Thom Hartle | April 26, 2024
• Today (8:33 CST), the 10 top/bottom percent net change performers in the NASDAQ 100 Index.

Read Full Story »»»
DiscoverGold
Bullish sentiment has experienced a significant reversal. Historically, elevated levels of optimism among retail investors and low volatility in financial markets have frequently indicated short-term market peaks
By: Isabelnet | April 26, 2024
• S&P 500
Bullish sentiment has experienced a significant reversal. Historically, elevated levels of optimism among retail investors and low volatility in financial markets have frequently indicated short-term market peaks.

Read Full Story »»»
DiscoverGold
S&P 500: The degree of activity in leveraged long vs short US equity ETFs has experienced a substantial decline as sentiment shifts
By: Isabelnet | April 26, 2024
• S&P 500
The degree of activity in leveraged long vs short US equity ETFs has experienced a substantial decline as sentiment shifts.

Read Full Story »»»
DiscoverGold
With a median short interest level of 1.8%, which remains relatively low, market participants are positive or cautiously optimistic about the future performance of the S&P 500
By: Isabelnet | April 25, 2024
• S&P 500
With a median short interest level of 1.8%, which remains relatively low, market participants are positive or cautiously optimistic about the future performance of the S&P 500.

Read Full Story »»»
DiscoverGold
S&P 500: Active investment managers frequently face criticism for their consistent pattern of selling equities at market bottoms and buying them at market tops
By: Isabelnet | April 25, 2024
• S&P 500
Active investment managers frequently face criticism for their consistent pattern of selling equities at market bottoms and buying them at market tops.

Read Full Story »»»
DiscoverGold
The Reality Hits the Markets into May 7th
By: Marty Armstrong | April 25, 2024
The Dow plunged 600 points in the opening, confirming that the bounce was nothing to get all excited about. Yes, the gist of the decline was that the US dropped Thursday morning after the latest GDP report showed that US GDP slowed to just 1.6% in the first quarter of the year, sharply lower than expected but virtually all economic forecasts. In contrast, GDP in the second half of 2023 grew by 4.9% and 3.4% in last year's third and fourth quarters. Economists never foresee a change in direction.
The Dow fell 1.8% and is headed toward its largest drop of the year, while the S&P 500 was down 1.5%, and the Nasdaq Composite plunged by 1.9%. The story is that investors now expect a longer wait for the first rate cut from the Federal Reserve.
This GDP report was the worst of both worlds insofar as economic growth is slowing as we prepare for the turn on May 7th. Yet, as we have been forecasting, inflationary pressures are persisting, confirming that we are heading into Stagflation as the government raises taxes, reducing GDP but raising the cost of production. Insane places like California pushing the minimum wage to $20 as if this will maintain economic growth and not reduce jobs is just an example of the gross incompetence of those running governments. We can see in this report that inflation accelerated in the first three months of this year...
DiscoverGold
Money managers Reduced their exposure to the US Equity markets since last week...
DiscoverGold
NAAIM Exposure Index
April 25, 2024 
The NAAIM Number
59.48
Last Quarter Average
87.84
»»» Read More…
The AAII Investor Sentiment
By: AAII | April 25, 2024
Bullish 32.1%
Neutral 33.9%
Bearish 33.9%
• Historical 1-Year High
Bullish: 52.9%
Neutral: 37.4%
Bearish: 50.3%
Read Full Story »»»
DiscoverGold
May Almanac: Historically Poor in Election Years
By: Almanac Trader | April 24, 2024
May has been a tricky month over the years, a well-deserved reputation following the May 6, 2010 “flash crash”. It used to be part of what we once called the “May/June disaster area.” From 1965 to 1984 the S&P 500 was down during May fifteen out of twenty times. Then from 1985 through 1997 May was the best month, gaining ground every single year (13 straight gains) on the S&P, up 3.3% on average with the DJIA falling once and NASDAQ suffering two losses.
In the years since 1997, May’s performance has remained erratic; DJIA up fourteen times in the past twenty-six years (four of the years had gains exceeding 4%). NASDAQ suffered five May losses in a row from 1998-2001, down –11.9% in 2000, followed by fourteen sizable gains of 2.5% or better and seven losses, the worst of which was 8.3% in 2010 followed by another substantial loss of 7.9% in 2019.

Since 1950, election-year Mays rank rather poorly, #9 DJIA and S&P 500, #8 NASDAQ and Russell 2000 and #7 Russell 1000. Average performance in election years has also been weak ranging from a 0.4% DJIA loss to a 0.6% gain by Russell 2000. Aside from DJIA, the frequency of gains in election year Mays is bullish, but down Mays have tended to be big losers. In 2012, DJIA, S&P 500, NASDAQ, Russell 1000 and 2000 all declined more than 6%.
Read Full Story »»»
DiscoverGold
$SPX Bulls are back
By: Cheddar Flow | April 24, 2024
• $SPX Bulls are back.

Read Full Story »»»
DiscoverGold
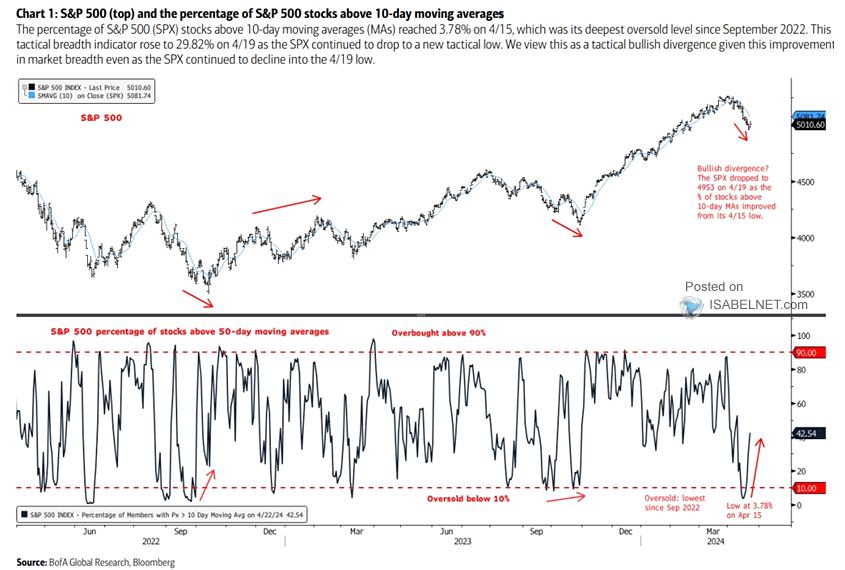
The rise in the percentage of S&P 500 stocks above their 10-day moving averages can be interpreted as a tactical bullish divergence, providing valuable insights into market strength and the potential for a reversal
By: Isabelnet | April 24, 2024
• S&P 500
The rise in the percentage of S&P 500 stocks above their 10-day moving averages can be interpreted as a tactical bullish divergence, providing valuable insights into market strength and the potential for a reversal.
Read Full Story »»»
DiscoverGold
The 10 Top/Bottom S&P 500 Index percent net change performers
By: Thom Hartle | April 24, 2024
• Today (8:34 CST), the 10 top/bottom percent net change performers in the S&P 500 Index.

Read Full Story »»»
DiscoverGold
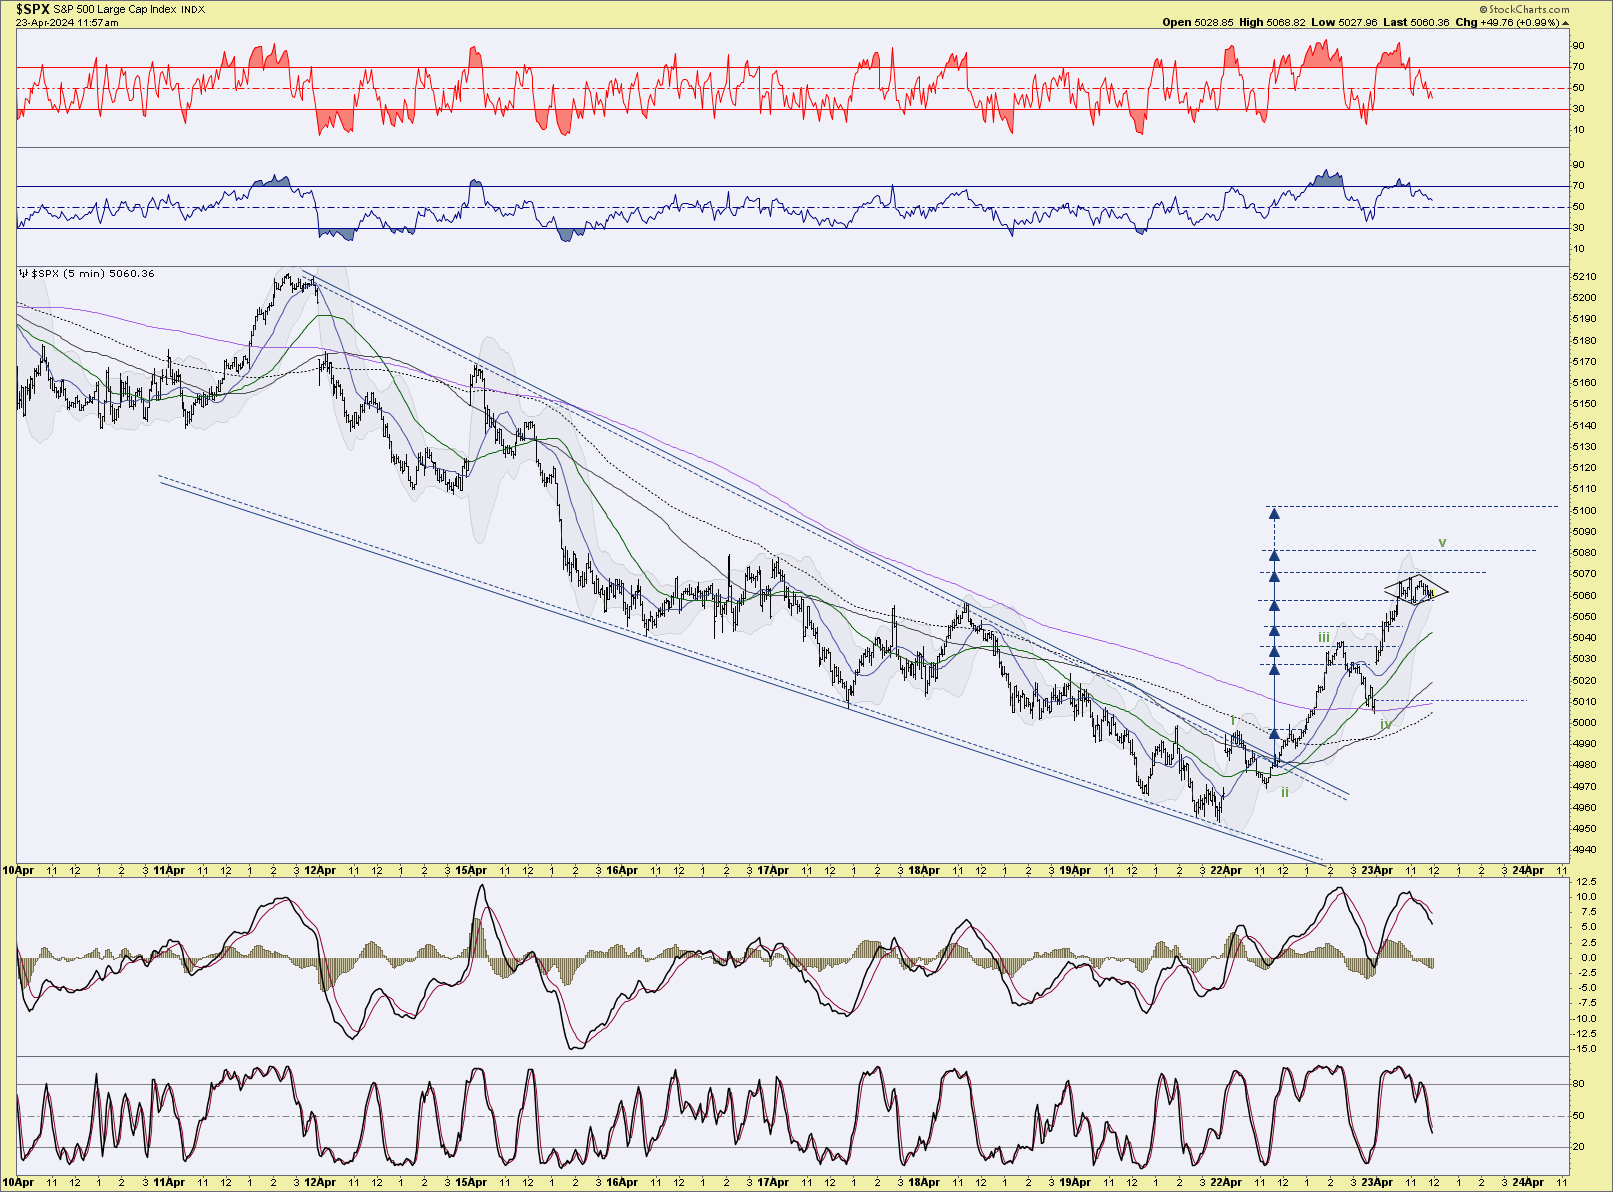
$SPX - Zooming in we can see a clear impulse wave. yet it could be an (a)-(b)-(c) with i-ii being (a) & the 1st target from the Bull 'Wedge' being i of (c)?
By: Sahara | April 23, 2024
• ... $SPX - Zooming in we can see a clear impulse wave. yet it could be an (a)-(b)-(c) with i-ii being (a) & the 1st target from the Bull 'Wedge' being i of (c)?
We should soon know when this move is complete from the ensuing structure whether it being impulsive or corrective...
Read Full Story »»»
DiscoverGold
Markets Monthly Pattern »» Watchlist - Top 10
By: Marty Armstrong | April 23, 2024
• Dow Jones Industrials Index »» Pendulum Swing to Downside
• NASDAQ Composite Index »» Entering CRASH MODE
• NASDAQ 100 Index »» Losing Momentum
• S&P 500 Index »» Entering CRASH MODE
• Russell 2000 Index »» Knee Jerk Low
• US Dollar Index »» Pressing Higher
• CBOE VIX Index »» Temp Low In Place Reaction Possible
• NY Gold Futures »» New Pattern Forming
• NY Silver COMEX Futures »» Possible Sharp Rally
• NY Crude Oil Futures »» New Pattern Forming
DiscoverGold
S&P 500: With a reading of 55.41, the US stock market is no more overbought, suggesting a potential shift in investor sentiment and a possible opportunity for market participants to reassess their positions and strategies
By: Isabelnet | April 23, 2024
• S&P 500
With a reading of 55.41, the US stock market is no more overbought, suggesting a potential shift in investor sentiment and a possible opportunity for market participants to reassess their positions and strategies.

Read Full Story »»»
DiscoverGold
The 10 Top/Bottom NASDAQ 100 Index percent net change performers
By: Thom Hartle | April 23, 2024
• Today (8:33 CST), the 10 top/bottom percent net change performers in the NASDAQ 100 Index.

Read Full Story »»»
DiscoverGold
Why you shouldn't be too quick to dump your stocks just yet
By: Mark Hulbert | April 23, 2024
Sectors that typically rally at the end of bull markets are lagging
After volatile trading sessions last week, it's worth noting that the U.S. stock market's major trend is still up. The market's sector relative-strength rankings are confirming this, despite the market's gyrations,
I base this bullish assessment on an analysis of which stock-market sectors typically perform the best as bull markets come to an end. Recent market action doesn't fit the historical pattern: Many of the sectors that typically rally at the end of bull markets are lagging, while many of those that usually do the worst have instead been standout performers.
This divergence between recent sector relative-strength and the historical pattern is illustrated in the chart below. While this divergence doesn't guarantee that the bull market is alive and well, it does suggest that investors should not be too quick to give up on it. The S&P 500's SPX rally to start this week suggests that many investors agree, despite the six consecutive session declines through the end of last week.
Twice in the past year I've used the sector relative-strength rankings to grade the market. The first was in early April 2023, when the new bull market was being met with widespread skepticism; I argued that the rankings pointed to an emerging new bull market rather than a correction in a bear market. The S&P 500 on a total-return basis is more than 22% higher since then. The second was in mid-August 2023, when the S&P 500 was - like now - 5% below its recent high; I argued that the weakness did not represent the end of the bull market. The S&P 500 on a total return basis is 15% higher now.
To appreciate how big a divergence exists between the current relative-strength ranking and the historical pattern for bull market endings, consider the rank correlation coefficient between the two. This statistic ranges from a theoretical maximum of 1.0 (when the two rankings are identical) to minus-1.0 (when the rankings are perfectly inverse). This statistic currently stands at minus-0.70, one of the lowest readings in recent decades. Last August, the correlation coefficient stood at minus-0.01, and in April 2023 at plus-0.31. Clearly, the sector relative-strength readings have been moving increasingly further away from the bull-market-ending pattern.
The bottom line? Reports of the bull market's death may be premature.
Read Full Story »»»
DiscoverGold
With Equities In 3-4 Weeks Of Selling Pressure And Tech Ready To Report, Bulls Have Opportunity To Put Foot Down For Reprieve N/T
By: Hedgopia | April 22, 2024
Unable to push through resistance, major US equity indices took a drubbing in recent weeks. Mid- to long-term, more downward pressure is probable. Near-term, it is looking like a toss-up between bulls and bears.
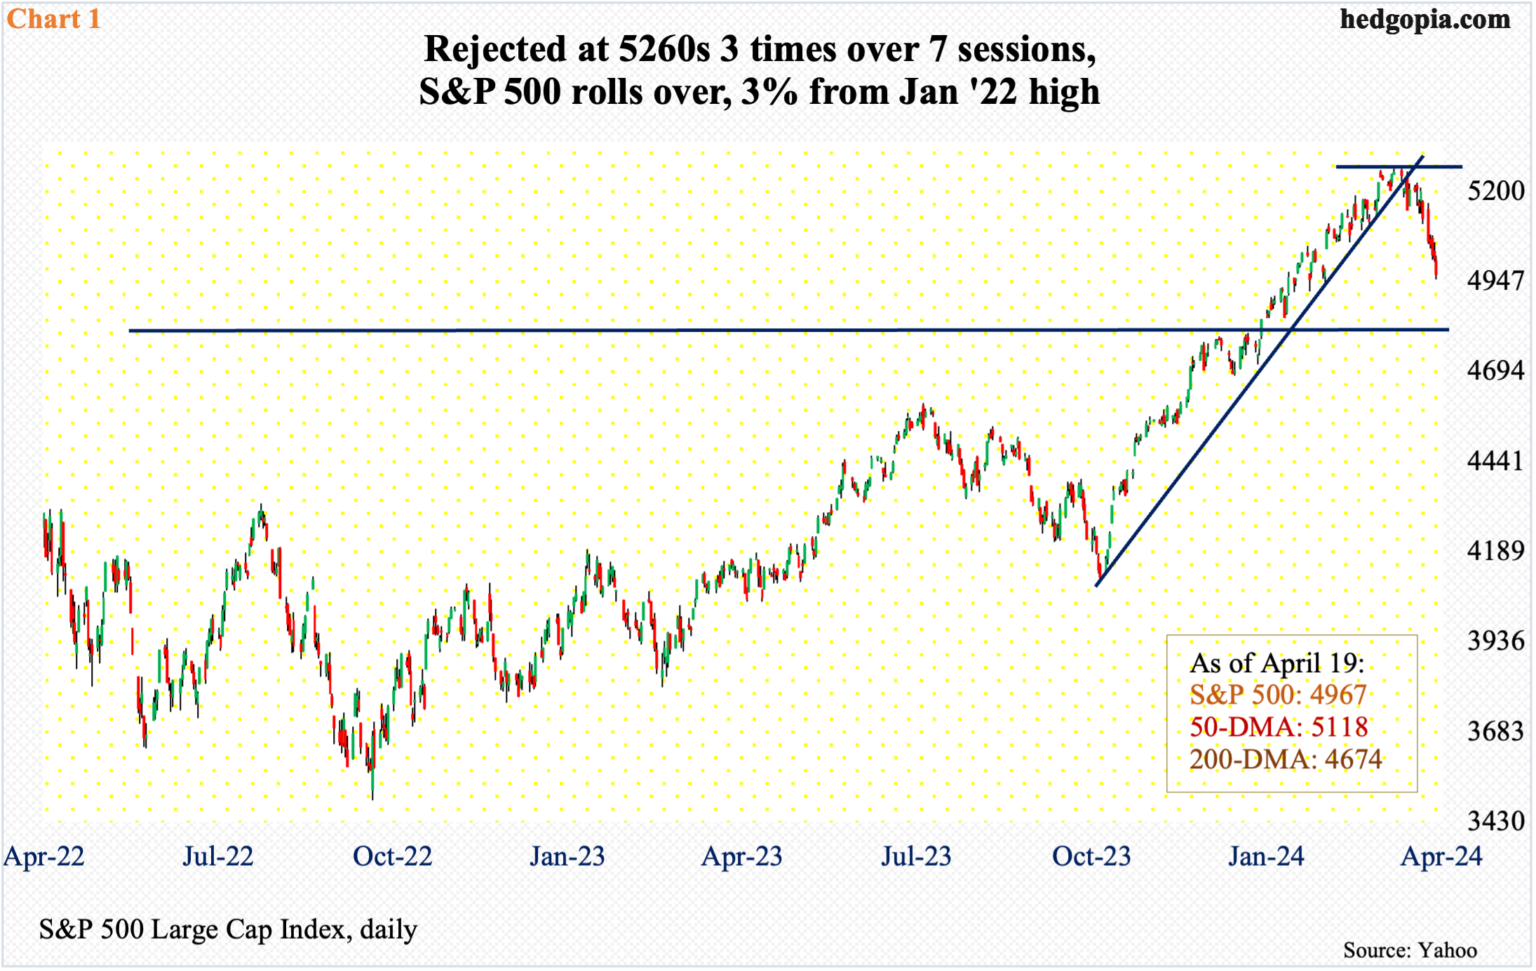
The S&P 500 last week suffered its third consecutive down week. From the March 28th peak of 5265, it is now down 5.7 percent, which represents a minor giveback of the gains the bulls have enjoyed since last October. From that low through last month’s high, the large cap index surged north of 28 percent.
The index had difficulty taking out 5260s, which stopped the bulls in three sessions over seven sessions in late March-early April. This was then followed by a breach of a rising trend line from last October’s low (Chart 1). Last week, the 50-day (5118) was compromised, with the index ending down 3.1 percent to 4967.
The daily is beginning to look oversold. The weekly, however, is far from done unwinding the overbought condition it is in. In the event the index continues lower, an important test lies at 4810s. In January 2022, the S&P 500 ticked 4819 – a new high back then – and headed lower, subsequently bottoming at 3492 in October that year. The bulls had to wait until this January before that high was surpassed. A retest is just a matter of time. If the weekly wins out, it will happen sooner than later.
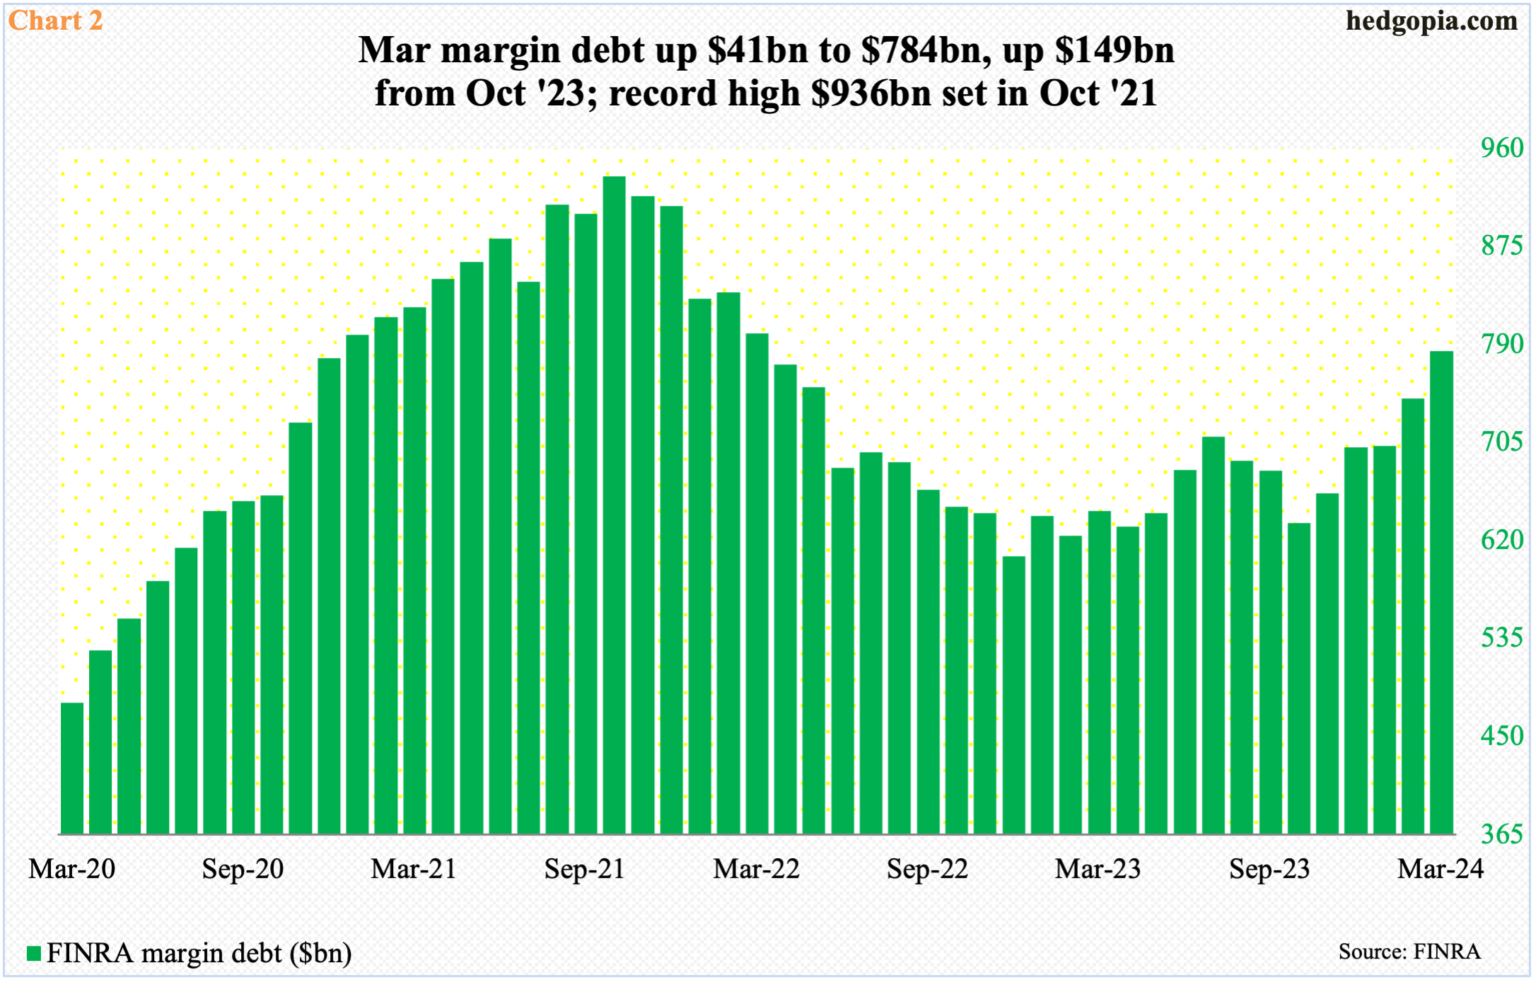
With seven sessions remaining, the S&P 500 is down 5.5 percent month-to-date. If this sticks, this will have come after five up months post-October low. Margin debt played a big role in that.
Last October, FINRA margin debt bottomed at $635 billion, down from $936 billion two years before that (Chart 2). After that peak, margin debt hit $607 billion in December before turning up. But it took time for equity bulls to get comfortable taking on leverage. From last October’s low, it has gone up $149 billion to last month’s $784 billion.
In February and March, margin debt grew $41 billion each; the S&P 500 rallied 5.2 percent and 3.1 percent respectively in those months. How margin debt behaves this month, therefore, will be crucial. Particularly since last October, leverage has paid off. If April’s downward pressure in the S&P 500 leads these risk-takers to lock in gains, then it is unlikely they will come back with vigor right away.
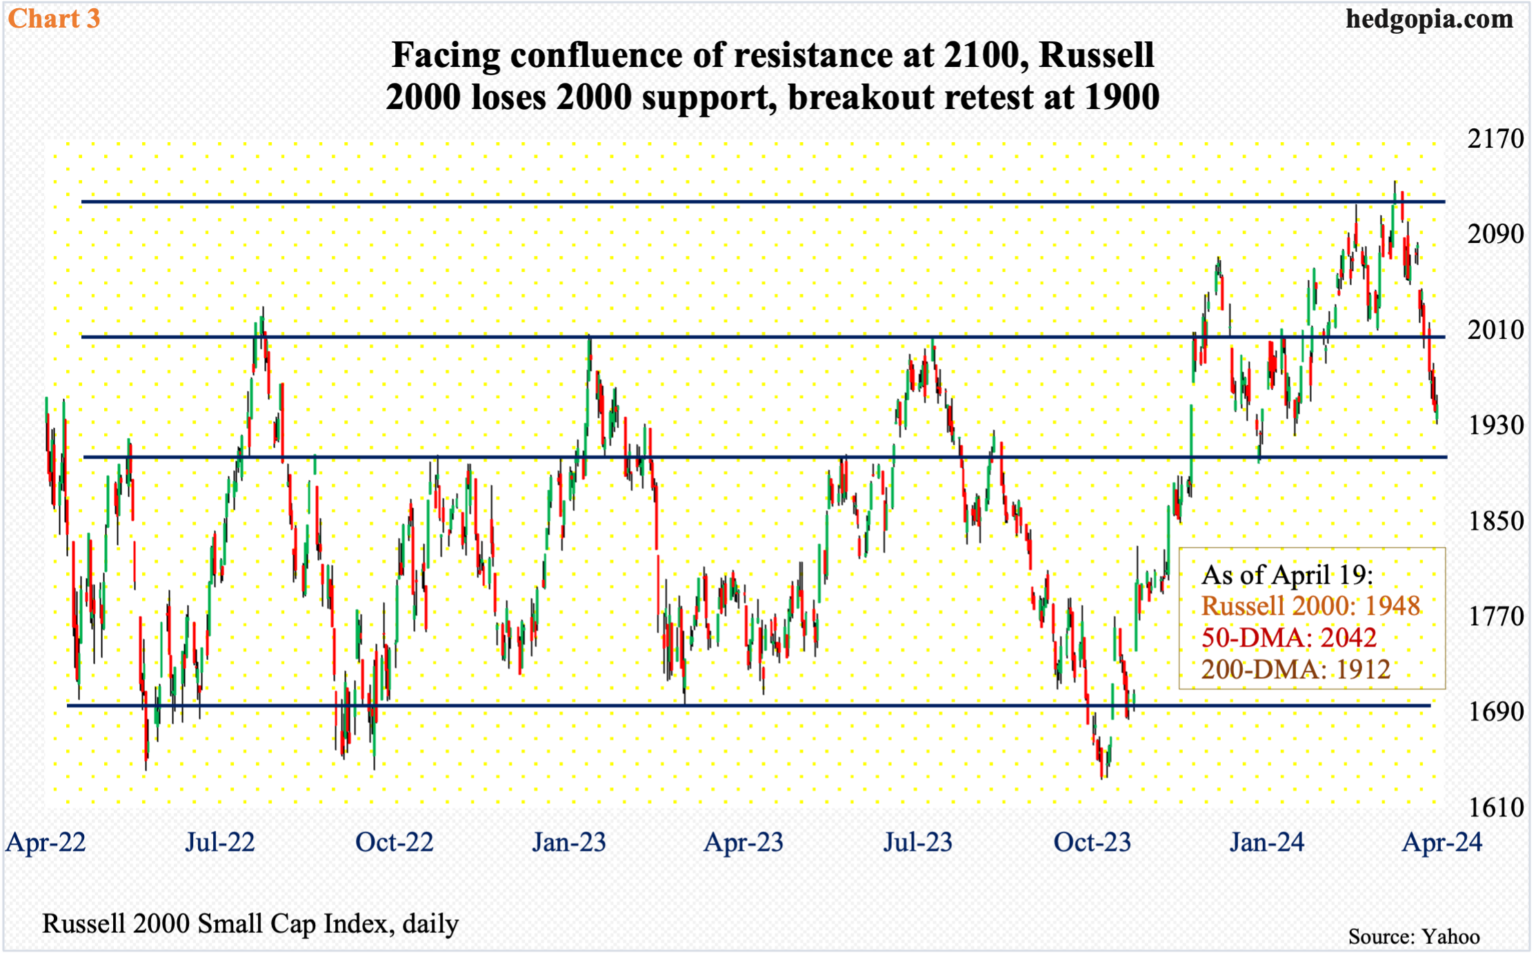
Risk-on is particularly not evident in the Russell 2000, which traditionally is treated as one of the ways to measure investor willingness to take on risk. From this standpoint, risk-on is missing, despite what margin debt is telling us of late.
Unlike its large-cap cousins, the Russell 2000 remains under its prior peak of 2459 reached in November 2021. After that peak, it subsequently bottomed at 1641 in the following June, followed by a successful test of that low in October as the small cap index touched 1642. Those lows were once again tested last October as the index ticked 1634 before reversing higher.
A rally off those lows ended at 2135 on March 28th – still more than 300 points below the November 2021 peak. There was tough resistance at 2100, where horizontal resistance goes back to January 2021. A 61.8-percent Fibonacci retracement of the November 2021-October 2023 drop comes to 2144. The level also represents a measured-move target of a range breakout that took place on December 13th (last year); prior to that, the index played ping pong between 1700 and 1900 going back to January 2022 (Chart 3).
Last week, unable to reclaim 2100, small-cap bulls went on to lose 2000, with the index closing at 1948 with Friday’s intraday low of 1932. If the weekly wins out, breakout retest at 1900 is the path of least resistance; else, bulls may try to once again try their luck at 2000.
Conditions for a rally near term are ripe. It is just that the bulls need to be able to take advantage of the situation.
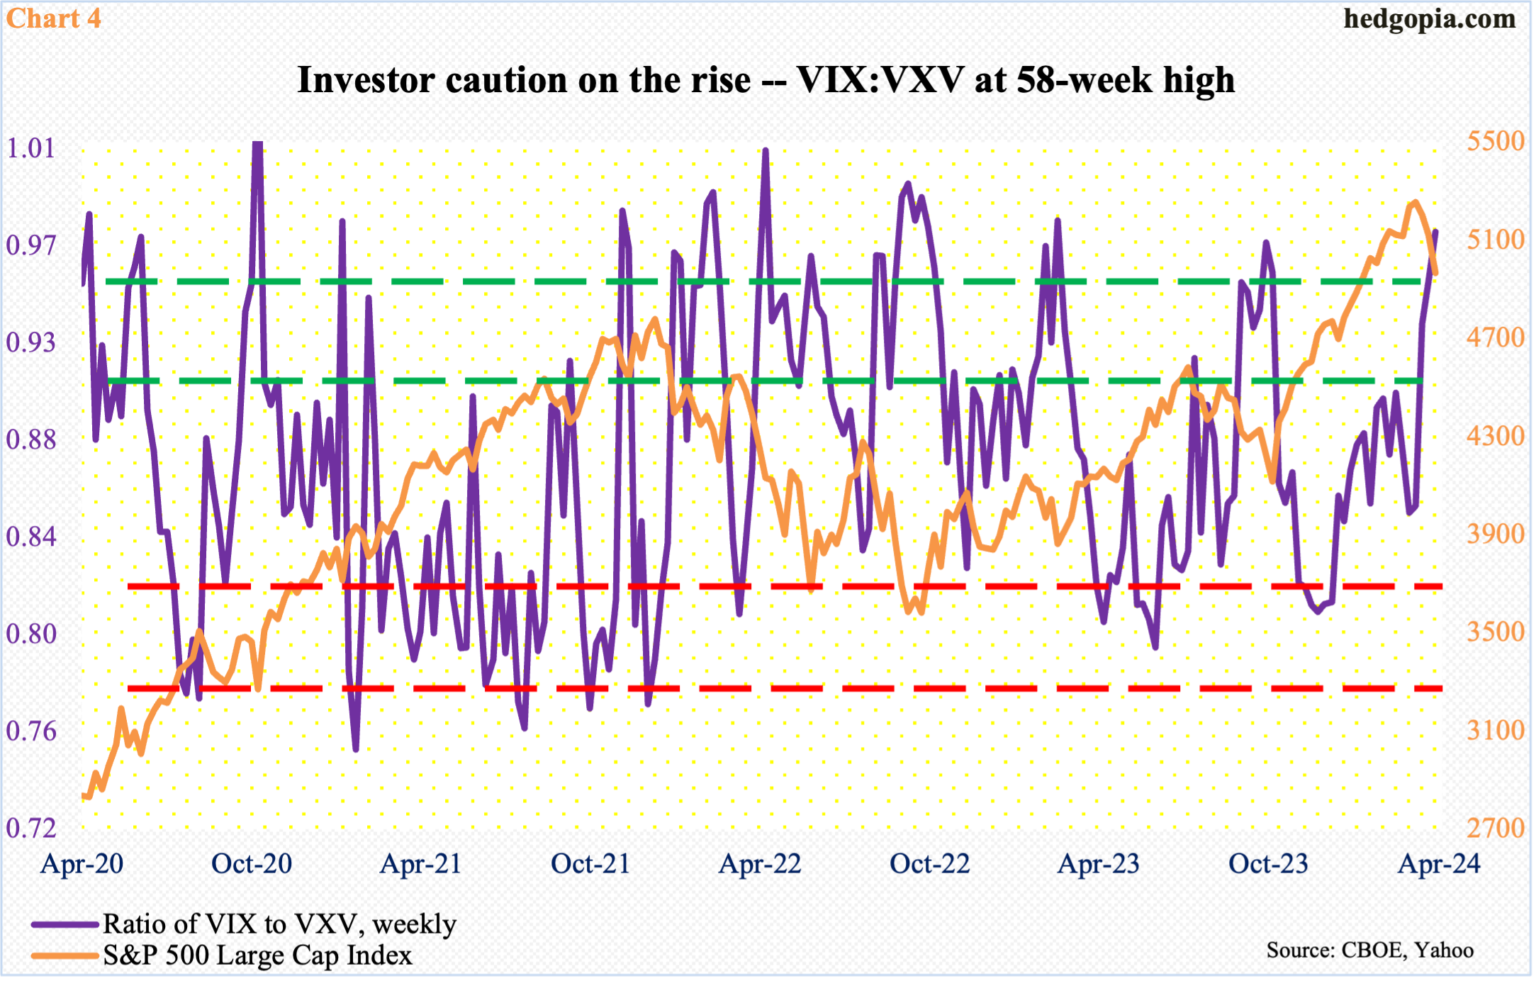
Chart 4 tallies a ratio of VIX to VXV and it has risen enough to begin unwinding the overbought condition.
VIX measures the market’s expectation of 30-day volatility on the S&P 500; VXV does the same, except it goes out to three months. When the investing climate is risk-off, as has been the case in recent weeks, demand for VIX-derived securities is higher than, let us say, VXV. The opposite is true when investor sentiment perks up.
Last week, the ratio of VIX to VXV closed at 0.97 – a 58-week high. The ratio is elevated enough it can reverse lower anytime, in which case VIX drops more than VXV, thus providing a tailwind to the S&P 500.
That said, plenty a time in the past, the ratio has gone on to rally toward unity and higher. Just because it is in the 0.90s does not guarantee a reversal.
There is a similar message coming out of the futures market.
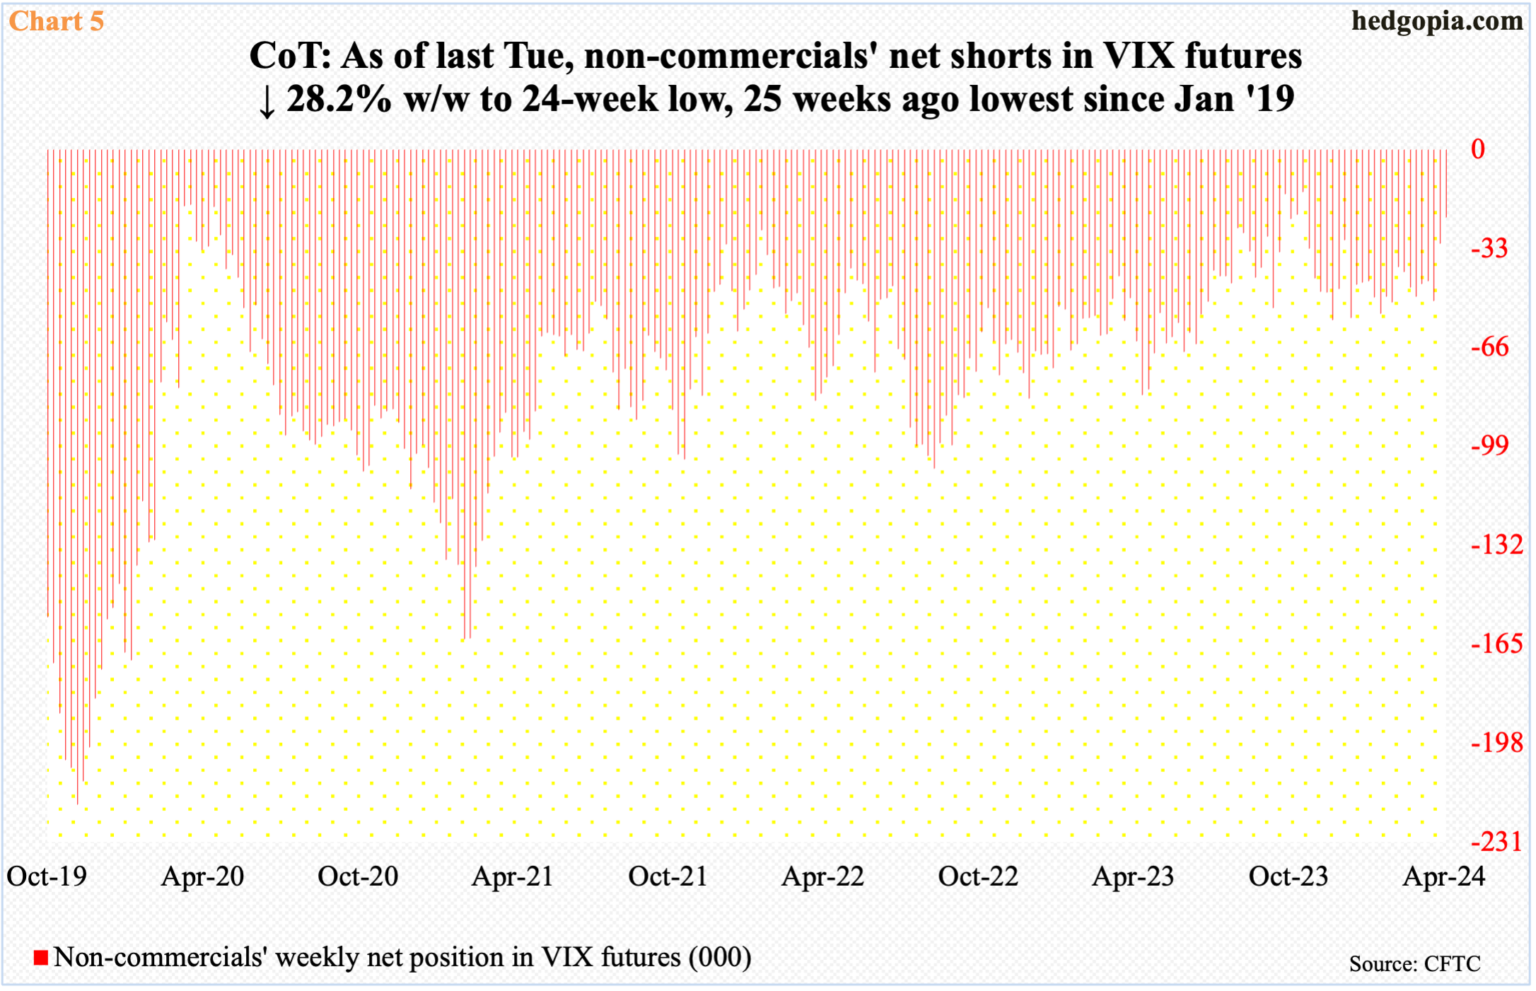
As of last Tuesday, non-commercials cut net shorts in VIX futures to 22,474 contracts – a 24-week low. Just this month alone, they cut their holdings by more than half.
Historically, the volatility index has tended to peak once these traders either go net long or get close to doing that. The last time they were net long was the latter months of 2018 and the first week of 2019. There have been three important lows in the S&P 500 since then – March 2000, October 2022 and October 2023; in each of these instances, equities bottomed with non-commercials still net short VIX futures – respectively 18,377, 52,823 and 13,979.
Thus, the red bars in Chart 5 do not necessarily have to go green before VIX peaks.
In the meantime, the volatility index rallied nicely the last couple of weeks but also reversed slightly with a weekly candle with a long upper wick. Last week, VIX rallied as high as 21.36 intraday Friday but only to end the session at 18.71; in contrast, the S&P 500 fell 0.9 percent in that session, closing near the session low.
If this is an indication of things to come in the sessions ahead, then VIX, after three up weeks in a row, could take a break. Once again, for this to occur, the daily needs to muscle through the weekly.
In the end, it all boils down to how tech fares this week. Several leading outfits report this week and next. Tesla (TSLA) reports on Tuesday, Facebook owner Meta (META) on Wednesday and Microsoft (MSFT) and Google owner Alphabet (GOOG) on Thursday. Apple (AAPL) and Amazon (AMZN) report the week after.
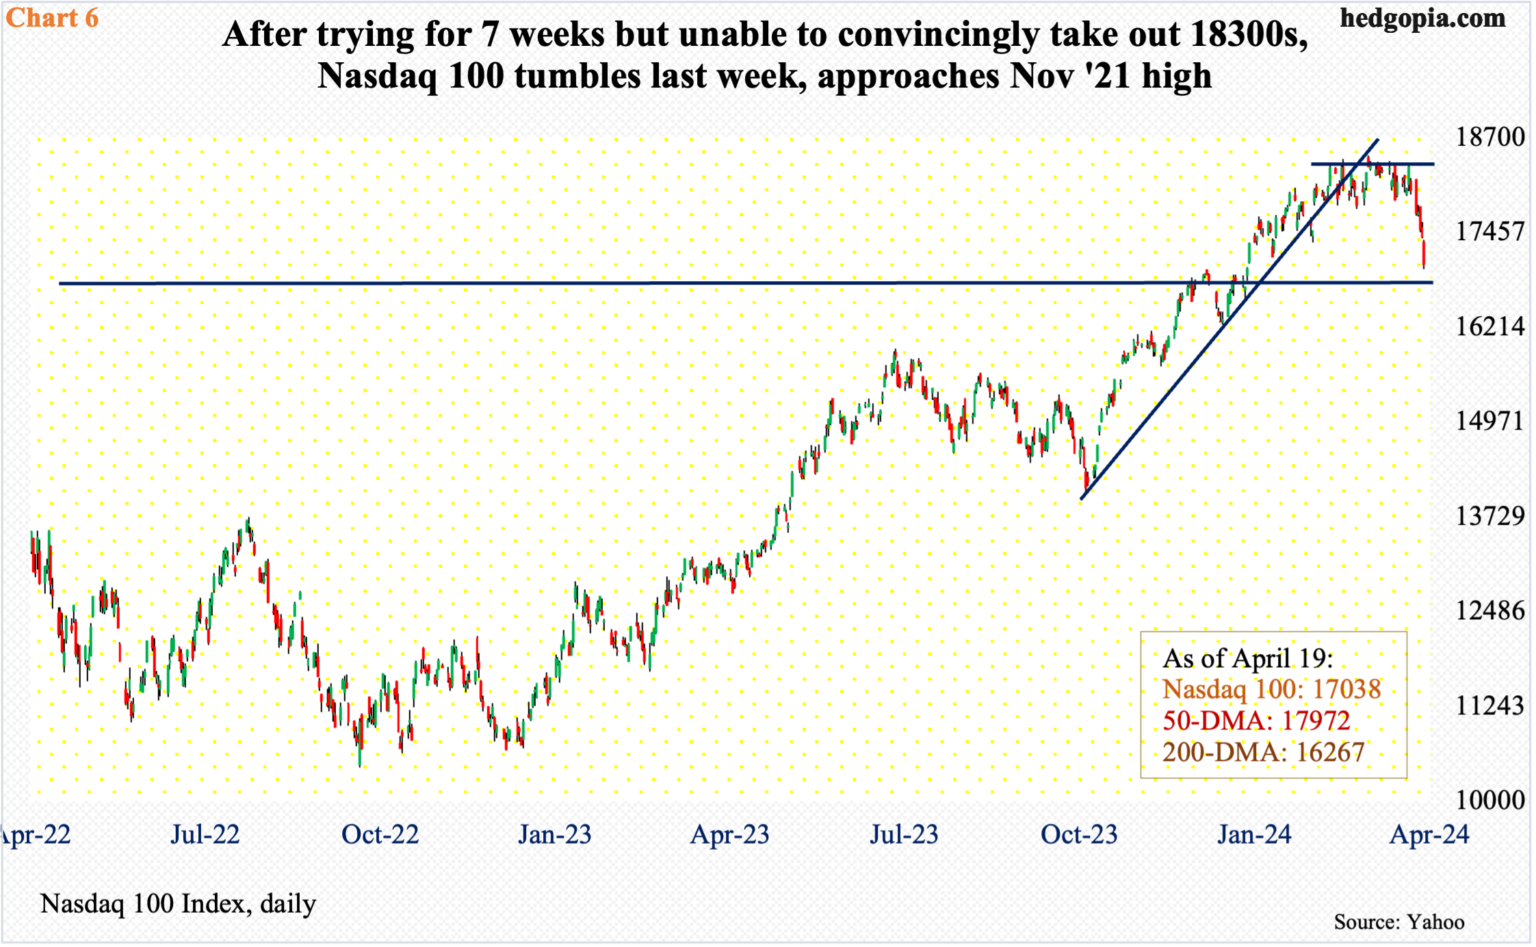
Leading up to this, tech acts weak. The Nasdaq 100 is now down four weeks in a row, with last week’s 5.4-percent tumble most pronounced. On March 21st, the tech-heavy index reached a fresh high of 18465 but faced difficulty at 18300s before and after that. In fact, the rather sideways action lasted seven weeks before the rug-pull happened last week.
The index (17038) is now approaching the November 2021 high of 16765. It will be an important breakout retest. The 50-day has been compromised, as has been trendline support from last October (Chart 6).
In the event the results from the above companies are received well, tech bulls need to recapture 17300s. A lack thereof exposes the index to a drop toward the 200-day (16267). And this will reverberate through the rest of the market – the cap-weighted ones in particular, such as the S&P 500.
Read Full Story »»»
DiscoverGold
$SPY $9 Million OTM Calls (Highly Unusual)
By: Cheddar Flow | April 22, 2024
• $SPY $9M OTM Calls (Highly Unusual)
It is rare to see this much premium for a far OTM strike within 3 weeks of expiration
These whales are very bullish

Read Full Story »»»
DiscoverGold
$SPY 2 Large Bearish Orders to Start the Day
By: Cheddar Flow | April 22, 2024
• $SPY 2 Large Bearish Orders to Start the Day
$2.3M OTM Put (Above the Ask)
$1.6M OTM Call Sell Order

Read Full Story »»»
DiscoverGold
The 10 Top/Bottom S&P 500 Index percent net change performers
By: Thom Hartle | April 22, 2024
• Today (8:34 CST), the 10 top/bottom percent net change performers in the S&P 500 Index.

Read Full Story »»»
DiscoverGold
The 10 Top/Bottom NASDAQ 100 Index percent net change performers
By: Thom Hartle | April 22, 2024
• Today (8:34 CST), the 10 top/bottom percent net change performers in the NASDAQ 100 Index.

Read Full Story »»»
DiscoverGold
With a current value of 68.15, the Market Greed/Fear Index still indicates a prevailing sentiment of greed among investors, revealing their appetite for higher risk-taking in the US stock market
By: Isabelnet | April 22, 2024
• Sentiment
With a current value of 68.15, the Market Greed/Fear Index still indicates a prevailing sentiment of greed among investors, revealing their appetite for higher risk-taking in the US stock market.

Read Full Story »»»
DiscoverGold
The S&P 500 index generally performs poorly until Memorial Day in election years. However, as the year progresses, the market tends to regain momentum and deliver a solid performance
By: Isabelnet | April 22, 2024
• S&P 500
The S&P 500 index generally performs poorly until Memorial Day in election years. However, as the year progresses, the market tends to regain momentum and deliver a solid performance.

Read Full Story »»»
DiscoverGold
Nasdaq $QQQ reaches most oversold level since September 2022 - bounce this week?
By: Barchart | April 21, 2024
• Nasdaq $QQQ reaches most oversold level since September 2022 - bounce this week?

Read Full Story »»»
DiscoverGold
$QQQ GoNoGo flips fully bearish for the first time since October 2023
By: TrendSpider | April 20, 2024
• GoNoGo flips fully bearish for the first time since October 2023. $QQQ
Friendly reminder we still haven't even tested the 2021 all-time high yet.

Read Full Story »»»
DiscoverGold
Flow: Over the past week, US equity funds saw outflows of $4.69 billion, suggesting a shift in investor sentiment following an extended period of optimism in the US stock market
By: Isabelnet | April 20, 2024
• Flow
Over the past week, US equity funds saw outflows of $4.69 billion, suggesting a shift in investor sentiment following an extended period of optimism in the US stock market.

Read Full Story »»»
DiscoverGold
Total Number of Stocks Is Shrinking
By: Tom McClellan | April 20, 2024
The major averages may still be trending higher, but the total numbers of issues traded on the NYSE and Nasdaq peaked back in January 2022 and have been declining since then. This is not a bullish sign for the financial markets.
The Nasdaq market has looser listing standards than the NYSE, and so it attracts a larger number of total listings. But ease of doing an IPO on the Nasdaq sometimes means marginal companies which should not come public do so anyway, and then struggle afterward. For that reason, the Advance-Decline statistics for the Nasdaq have always had a bearish bias. In fact, the cumulative daily A-D Line for the Nasdaq has NEVER made a new all time high. It started going down from the beginning of the data in 1972, and it has never gotten back to that level, despite having more issues traded.
Having more IPOs can be a sign of an expanding economy. Perhaps it is better to say that expanding IPOs is a sign of easy money, such that even the marginal companies can still attract the capital to have a successful IPO. That increases the numbers of listed issues.
When the Fed started QE4 during Covid, and Congress threw its own pile of money at the economy, there was so much money sloshing around that the Nasdaq listings grew from around 3500 issues traded around the time of the Covid low in March 2020 to a high of 5175 in January 2022. The NYSE's total number of listed issues grew at that time too, although not by quite as much.
Now both are shrinking, as the marginal companies have revealed themselves and gotten delisted. Mergers and acquisitions also play a smaller part in the shrinkage.
One reason why this is meaningful is that a similar shrinkage in listed issues occurred leading up to the Internet bubble top in 2000. The high point for Nasdaq issues traded was actually back in December 1996, at 6136. By the time prices peaked for the Nasdaq Composite Index in March 2000, that number of Nasdaq issues traded was down to 5100, and it kept heading down.
One hard point about divergences is that they can last for a while, and they won't tell us when they are finally going to matter. But it cannot be seen as good news that money to invest is drying up, and the weak are getting picked off. In the stock market, illiquidity conditions initially come after the weak. But those same illiquidity conditions have a tendency of eventually mattering to even the biggest and supposedly most well-capitalized companies.
Read Full Story »»»
DiscoverGold
CoT: Peek Into Future Through Futures, How Hedge Funds Are Positioned
By: Hedgopia | April 20, 2024
• Following futures positions of non-commercials are as of April 16, 2024.
E-mini S&P 500: Currently net long 74.1k, up 137k.
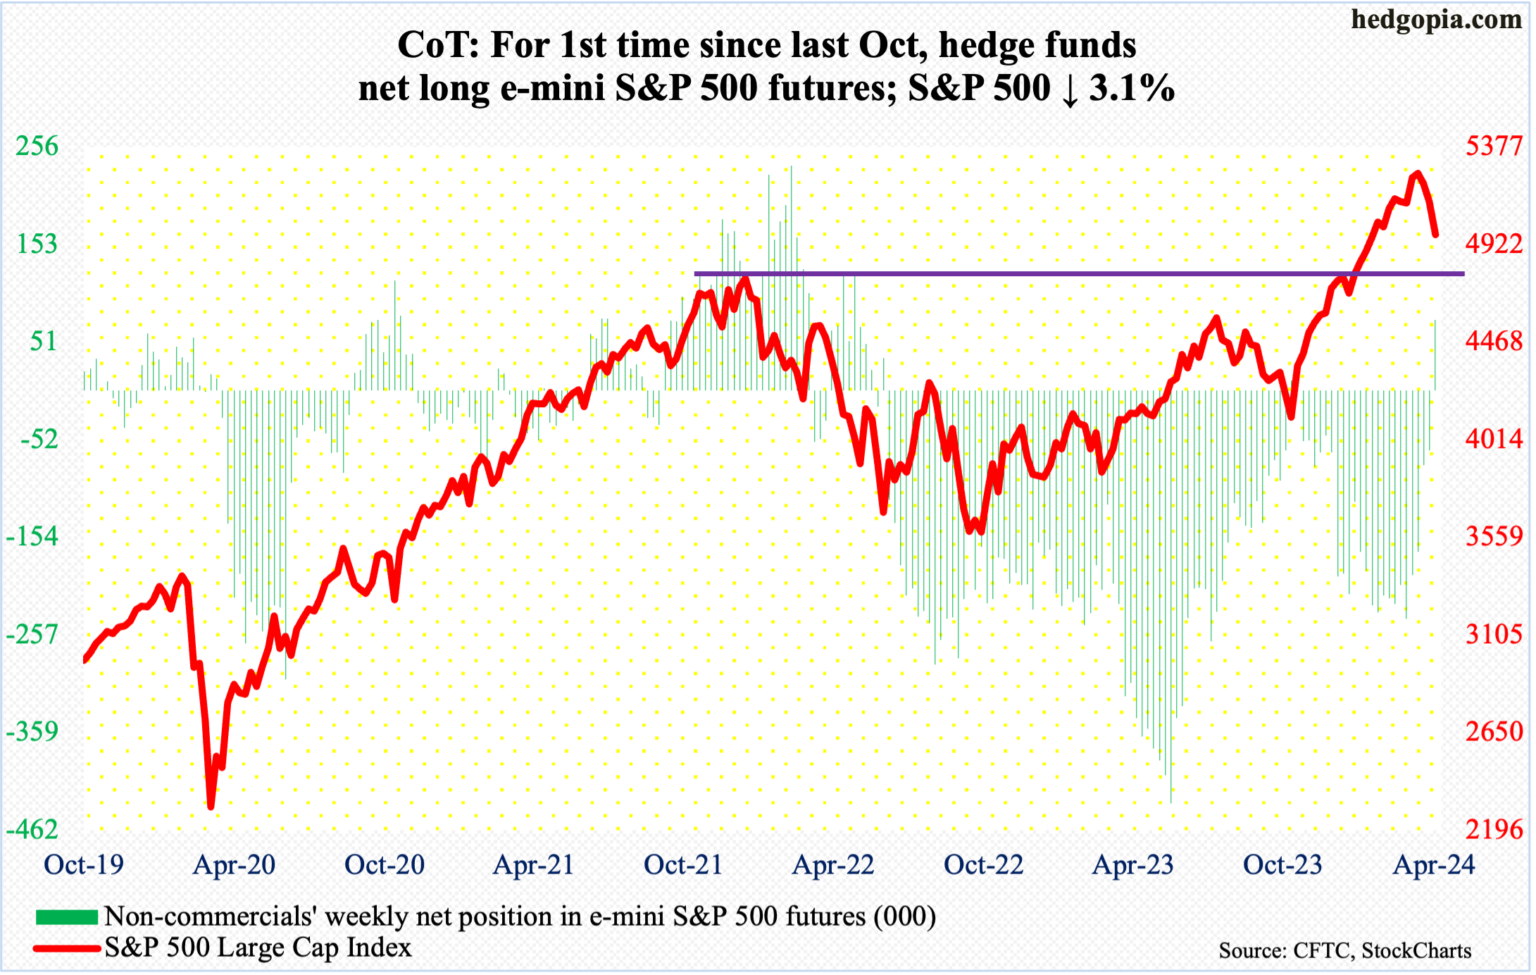
Non-commercials just switched to net long e-mini S&P 500 futures. They have not done so since last October when they were net long for only a couple of weeks; before that, they have not been net long since June 2022.
This is coming at a time when the cash is under pressure after having failed to bust out of 5260s in late March/early April. The S&P 500 peaked at 5265 on March 28th. This week, it shed 3.1 percent to 4967. After dropping for three weeks in a row, the large cap index is down 5.7 percent from last month’s high, which is nothing in the big scheme of things. From last October’s low, the index jumped 28.3 percent before weakening.
The daily is beginning to get oversold. If the weekly wins out, however, selling pressure can continue. In January, the S&P 500 surpassed its prior high of 4819 from January 2022. A breakout retest is just a matter of time. Should it take place right away, it is three percent away.
Nasdaq (mini): Currently net long 8.5k, up 986.
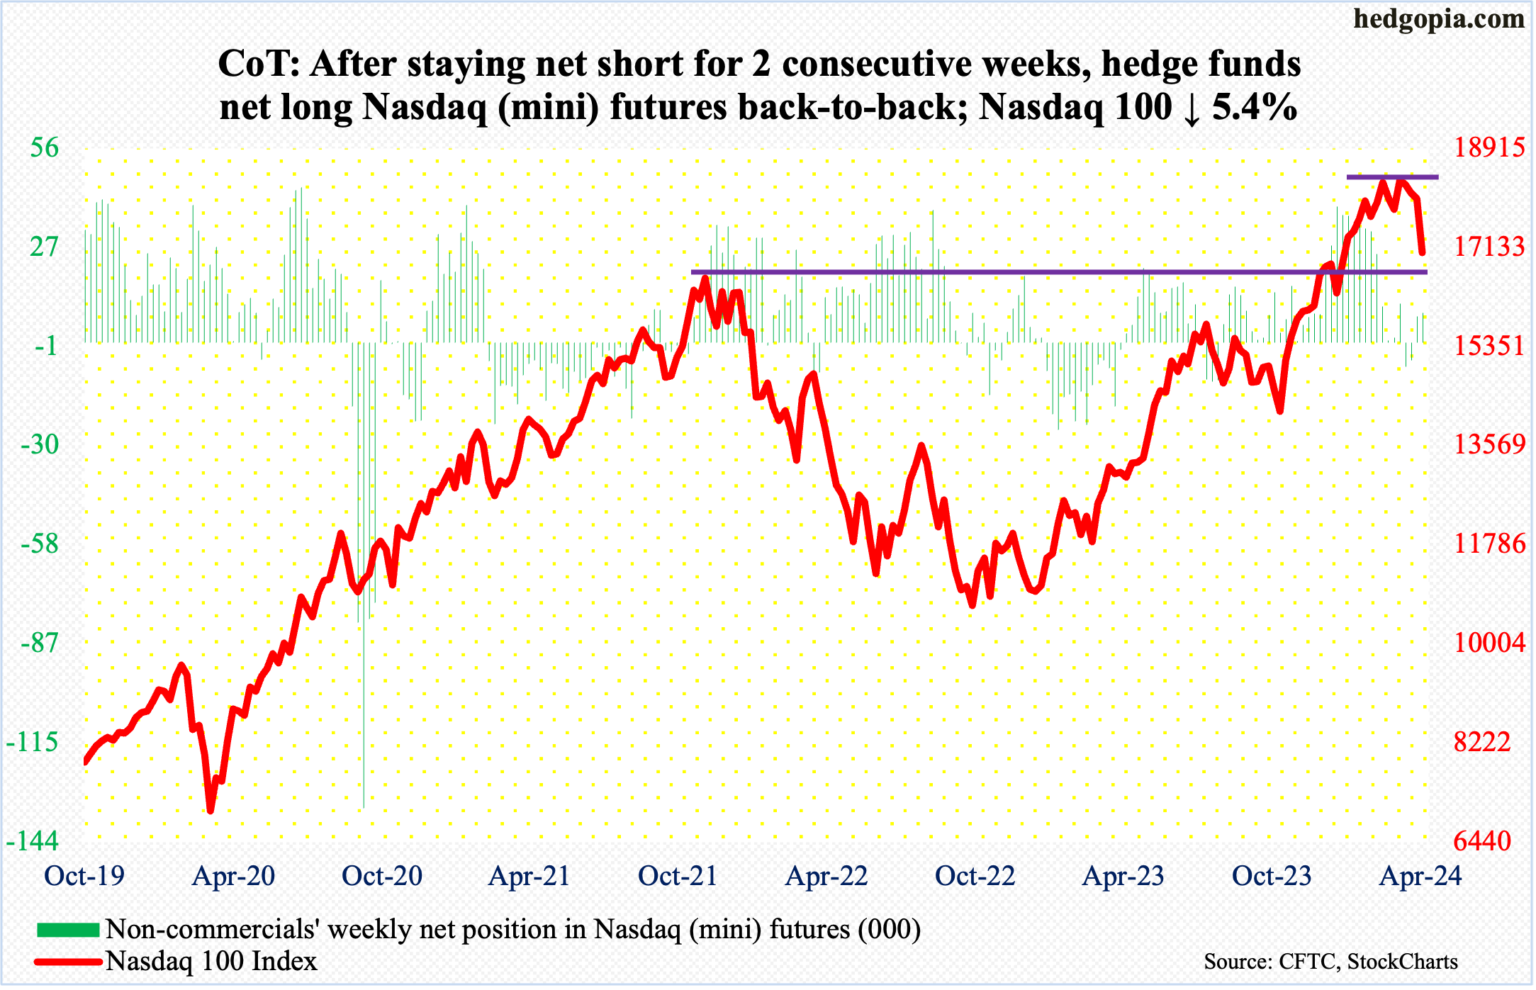
Last December, the Nasdaq 100 pushed through its prior high from November 2021. That 16765 breakout is being tested, as the tech-heavy index tagged 16964 intraday Friday. Earlier on March 21st the index posted a new intraday high of 18465.
After failing to sustainably break out of 18300s for seven weeks, the Nasdaq 100 crumbled this week, down 5.4 percent to 17038, with the week beginning with Monday’s breach of the 50-day. This preceded a breach a couple of weeks ago of a rising trend line from last October’s low.
The sector is behaving this way ahead of March-quarter results from US tech bigwigs in the next couple of weeks. Tesla (TSLA) reports next Tuesday, Microsoft (MSFT) and Google owner Alphabet (GOOG) on Thursday and Facebook owner Meta (META) on Wednesday. Apple (AAPL) and Amazon (AMZN) report the week after.
In the event of a rally, bulls need to recapture 17300s. A lack thereof exposes the index to a drop toward the 200-day (16267). The 50-day (17972) has been compromised.
Russell 2000 mini-index: Currently net short 38.5k, up 10.8k.
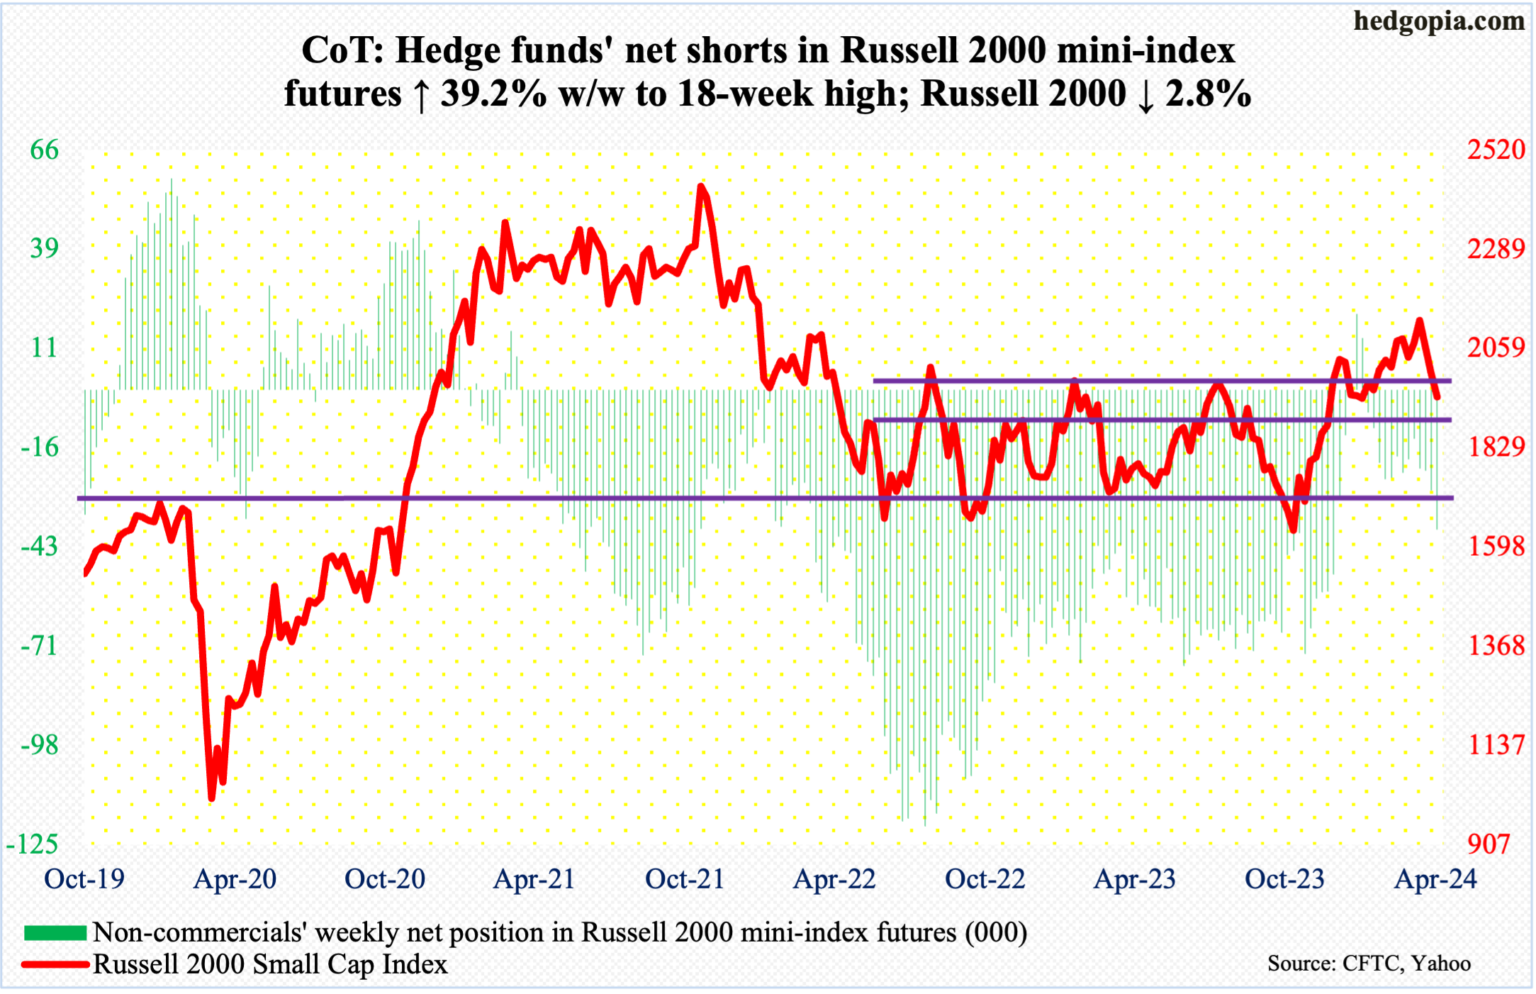
Last week, the Russell 2000 closed at 2003. Small-cap bulls, having failed to convincingly break out of 2100, were forced to defend 2000 and they failed. This week, the small cap index declined 2.8 percent to 1948. Ironically, this can be spun as good news by both bulls and bears. For the bulls, bids showed up Friday at 1932. For the bears, breakout retest at 1900 is still possible. On December 13th, the index broke out of a 1700-1900 range in place since January 2022.
US Dollar Index: Currently net short 929, down 213.
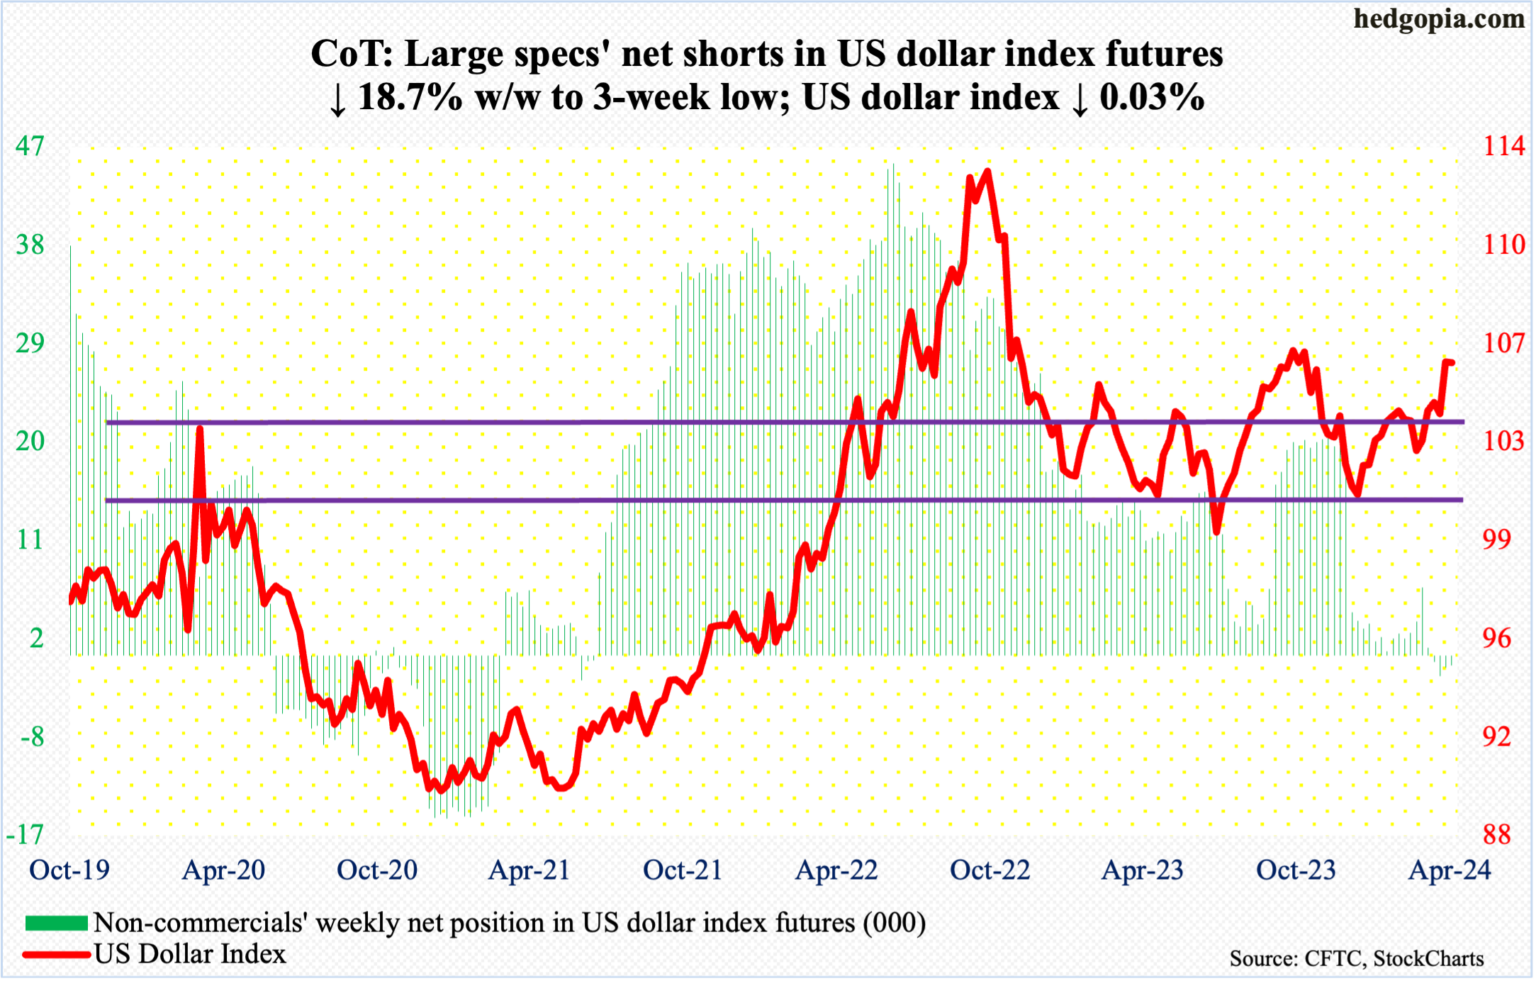
Dollar bulls tried to build on last week’s 1.9-percent jump in the US dollar index but did not quite pull it off. On Tuesday, the index tagged 106.33, but only to end the week at 105.98, down 0.03 percent.
This week’s action follows last week’s emphatic takeout of 103-104, which goes back to December 2016.
The bulls would still love to test 107, which between early October and early November last year rejected rally attempts several times.
VIX: Currently net short 22.5k, down 8.8k.
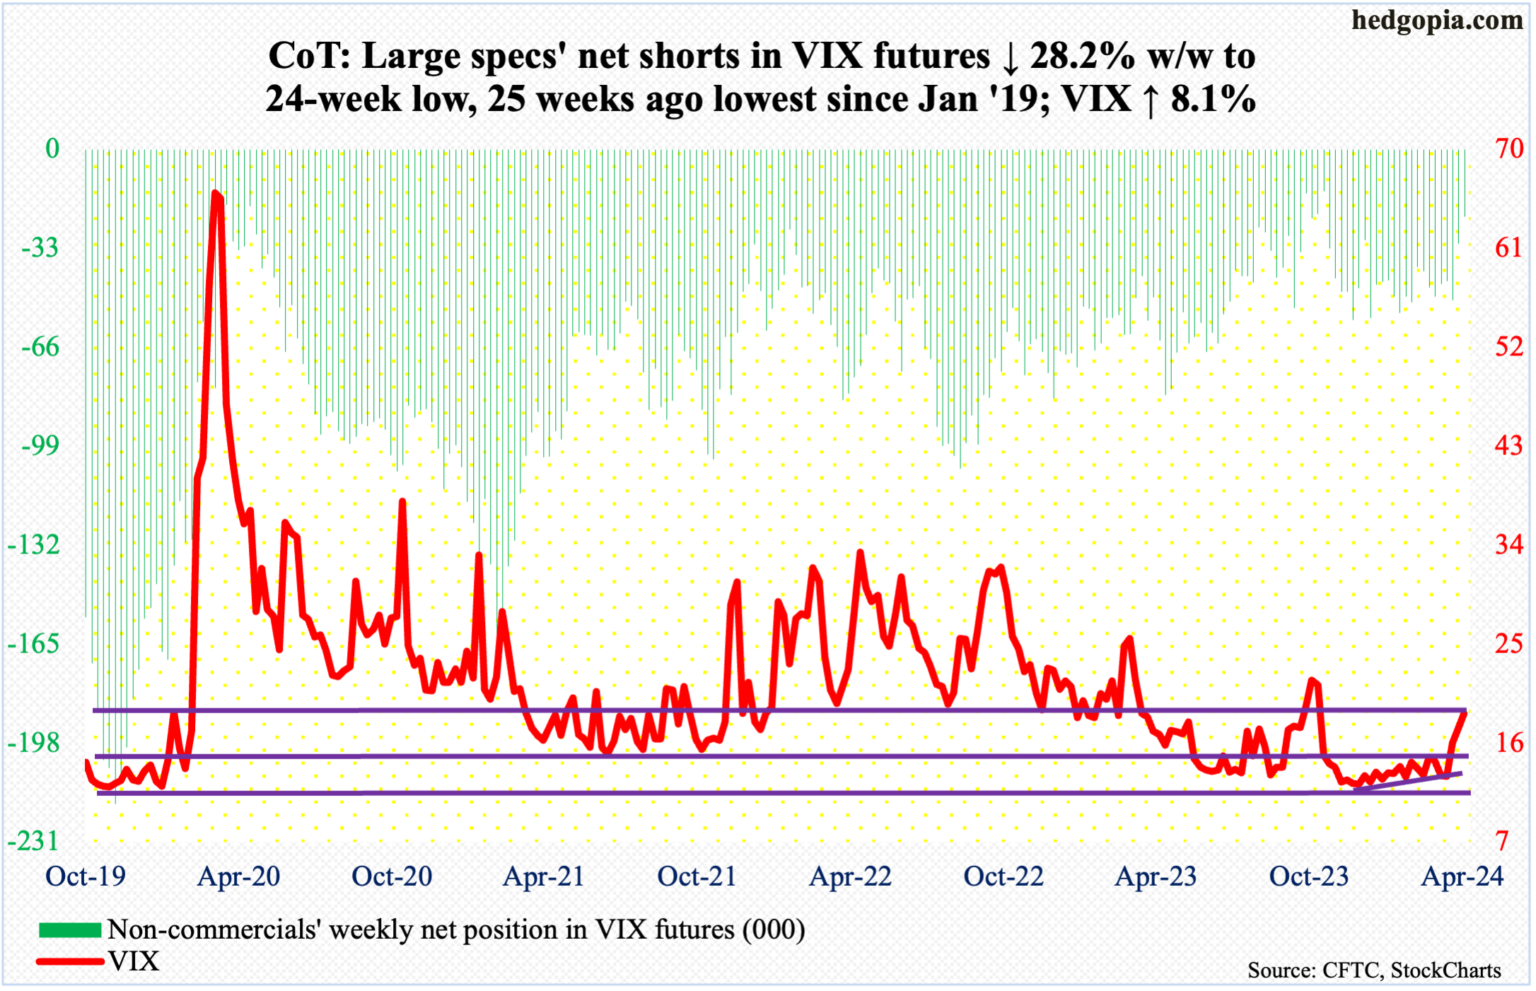
For the second week in a row, VIX rallied nicely but also ended with a weekly candle with a long upper shadow. Intraday Friday, the volatility index rallied as high as 21.36 but reversed to close at 18.71 – this in a session in which the S&P 500 dropped 0.9 percent, closing near the session low. Friday’s high was the highest since last October when VIX peaked at 23.08.
Concurrently, in the futures market, non-commercials are now only net short 22,474 contracts. Again, in the week to October 31st (last year), they cut their holdings to 13,979 before accumulating again. Historically, VIX has tended to peak as these traders go net long or get close to doing that.
Read Full Story »»»
DiscoverGold
S&P 500 Index (SPX) »» Weekly Summary Analysis
By: Marty Armstrong | April 20, 2024
S&P 500 Cash Index closed today at 496723 and is trading up about 4.13% for the year from last year's settlement of 476983. Factually, this market has been rising for 5 months going into April suggesting that this has been a bull market trend on the monthly time level which has been confirmed by electing all of our model's long-term Bullish Reversals from the key low. As we stand right now, this market has made a new low breaking beneath the previous month's low reaching thus far 495356 while it's even trading beneath last month's low of 505682.
ECONOMIC CONFIDENCE MODEL CORRELATION
Here in S&P 500 Cash Index, we do find that this particular market has correlated with our Economic Confidence Model in the past. The Last turning point on the ECM cycle low to line up with this market was 2009 and 2002. The Last turning point on the ECM cycle high to line up with this market was 2022 and 2007 and 2000.
MARKET OVERVIEW
NEAR-TERM OUTLOOK
The S&P 500 Cash Index has continued to make new historical highs over the course of the rally from 1974 moving into 2024. We have elected two Bullish Reversals to date.
This market remains in a positive position on the weekly to yearly levels of our indicating models. Pay attention to the Monthly level for any serious change in long-term trend ahead.
From a perspective using the indicating ranges on the Daily level in the S&P 500 Cash Index, this market remains in a bearish position at this time with the overhead resistance beginning at 505247.
On the weekly level, the last important high was established the week of March 25th at 526485, which was up 22 weeks from the low made back during the week of October 23rd. We have seen the market drop sharply for the past week penetrating the previous week's low and it closed beneath that low which was 510794. This was a very bearish technical indicator warning that we have a shift in the immediate trend. We are trading below the Weekly Momentum Indicators warning that the decline is very significant and we need to pay attention to the timing and reversals. When we look deeply into the underlying tone of this immediate market, we see it is currently still in a weak posture.
INTERMEDIATE-TERM OUTLOOK
YEARLY MOMENTUM MODEL INDICATOR
Our Momentum Models are rising at this time with the previous low made 2022 while the last high formed on 2023. However, this market has rallied in price with the last cyclical high formed on 2022 warning that this market remains strong at this time on a correlation perspective as it has moved higher with the Momentum Model.
Interestingly, the S&P 500 Cash Index has been in a bullish phase for the past 12 months since the low established back in March 2023.
Critical support still underlies this market at 438504 and a break of that level on a monthly closing basis would warn that a sustainable decline ahead becomes possible. Nevertheless, the market is trading below last month's low warning of weakness at this time.
DiscoverGold
Nasdaq Composite Index (COMP) »» Weekly Summary Analysis
By: Marty Armstrong | April 20, 2024
NASDAQ Composite Index Cash opened below the previous low and closed beneath it as well warning of a bearish posture right now. It closed today at 1528201 and is trading up about 1.80% for the year from last year's settlement of 1501135. Caution is required for this market is starting to suggest it may now decline on the MONTHLY level.
At present, this market has been rising for 5 months going into April suggesting that this has been a bull market trend on the monthly time level which has been confirmed by electing all of our model's long-term Bullish Reversals from the key low. As we stand right now, this market has made a new low breaking beneath the previous month's low reaching thus far 1522278 while it's even trading beneath last month's low of 1586263.
ECONOMIC CONFIDENCE MODEL CORRELATION
Here in NASDAQ Composite Index Cash, we do find that this particular market has correlated with our Economic Confidence Model in the past. The Last turning point on the ECM cycle low to line up with this market was 2022 and 2009 and 2002. The Last turning point on the ECM cycle high to line up with this market was 2007 and 2000.
MARKET OVERVIEW
NEAR-TERM OUTLOOK
The NASDAQ Composite Index Cash has continued to make new historical highs over the course of the rally from 2009 moving into 2024. Noticeably, we have elected four Bullish Reversals to date.
This market remains in a positive position on the weekly to yearly levels of our indicating models. Pay attention to the Monthly level for any serious change in long-term trend ahead.
The perspective using the indicating ranges on the Daily level in the NASDAQ Composite Index Cash, this market remains in a bearish position at this time with the overhead resistance beginning at 1586388.
On the weekly level, the last important high was established the week of March 18th at 1653886, which was up 21 weeks from the low made back during the week of October 23rd. We have seen the market drop sharply for the past week penetrating the previous week's low and it closed beneath that low which was 1609202. This was a very bearish technical indicator warning that we have a shift in the immediate trend. We are trading below the Weekly Momentum Indicators warning that the decline is very significant and we need to pay attention to the timing and reversals. When we look deeply into the underlying tone of this immediate market, we see it is currently still in a weak posture.
INTERMEDIATE-TERM OUTLOOK
YEARLY MOMENTUM MODEL INDICATOR
Our Momentum Models are rising at this time with the previous low made 2022 while the last high formed on 2023. However, this market has rallied in price with the last cyclical high formed on 2021 warning that this market remains strong at this time on a correlation perspective as it has moved higher with the Momentum Model.
Interestingly, the NASDAQ Composite Index Cash has been in a bullish phase for the past 12 months since the low established back in March 2023.
Critical support still underlies this market at 1405840 and a break of that level on a monthly closing basis would warn that a sustainable decline ahead becomes possible. Nevertheless, the market is trading below last month's low warning of weakness at this time.
DiscoverGold
Market volatility is a normal feature of long-term investing
By: Raymond James Financial | April 19, 2024
Key Takeaways
• Over optimism flagged near-term pullback
• Volatility is a normal feature of long-term investing
• Pockets of weakness are not overly concerning
Keep Calm and Carry On! The recent burst of volatility after a prolonged period of calm has captured the market’s attention and temporarily halted the S&P 500’s recent winning streak. While market gyrations can be concerning, remember not to panic – pullbacks and interim spikes in volatility are quite common. Below we put the recent market movements in perspective, which have been driven by time (it has been a while since we had a 5%+ pullback), overly optimistic, complacent market sentiment, and higher Treasury yields amid persistent inflationary pressures and signs of a more patient Fed. However, we reiterate our positive long-term view and suggest using periods of weakness opportunistically.
• A near-term pullback was expected | Our year-end target for the S&P 500 is 5,200. The problem: we exceeded that target in March – approximately nine months ahead of schedule. Why? Because equity market momentum and sentiment tend to cause the equity market to move to exaggerated values to both the upside and downside. It is not unusual and part of the fabric of the market. Let’s break our target down: first, it is based on 2024 S&P 500 earnings of $240, which we recently revised higher on the back of the resilient economy – a good thing. Second, we employ a P/E multiple of 21.5x our earnings forecast. That valuation is already expensive, representing a market priced in the top decile over the last twenty years, signifying the market is priced for perfection and susceptible to disappointments. Third, we base our numbers on fundamentals and strip out emotions/sentiment. However, the market had gotten uber optimistic from a positioning and sentiment perspective. For example, retail investors were the second most optimistic on the equity market over the last 30 years. Lofty levels of investor confidence have historically coincided with periods of more muted performance and increased volatility. What have been the catalysts to shake some of this confidence and initiate the recent pullback? Climbing interest rates (10-year Treasury yields are up ~75 bps YTD), troubling inflation, reduced expectations for Fed rate cuts (fewer than two cuts are now expected in 2024) and rising geopolitical tensions.
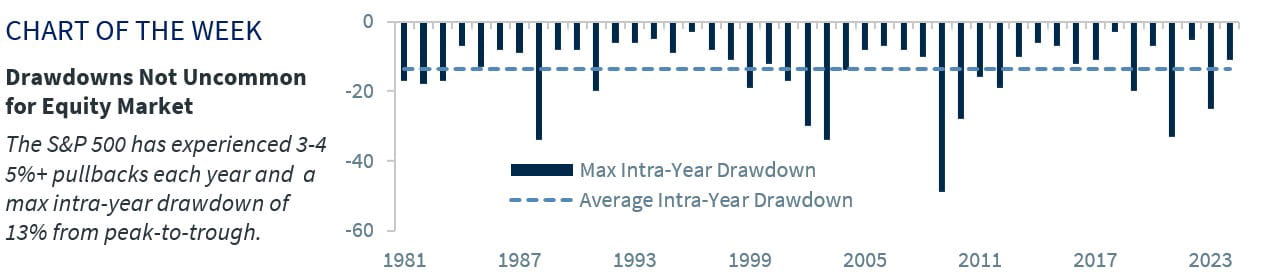
• Volatility is expected in the equity market | The S&P 500 had rallied more than 27% since October 27. This uninterrupted rally is uncommon as it is important to appreciate that the equity market does not go up in a straight line. Sure, bouts of market volatility can be unnerving, but they are a normal feature of long-term investing. In fact, pullbacks of the 5% variety occur multiple times a year. Dating back to 1980, the S&P 500 has experienced three to four 5%+ pullbacks on average each year. There have only been two years over that time span (44 years in total) during which the market bucked the trend and did not experience a 5% pullback during the year. Furthermore, the S&P 500 typically experiences a max drawdown (from peak to trough) during the year of ~13-14% on average each year. If the current 4.6% drawdown were to be the maximum drawdown this year, it would mark the third smallest annual drawdown over the last 44 years. The point is: this will likely not be the last or most significant pullback this year.
• Pockets of weakness are not overly concerning | Thus far, the pullback has been orderly and the spillover effects into other asset classes and the broader market have been limited. For example, we are not seeing a huge flight-to-safety into Treasurys, which typically occurs when the market is concerned about sharp shifts in risk appetite. Credit spreads have remained historically tight – not signaling any major concerns that something more ominous may be on the horizon. Within the stock market, the defensive sectors (i.e., Staples, Utilities, Health Care) are still underperforming the S&P 500 since its recent peak in late March. If the market was worried about a major risk-off event, these sectors would typically assume leadership, which they have not. However, areas of weakness have been justifiable: homebuilders and REITS have suffered due to their interest-rate sensitivity; semi-conductors have retreated after an incredible 55% rally over the last four months; and Consumer Discretionary stocks have struggled with the automotive industry (price pressures with EV vehicles) and specialty retailers (some signs of consumer fatigue).
Bottom line | The biggest question on investors’ minds is whether the current drawdown is normal or the start of something more severe (i.e., a bear market)? Our answer: given we have been calling for a pullback, this is likely a consolidation phase to digest the recent gains and not the end of this bull market. But how much further downside can be expected? Well, given the historical average drawdown has been ~14% a year, further downside cannot be ruled out. One area of support – although this is unlikely as uber optimism has already begun to wane – would be the 200-day moving average (~4,670), which reflects 10% downside from recent highs or an additional 5% from current levels. However, even if this were to occur, it would not change our long-term positive equity view as corporate fundamentals remain on solid footing and earnings are trending upwards. While interest rates have moved higher, it is for the right reason—stronger economic growth. Stronger economic growth leads to upside for corporate earnings—the indicator with the strongest predictive power for future equity returns. As a result, we reiterate our year-end S&P 500 target of 5,200 and would use periods of weakness to add to our favorite areas of the market—Info Tech, Industrials, Health Care, and Energy.
Read Full Story »»»
DiscoverGold
Big Election Year Q1s Dip April-May Before Gains Last 7 Months
By: Almanac Trader | April 19, 2024

2024’s great start was the third best Election Year Q1 since 1950. Looks like we’re tracking Top Q1 Election Years more pronounced April-May dip. Chop continues in July and August and these years have marked time until the election in November, gaining about 2.5% on from April to October. Regardless of the election outcome S&P 500 suffered only two losses in the last seven months of election years since 1950, 2000 and 2008 (2024 STA page 80).
Read Full Story »»»
DiscoverGold
$NDX - 2nd Target Hit...
By: Sahara | April 19, 2024
• $NDX - 2nd Target Hit...

Read Full Story »»»
DiscoverGold
$SPX Flow is starting to Flip
By: Cheddar Flow | April 19, 2024
• $SPX Flow is starting to Flip

Read Full Story »»»
DiscoverGold
Did the S&P 500 Put in a Multi-year Top?
By: Dr. Arnout Ter Schure | April 18, 2024
• By Breaking below $5056, the S&P 500 index has signaled it is ready for a larger correction to at least $4600+/-100, possibly it has struck a multi-year top.
Warning Levels Are There For A Reason
In our update from early March, we anticipated using the Elliott Wave Principle (EWP)
“…. However, if, like last, the index breaks higher because the bears fail to break below critical levels and reach the next target zone of ~$5260, support will be moved up to $5150.”
In our last update from early April, we then concluded that
“… a breakout above last week’s high can ideally target $5390, contingent on holding above the colored warning levels, but ultimately, we still need to see a break below $5056 with a severe warning below $5100 to confirm a significant top has been struck.”
Fast forward, the index could not break above the March 28, $5264 peak; instead, it broke below the warning levels ($5100 and $5056) this week. Thus, our call for a top in the ~$5260 target zone and that we would only see higher prices contingent on holding above critical downside levels was correct. As such, we are now tracking a potential five-wave move, i.e., an impulse, lower to ideally around $4800 for red W-a/i before we see a more significant bounce (red W-b/ii) develop—contingent on the index holding below the colored warning levels for the Bears. See Figure 1 below.
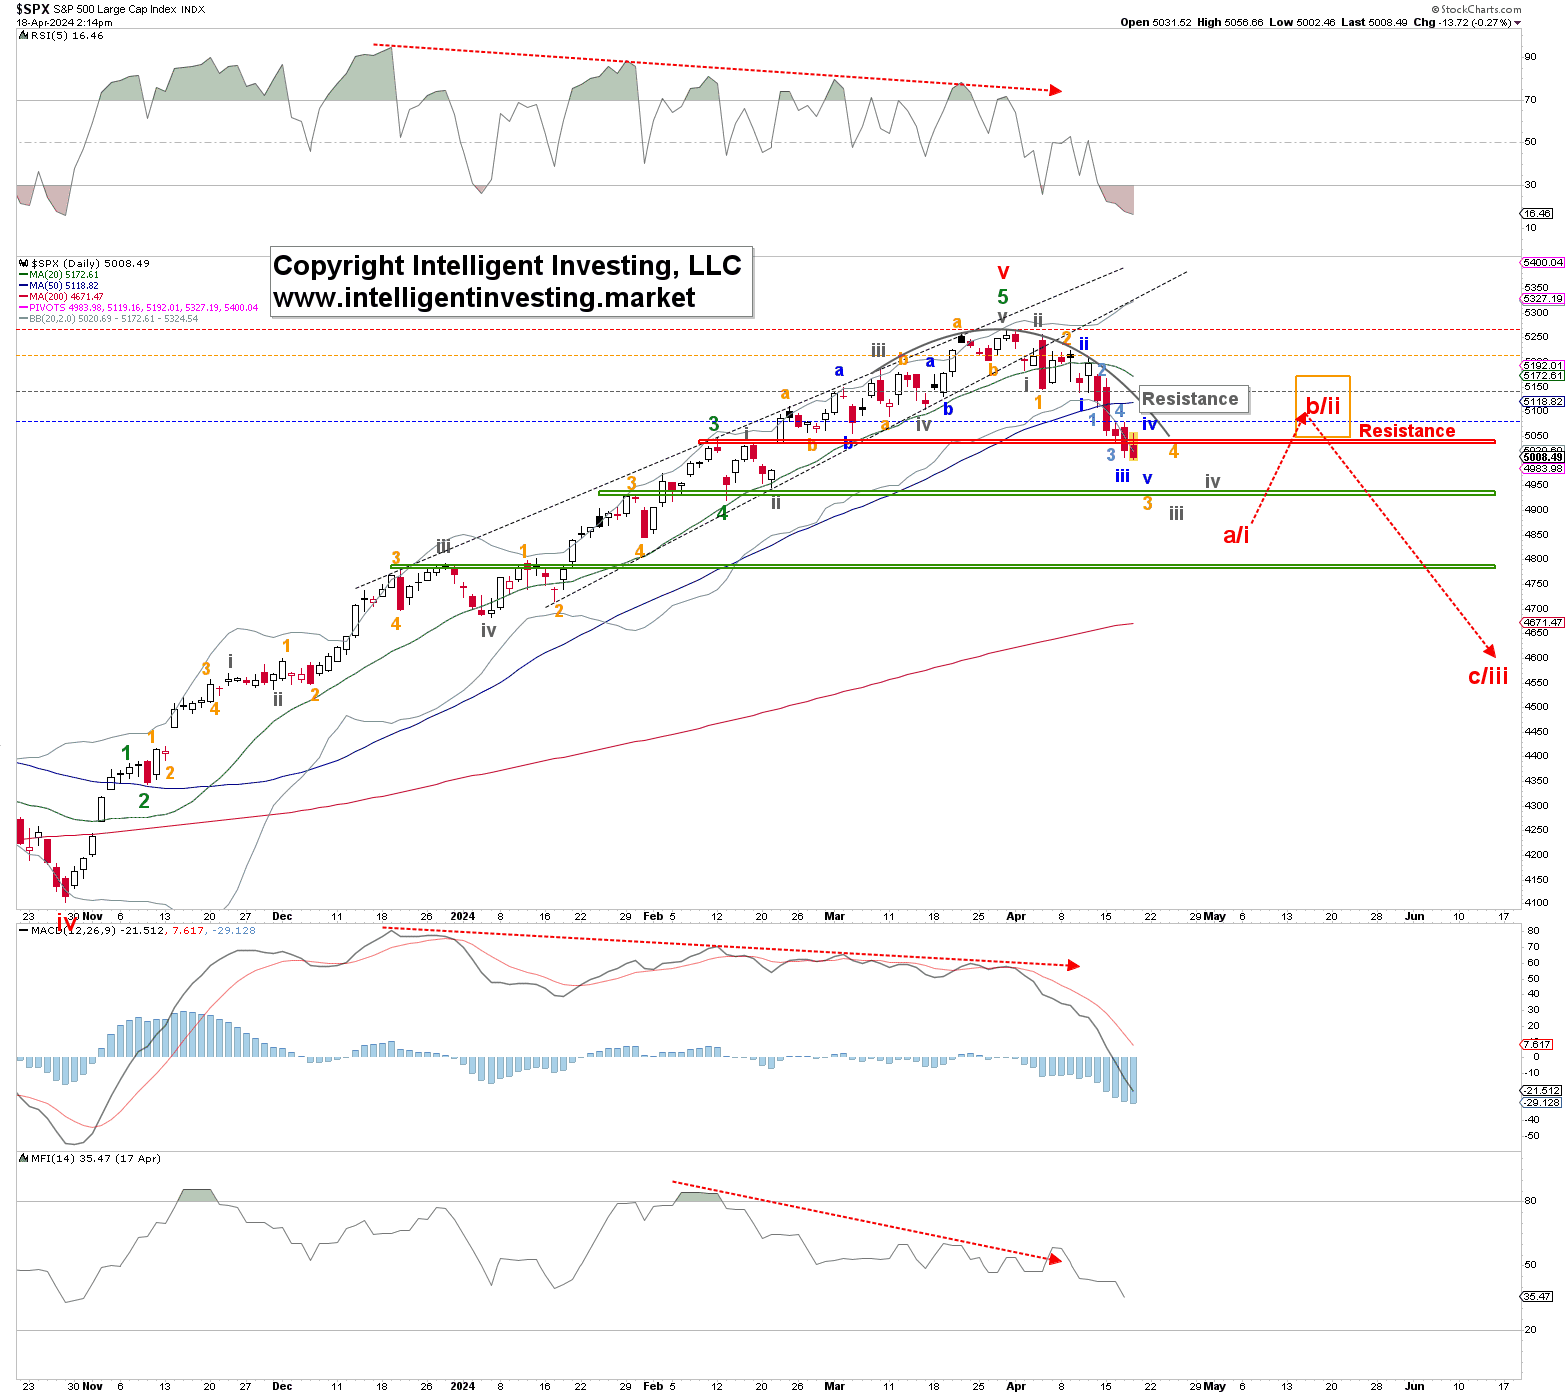
Figure 1. Daily SPX chart with detailed EWP count and technical indicators
How Significant Is This Top?
The “significant top” we mentioned is shown in Figures 2 and 3 below. Namely, either the index can complete a large ending diagonal from the March 2020 low (Figure 2) or the index has completed the Bull run that started in 1933 after the 1929 market crash (Figure 3).
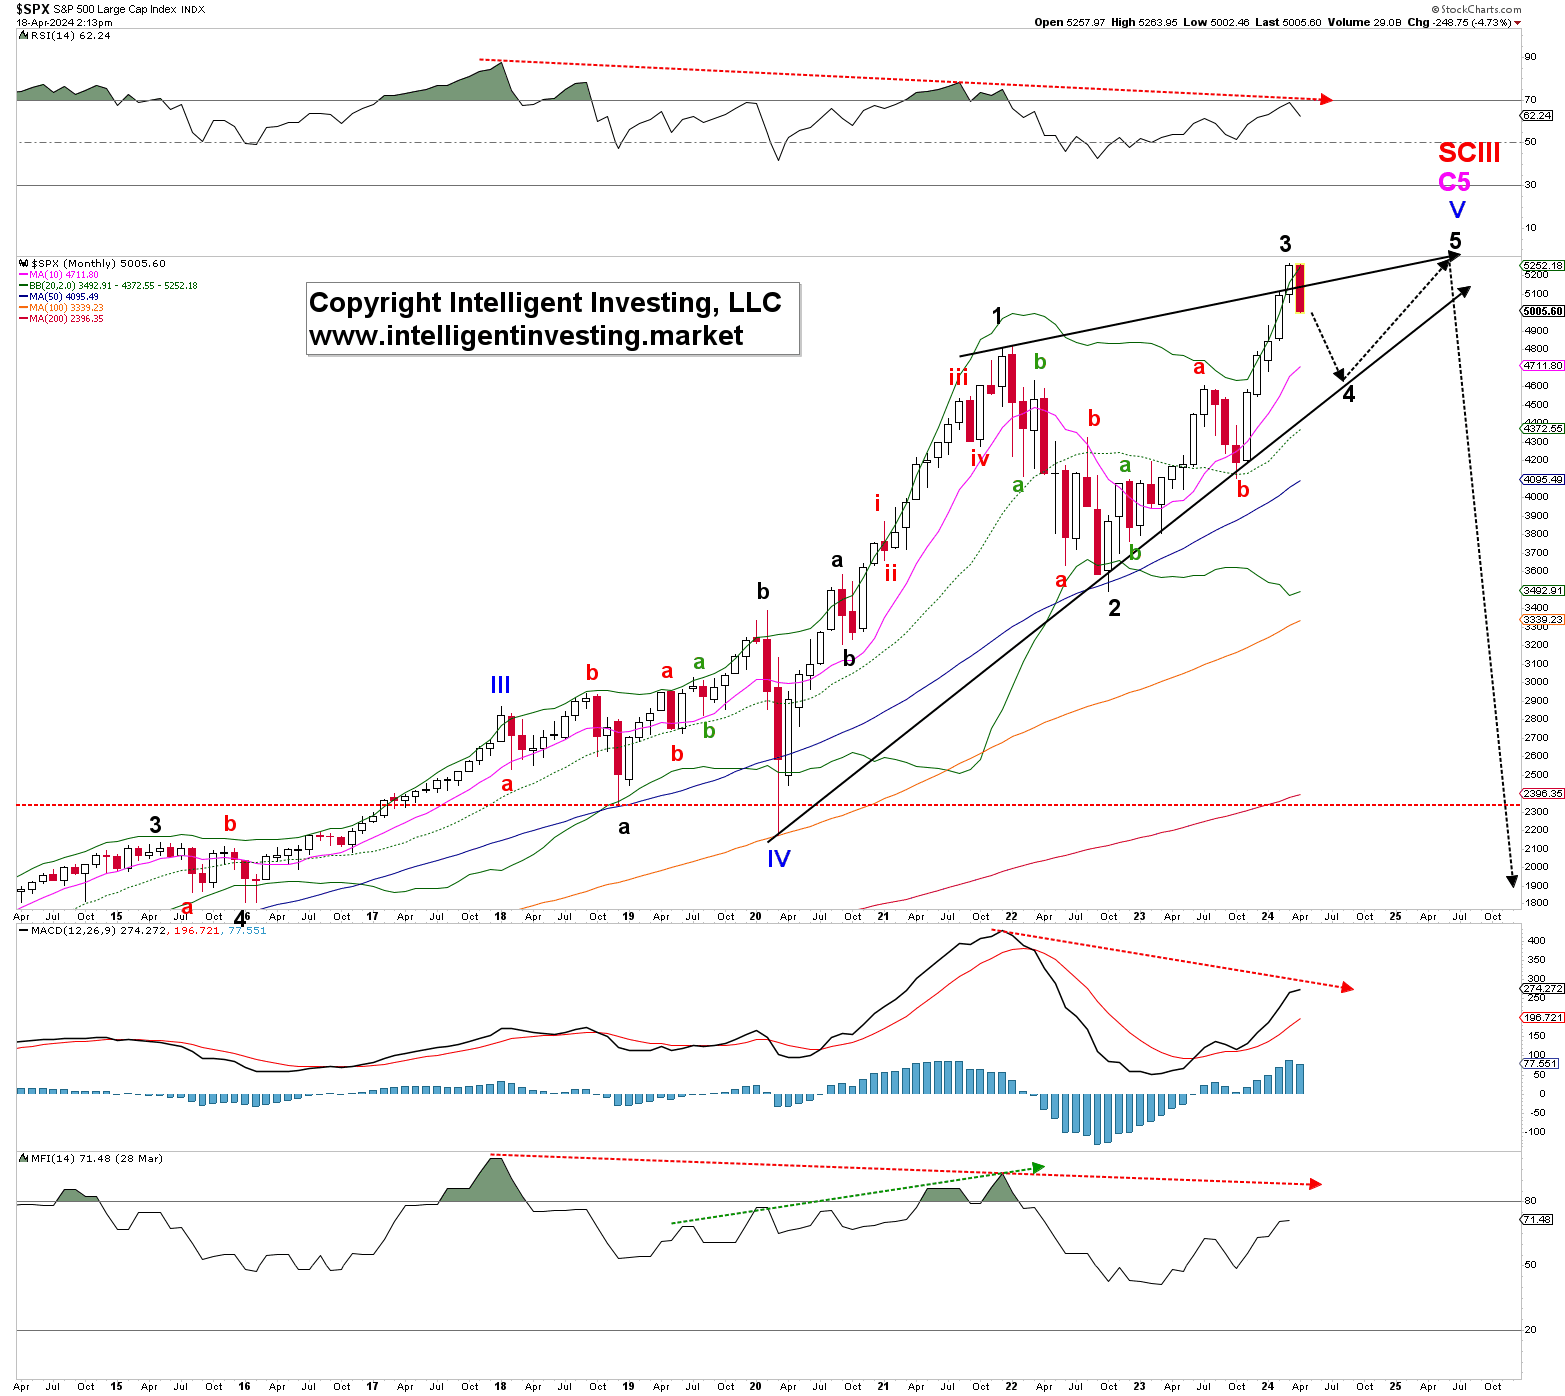
Figure 2 Monthly SPX chart with detailed EWP count and technical indicators
The former means that the SP500 will bottom around $4600 for the black W-4 and then rally one last time to $5800+/-200 for the black W-5. The latter means the index has entered a multi-year bear market, which can last a decade and ultimately bring the price back to ~$1500.
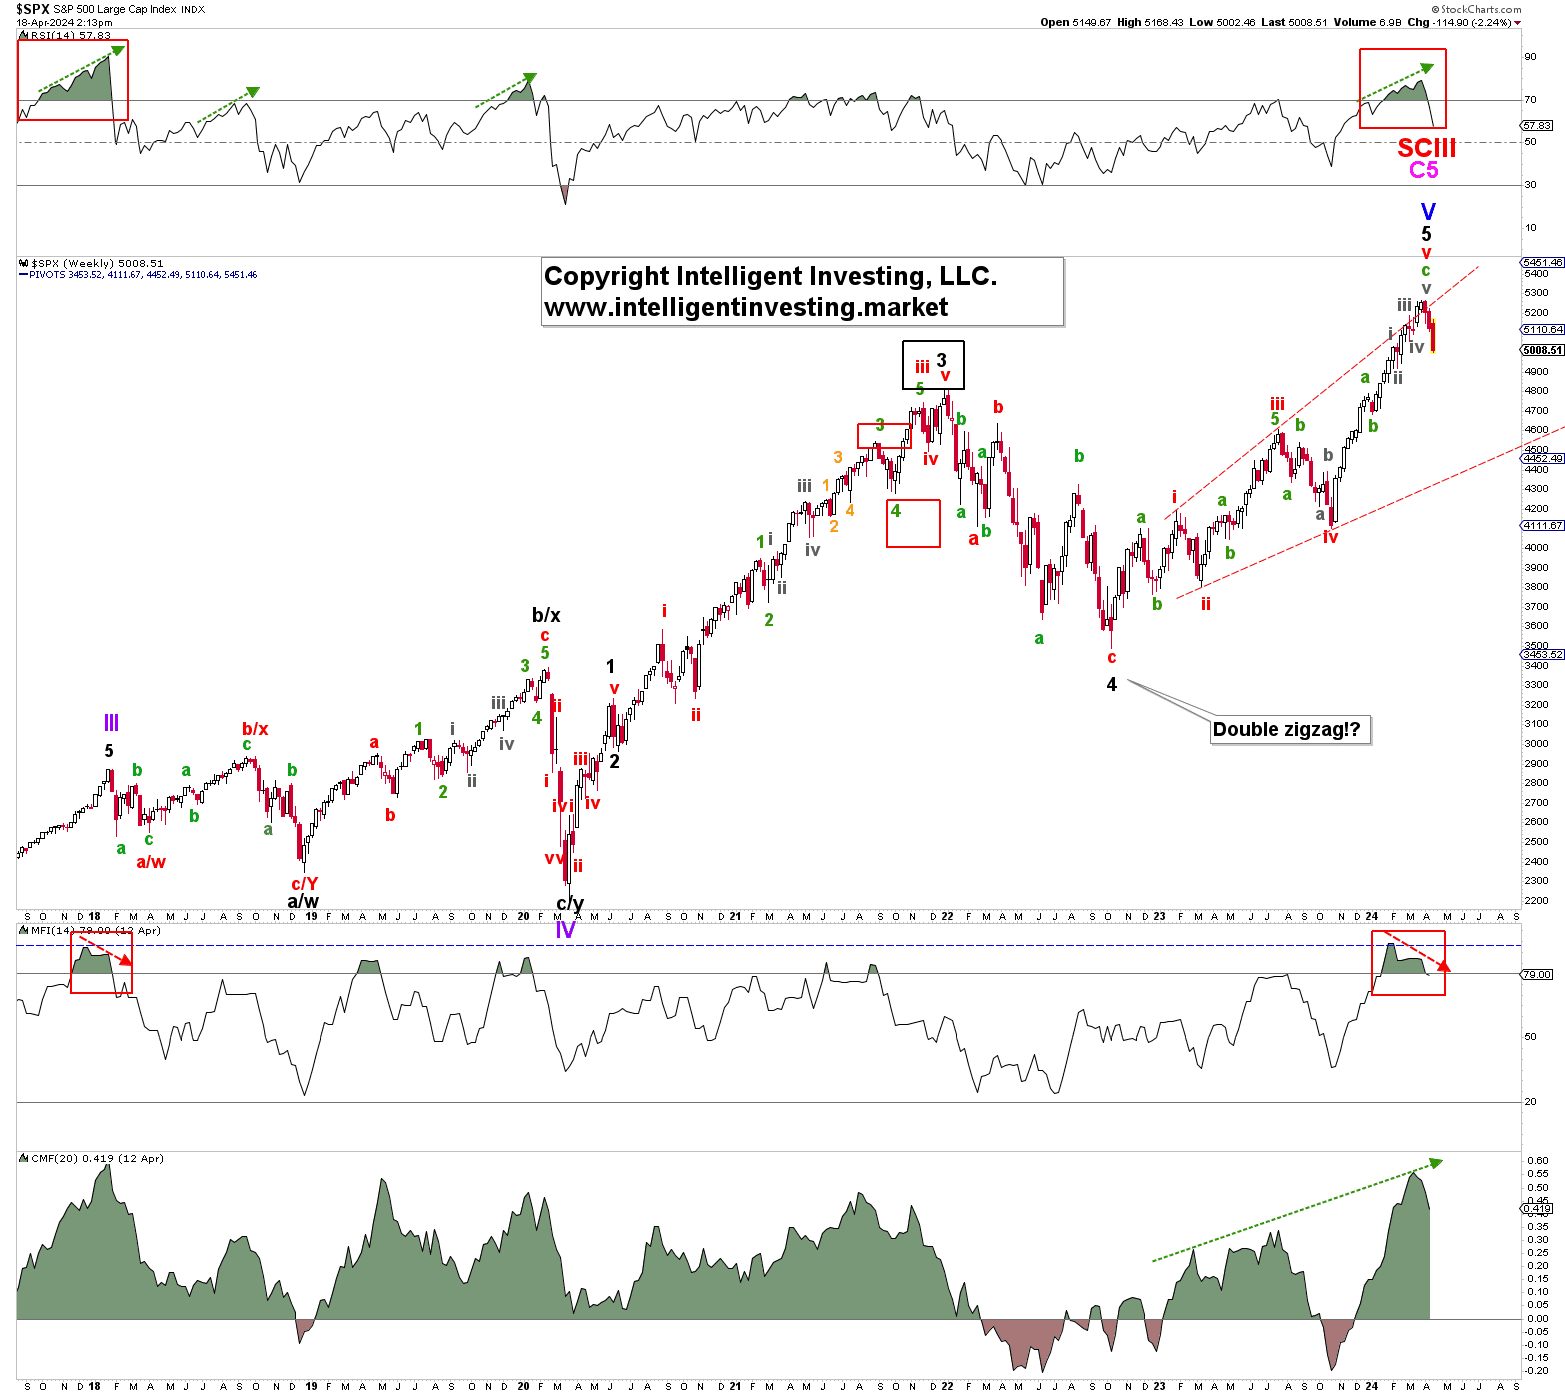
Figure 3. Weekly SPX chart with detailed EWP count and technical indicators
Although the current technical indicator (TI) set up for the weekly chart is like late 2017—see the red boxes in Figure 3 above—suggesting that we could see higher prices afterward akin to 2018, the monthly TIs are heavily negatively diverging—see the red dotted arrows in Figure 2 above—suggesting that any upside will be short-lived and minimal.
Thus, we cannot yet discern between the two bigger-picture options at this stage, but if we see an impulse develop to the downside, as shown in Figure 1, the odds will favor the most bearish scenario.
Read Full Story »»»
DiscoverGold
Money managers Reduced their exposure to the US Equity markets since last week...
DiscoverGold
NAAIM Exposure Index
April 18, 2024
The NAAIM Number
62.98
Last Quarter Average
87.84
»»» Read More…
The AAII Investor Sentiment
By: AAII | April 18, 2024
Bullish 38.3%
Neutral 27.8%
Bearish 34.0%
• Historical 1-Year High
Bullish: 52.9%
Neutral: 37.7%
Bearish: 50.3%
Read Full Story »»»
DiscoverGold
$QQQ The more confluence, the higher the probability
By: TrendSpider | April 18, 2024
• The more confluence, the higher the probability. $QQQ

Read Full Story »»»
DiscoverGold
When the S&P 500 is positive YoY 12 months in a row, the next 12 months tend to be bullish, with a median return of 9.5% since 1950
By: Isabelnet | April 18, 2024
• S&P 500
When the S&P 500 is positive YoY 12 months in a row, the next 12 months tend to be bullish, with a median return of 9.5% since 1950.

Read Full Story »»»
DiscoverGold
S&P 500: The increase in aggregate US liquidity since the lows of October 2022 has played a significant role in the upward trend of US stocks, sparking a sense of optimism among market participants
By: Isabelnet | April 18, 2024
• S&P 500
The increase in aggregate US liquidity since the lows of October 2022 has played a significant role in the upward trend of US stocks, sparking a sense of optimism among market participants.

Read Full Story »»»
DiscoverGold
$SPX $50+ Million Further-Dated Put Orders *Above the Ask*
By: Cheddar Flow | April 18, 2024
• $SPX $50M+ Further-Dated Put Orders
*Above the Ask*

Read Full Story »»»
DiscoverGold
Election Year Drawdowns Happen – S&P 500 Average Pullback 13% since 1952
By: Almanac Trader | April 17, 2024
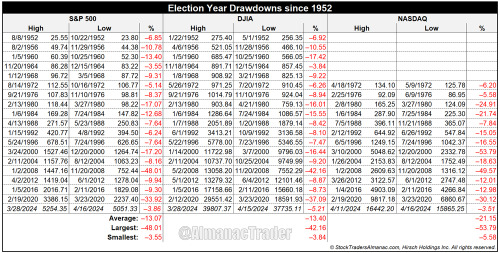
After five straight months of gains and numerous new all-time highs, recent weakness and the corresponding spike in volatility seem unfamiliar. Despite lingering inflation and escalating geopolitical tensions, S&P 500 was down 3.86% from its closing all-time high of 5254.35 on March 28 through its close on April 16. This is well below the average historical largest drawdown during an election year since 1952 of 13.07%. Were it not for steep declines in 2020 and 2008, election years have tended to enjoy relatively modest drawdowns. Of the last 18 election years, 11 experienced single-digit drawdowns. The smallest was just 3.55% in 1964. DJIA’s record is similar to S&P 500 while the higher beta stocks of the NASDAQ Comp have experienced larger election year drawdowns.
Read Full Story »»»
DiscoverGold
$NDX - Tapped the 1st Target from the Bear 'Wedge'...
By: Sahara | April 17, 2024
• $NDX - Tapped the 1st Target from the Bear 'Wedge'...

Read Full Story »»»
DiscoverGold
The S&P 500 index may potentially reach 5600 during a summer rally, as part of a catch-up trade within a secular bull market presidential cycle
By: Isabelnet | April 17, 2024
• The S&P 500 index may potentially reach 5600 during a summer rally, as part of a catch-up trade within a secular bull market presidential cycle.

Read Full Story »»»
DiscoverGold
The NYMO (McClellan Oscillator for the $NYSE, which measures market breadth) registered -100 yesterday...
By: Intelligent Investing | April 16, 2024
• The NYMO (McClellan Oscillator for the $NYSE, which measures market breadth) registered -100 yesterday. Readings below -100 are rare (see Chart 1: about once every year on average). It means the market is pretty oversold, but often it requires positive divergence (lower markets but improving NYMO) to signal a low is in place. See chart 2.


Read Full Story »»»
DiscoverGold
Which Has More Staying Power, Stocks or Gold?
By: Schaeffer's Investment Research | April 17, 2024
• When SPX and gold prices both gain, it usually is a good sign for equities
• When gold and stocks trade in the same direction, it bodes well for stocks
Despite the impressive performance from stocks in recent months, it pales in comparison to gold. Prior to the recent pullback, stocks had surged by more than 10% in the preceding three months and by over 20% in the past six months. Conversely, gold prices have soared by more than 15% in the last three months and by over 25% in the preceding six months. That’s a lot of money flowing into what is often considered competing asset classes. This week, I’m looking into past instances when stocks and gold surged higher together to see if history has tended to favor one or the other going forward… or both or neither.

GOLD, STOCKS FLYING HIGH TOGETHER
Going back to 1980, I found times that the S&P 500 Index (SPX) and gold both shot up at least 10% over a three-month period. There were 16 prior instances, with the last time occurring this past December. The table below summarizes the S&P 500 returns after these instances. Stocks tended to outperform their baseline after these occurrences in each of the timeframes studied from one month to a year out. For example, six months after these two assets rally 10% over a three-month period, the S&P 500 gained an average of 10.4%, with 93% of the returns positive. Typically, the S&P 500 has gained about 5% over a six-month period with 73% of returns positive.

Next, let’s see how gold has performed after the same signals. History clearly favors buying stocks over gold after these occurrences; the safe-haven asset has typically underperformed after strong rallies from equities. Six months after the signals, gold averaged a slight loss, with just 40% of the returns positive. Since 1980, gold typically gained 2% over a six-month period with a 54% chance of having a positive return.

I did a similar study as above, except instead of looking at three-month rallies of 10% or more for both assets, I looked at 15% rallies over six months. The first table shows S&P 500 returns after these updated signals and the second table shows the gold returns. Stocks tended to rally strong immediately after these signals, gaining over 5% on average over the next three months. But then the longer term six-month and one-year returns, the SPX underperformed its typical returns since 1980. Gold, on the other hand, underperformed in the shorter term timeframes then outperformed its baseline over six and 12 months.

Based on the historical data above, stocks have been a much better bet than gold after strong rallies in both assets.
Read Full Story »»»
DiscoverGold
The 10 Top/Bottom S&P 500 Index percent net change performers
By: Thom Hartle | April 17, 2024
• Today (8:34 CST), the 10 top/bottom percent net change performers in the S&P 500 Index.

Read Full Story »»»
DiscoverGold
|
Followers
|
178
|
Posters
|
|
|
Posts (Today)
|
7
|
Posts (Total)
|
67971
|
|
Created
|
06/10/03
|
Type
|
Free
|
| Moderators DiscoverGold | |||
:::::::::::: Welcome to S&P 500 & Nasdaq Analysis and Trends :::::::::::::
• The purpose of this board is to help others with Short & Long term S&P 500 & Nasdaq analysis and direction.
• This is strickly an educational board helping traders to learn market direction, swing and bottom trading.
• I ask that everyone respect opinions on the board whether you agree with them or not. We are all here to make money and avoid the
minimum loss we can.
Rules of the Board
Most of this board's WATCHERS are "lurkers" who appreciate info available without the need to sift through tons of "empty" posts.
1. Respect everyone opinions on trades.
2. No Pumping of Stocks.
3. No OTCBB or PINK STOCKS
*********************************************************************************************************
To help us evaluate our performance, please "BoardMark" the board if you find it useful.
To do so, just click on "Add to Favorites" Button at Right just above the Posts Dates.
 Presently, the Board has 178 Boardmarks, Thank you!
*Information Posted on this Board is not Meant to Suggest any Specific Action, But to Point Out the Technical Signs That Can Help Our Readers Make Their Own Specific Decisions. Your Due Deligence is a Must.
EXCHANGE TRADED FUNDS~ETFs COMPONENTS~RSI and I/V charts#msg-5495097 COMPONENTSFOR ^NDX / QQQQ ~ I/V charts #msg-9787995
Gold~ Silver~ HUI~ XAU~ US$~ €uro~ Crude #msg-29347660 (thanks,bob)
Cookies/Bandwidth/Security/Privacy #msg-9353921 PIEs/Cookies/Macromedia/Flash #msg-9412363 PerformanceTips for WinXP #msg-9854670
| Volume | |
| Day Range: | |
| Bid Price | |
| Ask Price | |
| Last Trade Time: |


