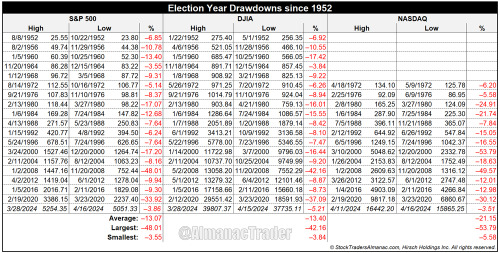
Election Year Drawdowns Happen – S&P 500 Average Pullback 13% since 1952 By: Almanac Trader | April 17, 2024
After five straight months of gains and numerous new all-time highs, recent weakness and the corresponding spike in volatility seem unfamiliar. Despite lingering inflation and escalating geopolitical tensions, S&P 500 was down 3.86% from its closing all-time high of 5254.35 on March 28 through its close on April 16. This is well below the average historical largest drawdown during an election year since 1952 of 13.07%. Were it not for steep declines in 2020 and 2008, election years have tended to enjoy relatively modest drawdowns. Of the last 18 election years, 11 experienced single-digit drawdowns. The smallest was just 3.55% in 1964. DJIA’s record is similar to S&P 500 while the higher beta stocks of the NASDAQ Comp have experienced larger election year drawdowns.
Information posted to this board is not meant to suggest any specific action, but to point out the technical signs that can help our readers make their own specific decisions. Caveat emptor! • DiscoverGold
Register for free to join our community of investors and share your ideas. You will also get access to streaming quotes, interactive charts, trades, portfolio, live options flow and more tools.


 News
News  Market Data
  Discover