CoT: Peek Into Future Through Futures, How Hedge Funds Are Positioned By: Hedgopia | April 20, 2024
• Following futures positions of non-commercials are as of April 16, 2024.
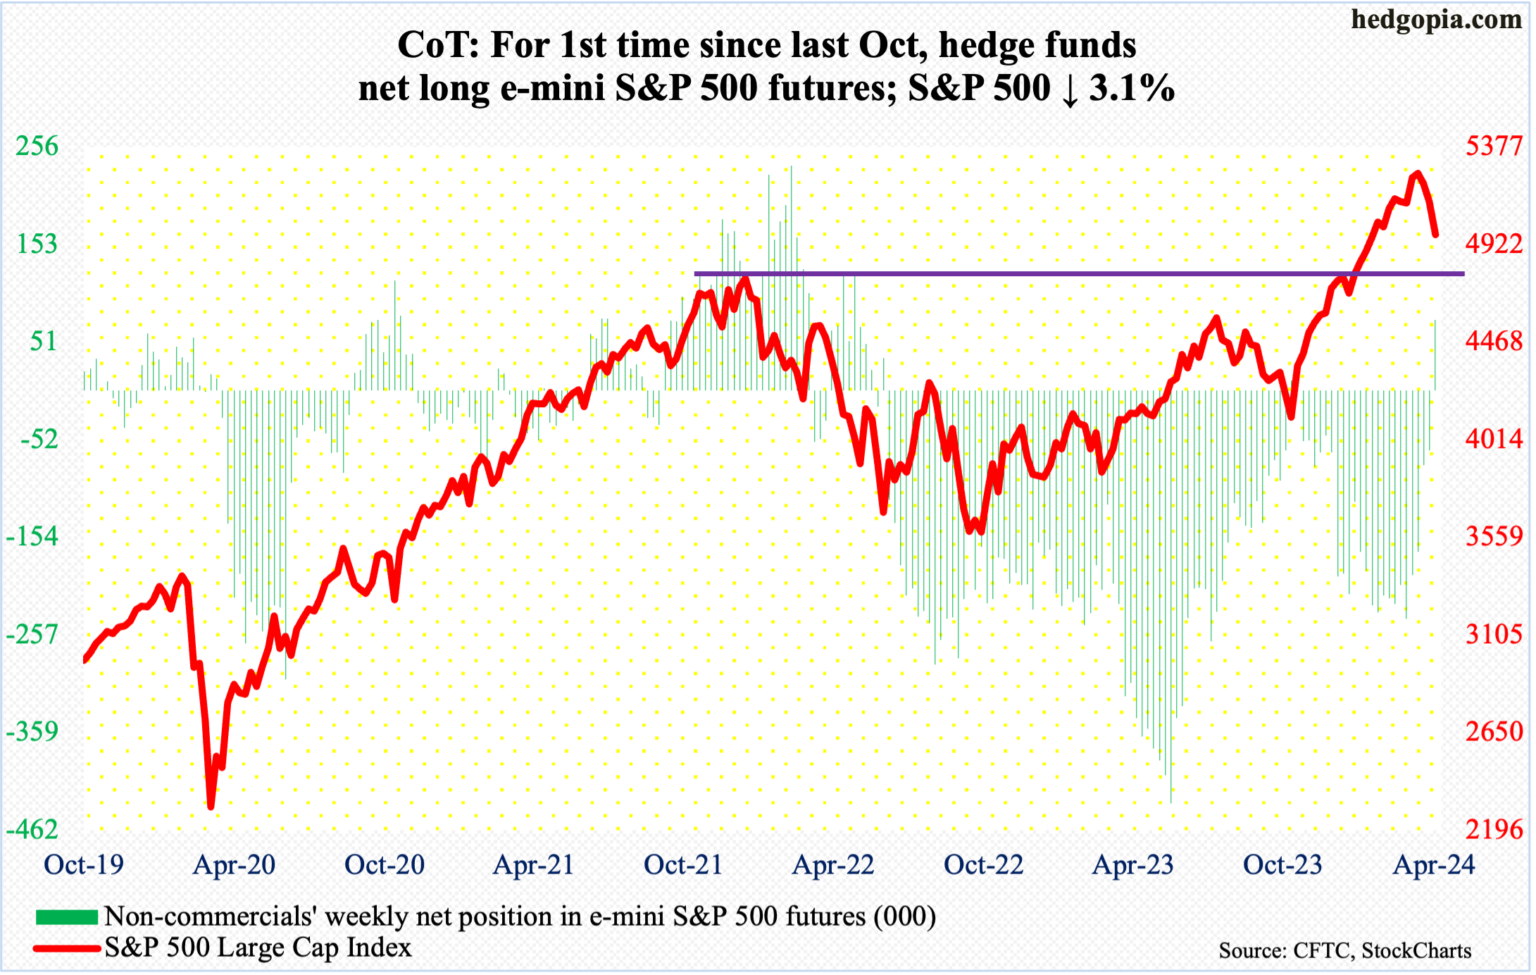
E-mini S&P 500: Currently net long 74.1k, up 137k.
Non-commercials just switched to net long e-mini S&P 500 futures. They have not done so since last October when they were net long for only a couple of weeks; before that, they have not been net long since June 2022.
This is coming at a time when the cash is under pressure after having failed to bust out of 5260s in late March/early April. The S&P 500 peaked at 5265 on March 28th. This week, it shed 3.1 percent to 4967. After dropping for three weeks in a row, the large cap index is down 5.7 percent from last month’s high, which is nothing in the big scheme of things. From last October’s low, the index jumped 28.3 percent before weakening.
The daily is beginning to get oversold. If the weekly wins out, however, selling pressure can continue. In January, the S&P 500 surpassed its prior high of 4819 from January 2022. A breakout retest is just a matter of time. Should it take place right away, it is three percent away.
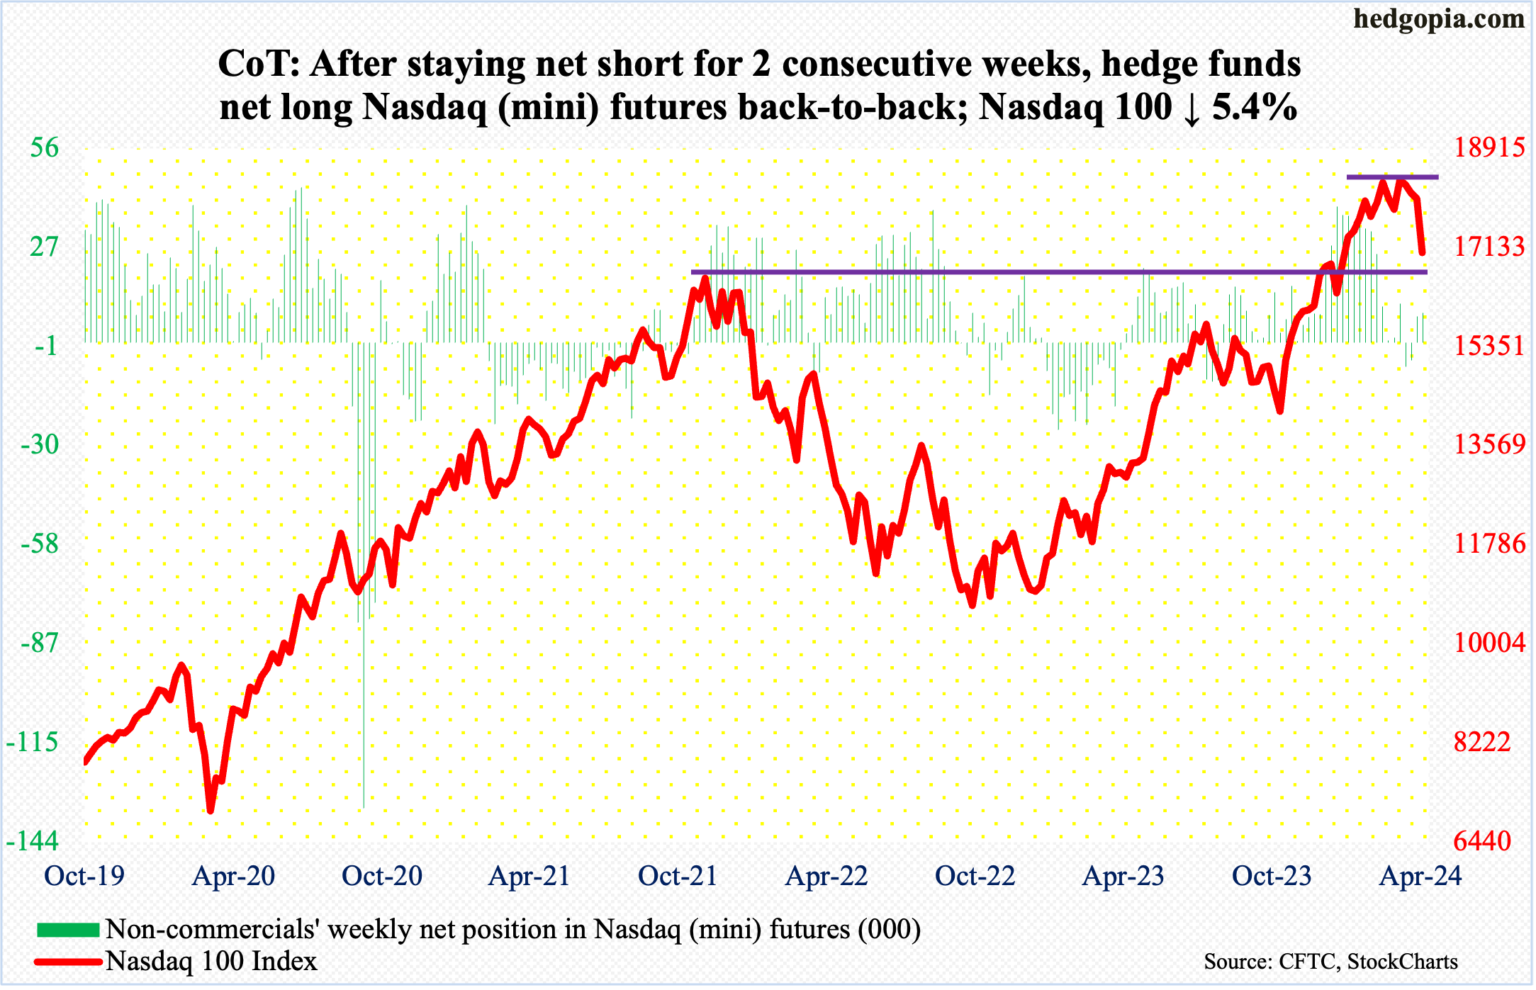
Nasdaq (mini): Currently net long 8.5k, up 986.
Last December, the Nasdaq 100 pushed through its prior high from November 2021. That 16765 breakout is being tested, as the tech-heavy index tagged 16964 intraday Friday. Earlier on March 21st the index posted a new intraday high of 18465.
After failing to sustainably break out of 18300s for seven weeks, the Nasdaq 100 crumbled this week, down 5.4 percent to 17038, with the week beginning with Monday’s breach of the 50-day. This preceded a breach a couple of weeks ago of a rising trend line from last October’s low.
The sector is behaving this way ahead of March-quarter results from US tech bigwigs in the next couple of weeks. Tesla (TSLA) reports next Tuesday, Microsoft (MSFT) and Google owner Alphabet (GOOG) on Thursday and Facebook owner Meta (META) on Wednesday. Apple (AAPL) and Amazon (AMZN) report the week after.
In the event of a rally, bulls need to recapture 17300s. A lack thereof exposes the index to a drop toward the 200-day (16267). The 50-day (17972) has been compromised.
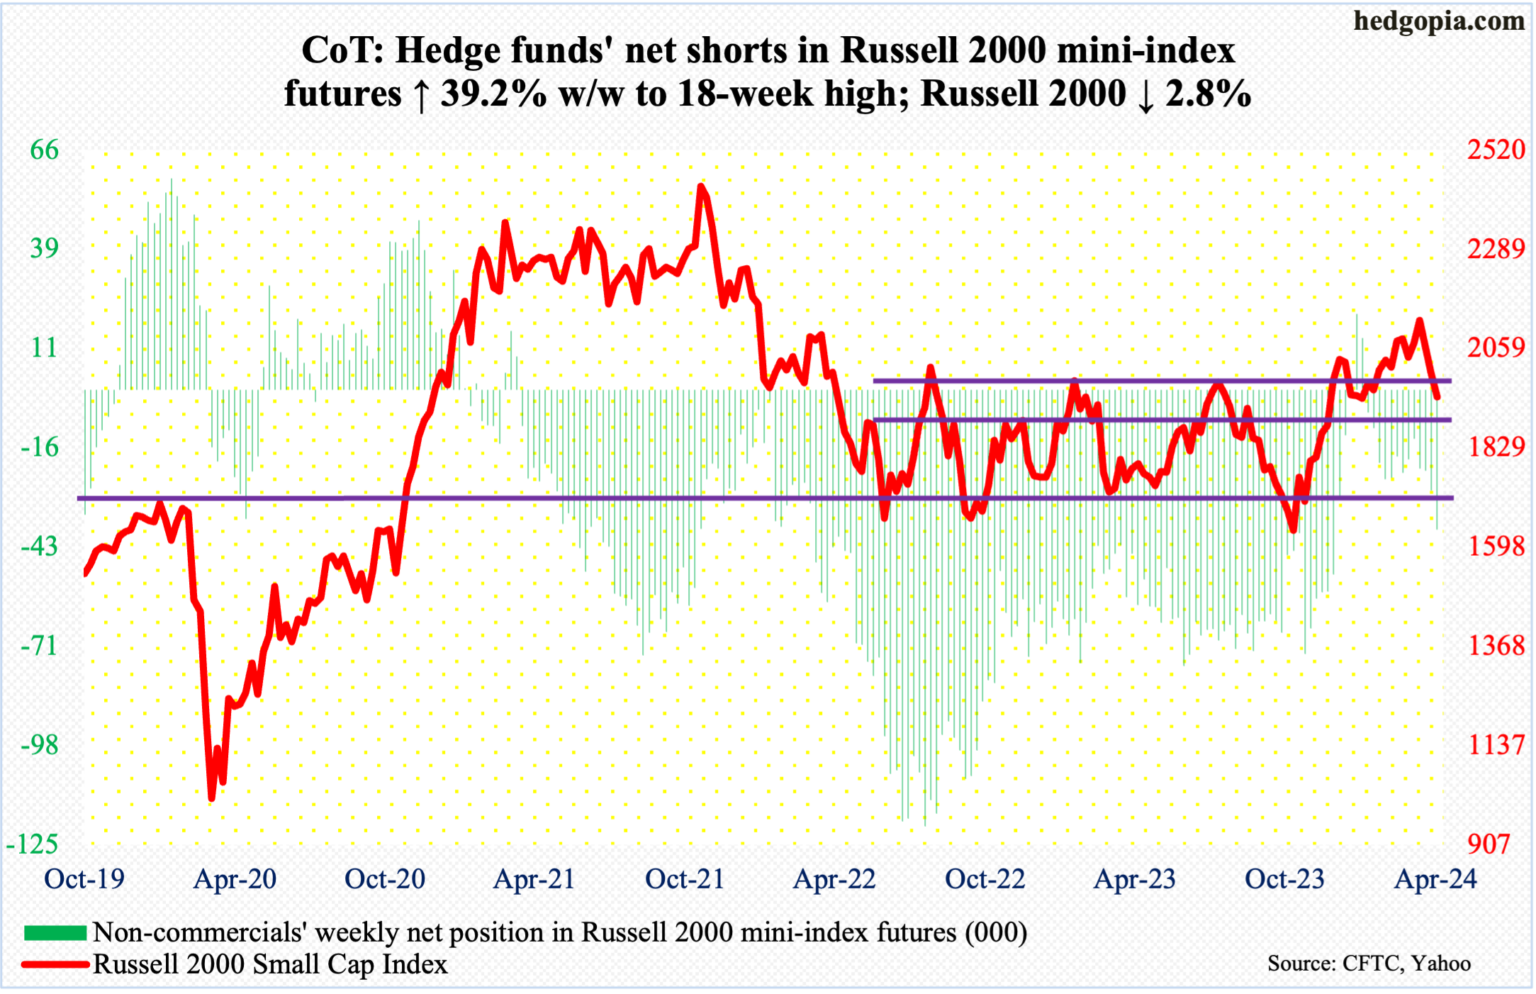
Russell 2000 mini-index: Currently net short 38.5k, up 10.8k.
Last week, the Russell 2000 closed at 2003. Small-cap bulls, having failed to convincingly break out of 2100, were forced to defend 2000 and they failed. This week, the small cap index declined 2.8 percent to 1948. Ironically, this can be spun as good news by both bulls and bears. For the bulls, bids showed up Friday at 1932. For the bears, breakout retest at 1900 is still possible. On December 13th, the index broke out of a 1700-1900 range in place since January 2022.
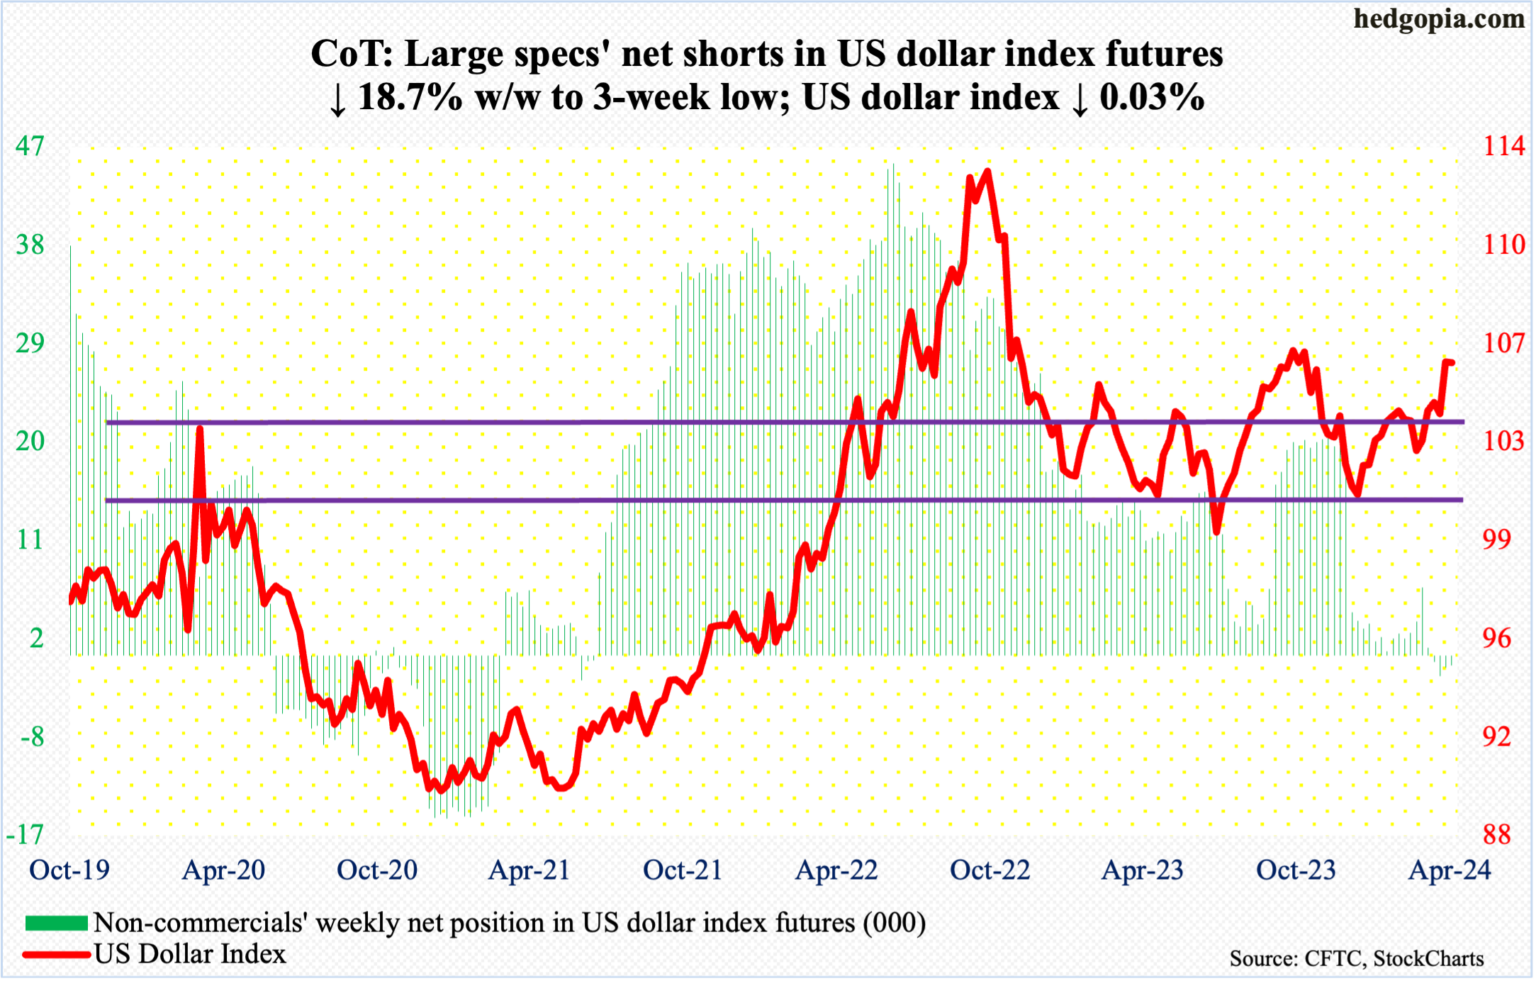
US Dollar Index: Currently net short 929, down 213.
Dollar bulls tried to build on last week’s 1.9-percent jump in the US dollar index but did not quite pull it off. On Tuesday, the index tagged 106.33, but only to end the week at 105.98, down 0.03 percent.
This week’s action follows last week’s emphatic takeout of 103-104, which goes back to December 2016.
The bulls would still love to test 107, which between early October and early November last year rejected rally attempts several times.
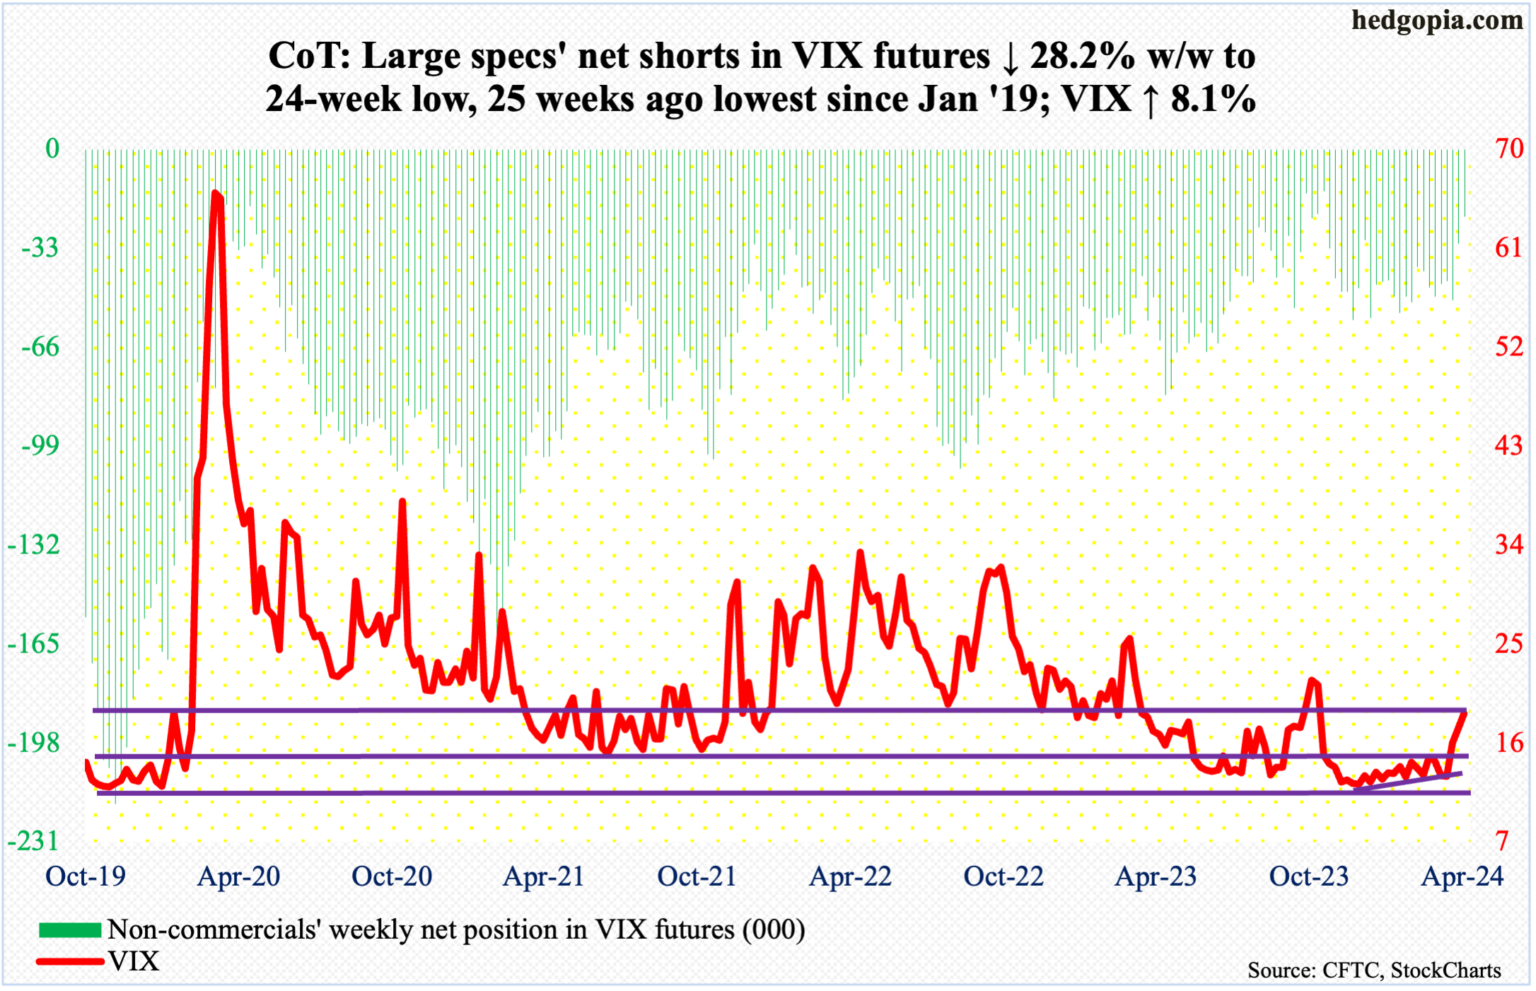
VIX: Currently net short 22.5k, down 8.8k.
For the second week in a row, VIX rallied nicely but also ended with a weekly candle with a long upper shadow. Intraday Friday, the volatility index rallied as high as 21.36 but reversed to close at 18.71 – this in a session in which the S&P 500 dropped 0.9 percent, closing near the session low. Friday’s high was the highest since last October when VIX peaked at 23.08.
Concurrently, in the futures market, non-commercials are now only net short 22,474 contracts. Again, in the week to October 31st (last year), they cut their holdings to 13,979 before accumulating again. Historically, VIX has tended to peak as these traders go net long or get close to doing that.
Information posted to this board is not meant to suggest any specific action, but to point out the technical signs that can help our readers make their own specific decisions. Caveat emptor! • DiscoverGold
Register for free to join our community of investors and share your ideas. You will also get access to streaming quotes, interactive charts, trades, portfolio, live options flow and more tools.


 News
News  Market Data
  Discover