Did the S&P 500 Put in a Multi-year Top? By: Dr. Arnout Ter Schure | April 18, 2024
• By Breaking below $5056, the S&P 500 index has signaled it is ready for a larger correction to at least $4600+/-100, possibly it has struck a multi-year top.
Warning Levels Are There For A Reason
In our update from early March, we anticipated using the Elliott Wave Principle (EWP)
“…. However, if, like last, the index breaks higher because the bears fail to break below critical levels and reach the next target zone of ~$5260, support will be moved up to $5150.”
In our last update from early April, we then concluded that
“… a breakout above last week’s high can ideally target $5390, contingent on holding above the colored warning levels, but ultimately, we still need to see a break below $5056 with a severe warning below $5100 to confirm a significant top has been struck.”
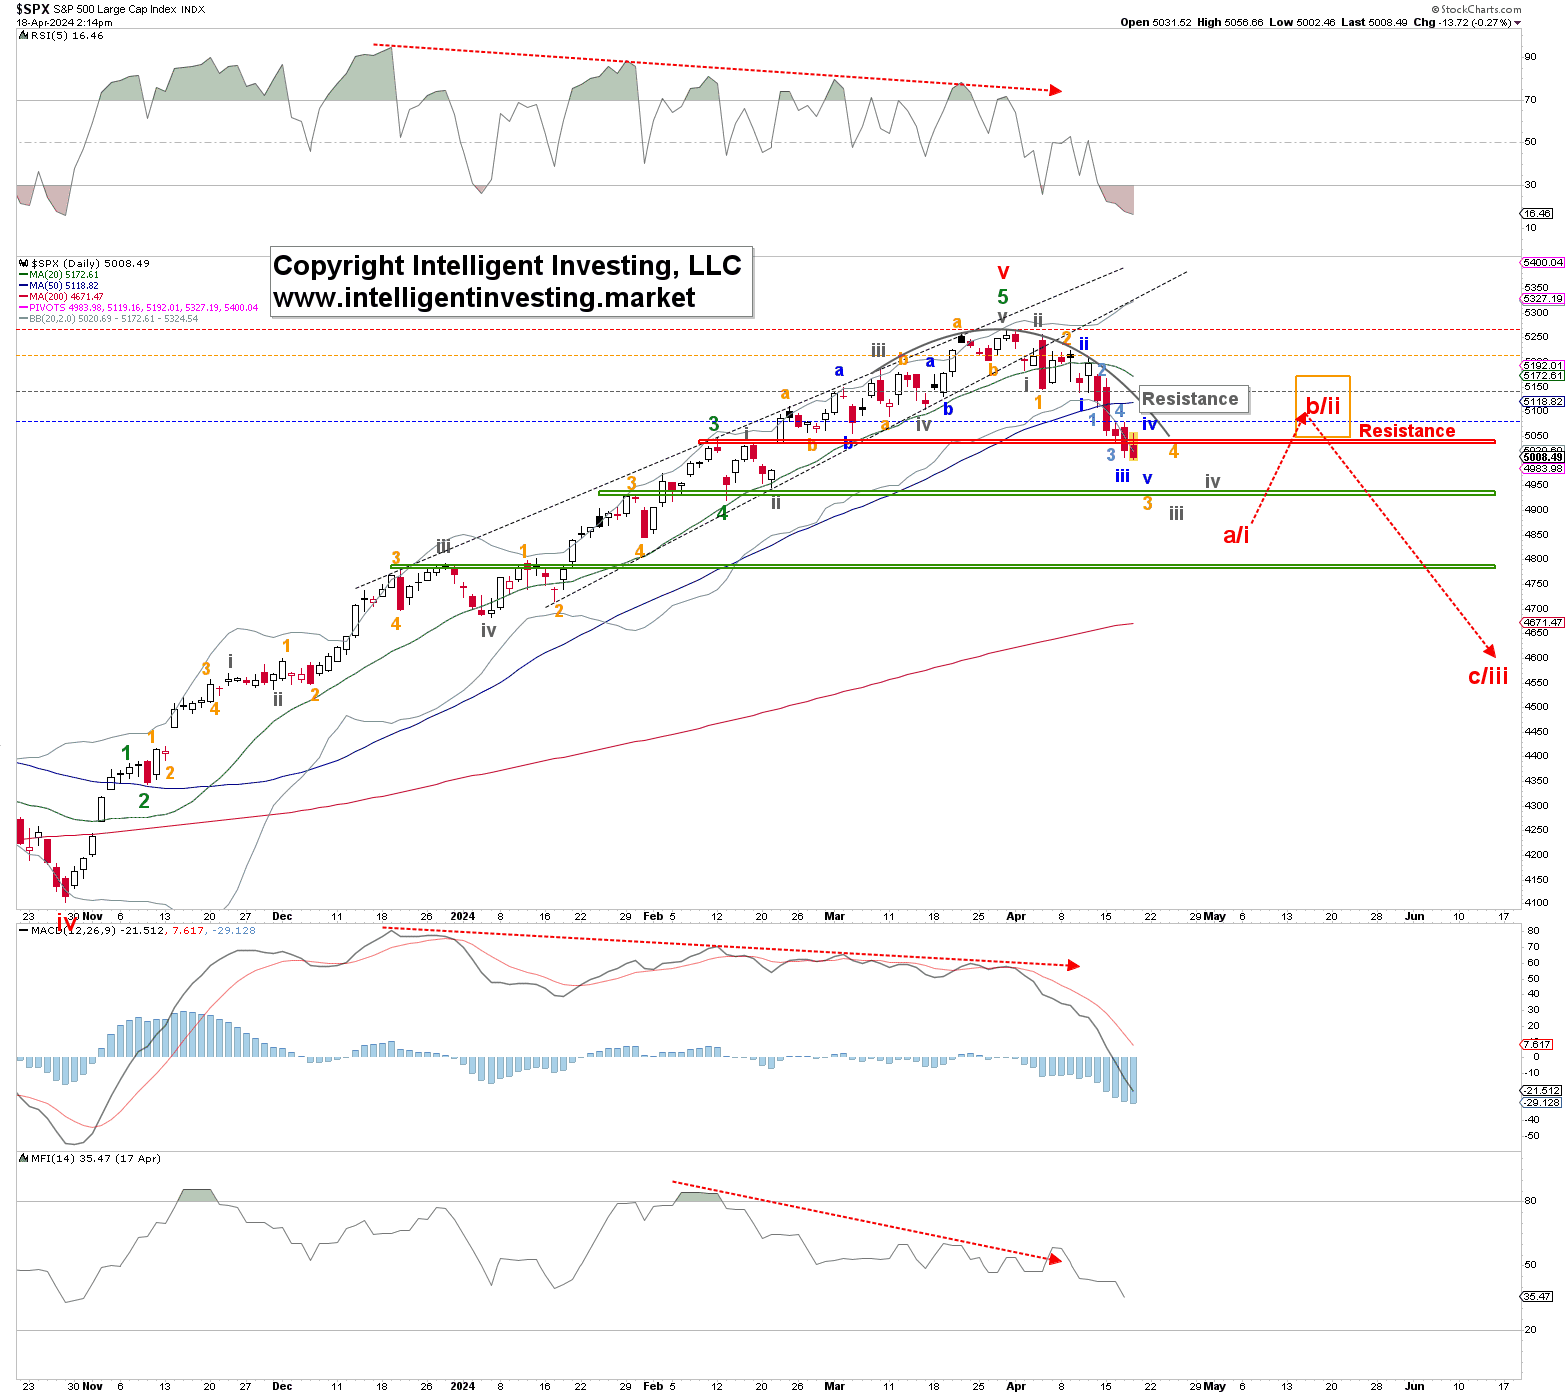
Fast forward, the index could not break above the March 28, $5264 peak; instead, it broke below the warning levels ($5100 and $5056) this week. Thus, our call for a top in the ~$5260 target zone and that we would only see higher prices contingent on holding above critical downside levels was correct. As such, we are now tracking a potential five-wave move, i.e., an impulse, lower to ideally around $4800 for red W-a/i before we see a more significant bounce (red W-b/ii) develop—contingent on the index holding below the colored warning levels for the Bears. See Figure 1 below.
Figure 1. Daily SPX chart with detailed EWP count and technical indicators
How Significant Is This Top?
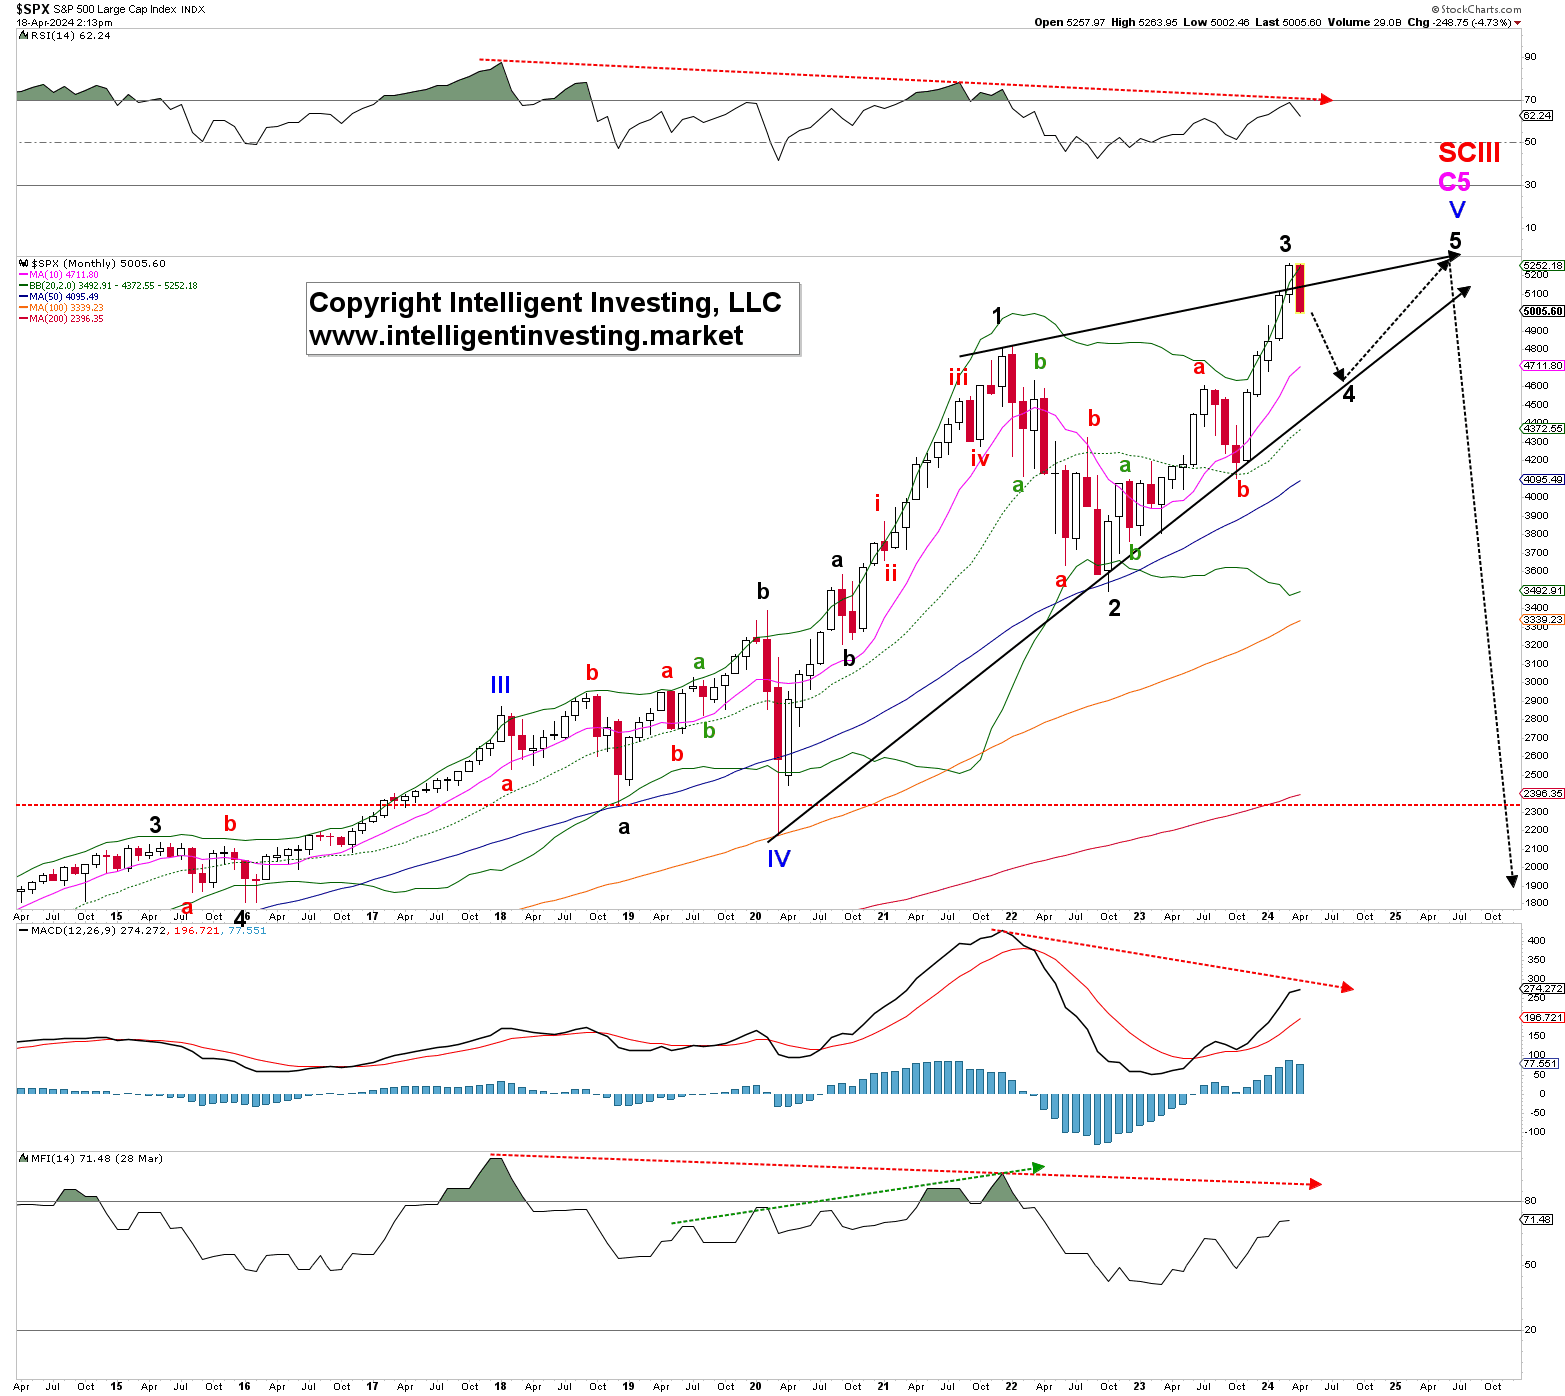
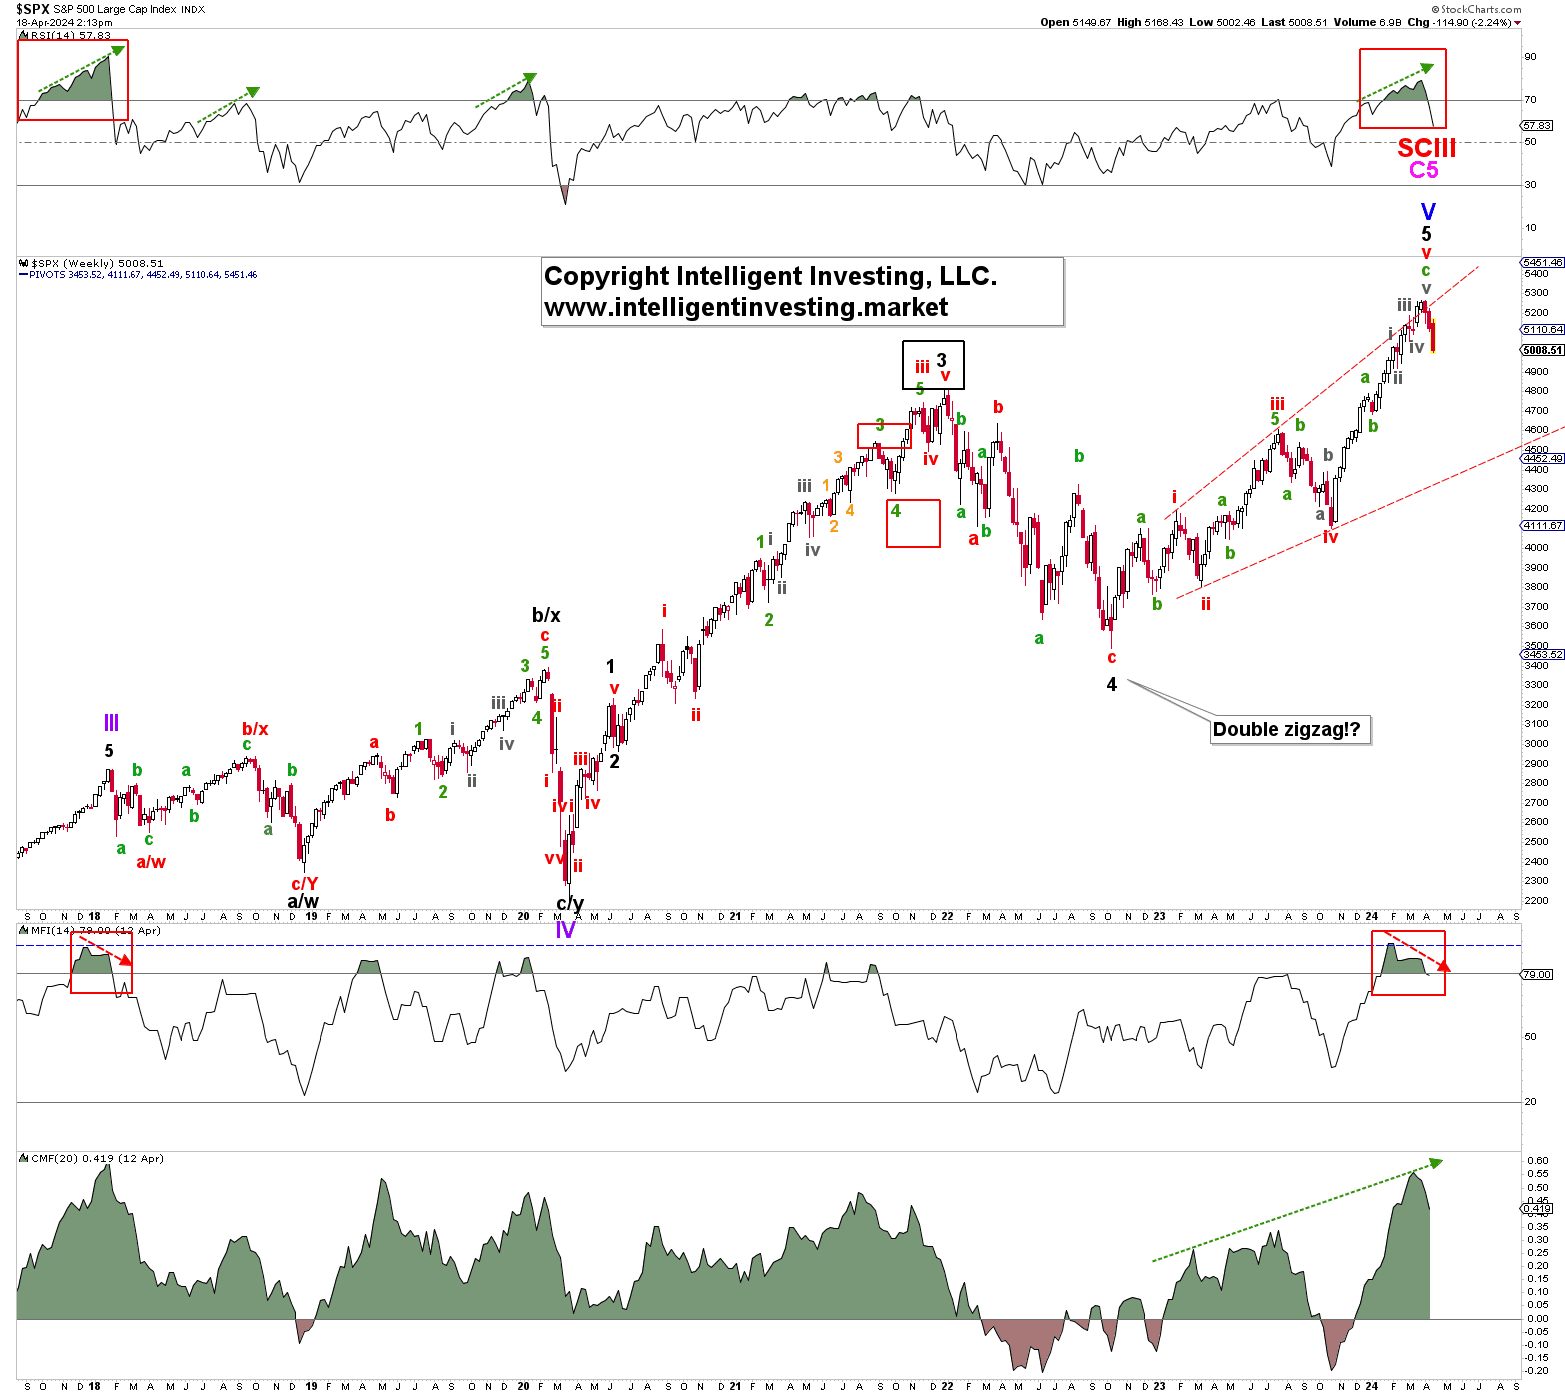
The “significant top” we mentioned is shown in Figures 2 and 3 below. Namely, either the index can complete a large ending diagonal from the March 2020 low (Figure 2) or the index has completed the Bull run that started in 1933 after the 1929 market crash (Figure 3).
Figure 2 Monthly SPX chart with detailed EWP count and technical indicators
The former means that the SP500 will bottom around $4600 for the black W-4 and then rally one last time to $5800+/-200 for the black W-5. The latter means the index has entered a multi-year bear market, which can last a decade and ultimately bring the price back to ~$1500.
Figure 3. Weekly SPX chart with detailed EWP count and technical indicators
Although the current technical indicator (TI) set up for the weekly chart is like late 2017—see the red boxes in Figure 3 above—suggesting that we could see higher prices afterward akin to 2018, the monthly TIs are heavily negatively diverging—see the red dotted arrows in Figure 2 above—suggesting that any upside will be short-lived and minimal.
Thus, we cannot yet discern between the two bigger-picture options at this stage, but if we see an impulse develop to the downside, as shown in Figure 1, the odds will favor the most bearish scenario.
Information posted to this board is not meant to suggest any specific action, but to point out the technical signs that can help our readers make their own specific decisions. Caveat emptor! • DiscoverGold
Register for free to join our community of investors and share your ideas. You will also get access to streaming quotes, interactive charts, trades, portfolio, live options flow and more tools.


 News
News  Market Data
  Discover