 News
News  Market Data
  Discover
Support: 888-992-3836
Copyright © 2023 InvestorsHub Inc.


Register for free to join our community of investors and share your ideas. You will also get access to streaming quotes, interactive charts, trades, portfolio, live options flow and more tools.
The S&P 500 $SPY suffered a bearish engulfing candle at a new high
By: Jason Goepfert | May 23, 2024
• The S&P 500 $SPY suffered a bearish engulfing candle at a new high.
Even worse (on a chart), it gapped to a new high then closed at a 5-day low.
If you sold based on these patterns any other time, you'd be a loser pretty much every time.


Read Full Story »»»
 DiscoverGold
The 10 Top/Bottom S&P 500 Index percent net change performers
By: Thom Hartle | May 24, 2024
• Today (8:34 CST), the 10 top/bottom percent net change performers in the S&P 500 Index.

Read Full Story »»»
DiscoverGold
$SPX $SPY - 1st Target Hit...
By: Sahara | May 23, 2024
• $SPX $SPY - 1st Target Hit...

Read Full Story »»»
DiscoverGold
Market Strength Fading Post Memorial Day
By: Almanac Trader | May 23, 2024

The week after Memorial Day performed quite well from 1971 to 1995. DJIA & S&P 500 up 68% of the time, averaging 0.8% – DJIA up 12 in a row 1984-95. NASDAQ was up 72% of the time, average 0.6%, up 10 straight 1986-95. Since 1979 Russell 2000 was up 88.2% of the time, average 0.9%, up 13 straight 1983-95.

Starting in 1996 the week after Memorial Day performance diminished. DJIA was up only 42.9% of times, average +0.05%, down 9 of last 14. S&P 500, NASDAQ and Russell 2000 all gained ground less than 58% of the time. Monstrous NASDAQ and Russell 2000 gains during the week in 2000 do skew the averages.

Read Full Story »»»
DiscoverGold
S&P 500: Is the Bull Unstoppable?
By: Dr. Arnout Ter Schure | May 23, 2024
• We prefer to view the current rally from the April low as an irregular counter-trend move, which should resolve lower to ideally $4850+/-100.
Why Do Five Waves Lower Matter?
Due to recent travels, we have not been able to keep you abreast as much as we would have liked since our last update from mid-April on the S&P 500 (SPX), see here, where we were tracking using the Elliott Wave Principle (EWP) primarily
“a potential five-wave move, i.e., an impulse, lower to ideally around $4800 for red W-a/i before we see a more significant bounce (red W-b/ii) develop—contingent on the index holding below the colored warning levels for the Bears.”
Namely, an impulse (five waves) lower from the March high would have either targeted $4600 before the next larger rally could ensue or signal the end of the Bull that started in 1932. But instead, we only got three green waves a-b-c lower into the April 19 low of $4943. See Figure 1 below.

Figure 1. Daily SPX chart with detailed EWP count and technical indicators
The B-wave Often Does the Trick When the Third Wave Fails
Since the red W-a counted best as three waves lower, we knew that “after three waves down, expect at least three waves back up” because either the correction became protracted/complex (triangle or flat) or it ended with those three waves lower (zigzag). Moreover, we can neither know beforehand if the red W-b will be regular (<100% of W-a) or irregular (>100%). In this case, it became irregular. But, as you may recall, in early April, see here, we wondered if the index could reach as high as $5390. Instead, it had already peaked in late March at $5265. The B-wave often does the trick when the third wave fails to reach its upside target.
In this case, the rally from the April low to today’s all-time high at $5342 counts still best as three green waves a-b-c up and get the index much closer to that $5390 target. Now we need to see if price can break below the colored warning levels. Namely, the colored dotted lines in each chart indicate the warning levels for the Bulls or Bears if the chart shows a Bullish or Bearish EWP, respectively. Blue indicates the first warning, grey indicates the second warning, orange indicates the third warning, and red indicates the count is invalidated or complete.
Since the index is not even below the blue dotted line, we have no indication that the top has been struck. However, we can count nine smaller waves from the green W-b low, which complete an impulse as they travel in 5, 9, or 13 waves. But without breaking below these warning levels, nine can always become 13. So, we must wait for price to confirm and then trade accordingly. There is no front running.
Lastly, the chart also has the potential green W-4? and W-5? labels because we cannot know yet if the rally from the April low will become an impulse. That, in turn, will shift the black W-3 top forward as well. But, for now, we prefer the irregular red W-b scenario, which will be confirmed below the green W-b/2 low. The Bulls will already get a severe warning on a drop below the green W-a/1 high, the orange warning level. We will then look for the red W-c to complete around $4850+/-100.
Read Full Story »»»
DiscoverGold
Money managers Increased their exposure to the US Equity markets since last week...
DiscoverGold
NAAIM Exposure Index
May 23, 2024 
The NAAIM Number
94.45
Last Quarter Average
84.57
»»» Read More…
$QQQ $1.5 Million OTM Call (Highly Unusual)
By: Cheddar Flow | May 23, 2024
• $QQQ $1.5M OTM Call (Highly Unusual)
This print was bought to open (Vol > OI) and has a near-term expiration
*Above the Ask*

Read Full Story »»»
DiscoverGold
$SPX - Tapped the red-box. See if we ca trigger the red targets...
By: Sahara | May 23, 2024
• $SPX - Tapped the red-box.
See if we ca trigger the red targets...

Read Full Story »»»
DiscoverGold
The 10 Top/Bottom NASDAQ 100 Index percent net change performers
By: Thom Hartle | May 23, 2024
• Today (8:34 CST), the 10 top/bottom percent net change performers in the NASDAQ 100 Index.

Read Full Story »»»
DiscoverGold
S&P 500 Index Reurns - When up 10% YTD on this day (like '24 will likely be)? Rest of yr up a median 10%, avg 8.8% and higher 85% of time. Much better than the avg year.
By: Ryan Detrick | May 23, 2024
• Want some more vibes?
Tomorrow is the 100th trading day of '24.
When up 10% YTD on this day (like '24 will likely be)?
Rest of yr up a median 10%, avg 8.8% and higher 85% of time. Much better than the avg year.
Past 9 times? 8 saw double digit gains.

Read Full Story »»»
DiscoverGold
The AAII Investor Sentiment
By: AAII | May 23, 2024
Bullish 47.0%
Neutral 26.6%
Bearish 26.3%
• Historical 1-Year High
Bullish: 52.9%
Neutral: 36.4%
Bearish: 50.3%
Read Full Story »»»
DiscoverGold
Markets Monthly Pattern »» Watchlist - Top 10
By: Marty Armstrong | May 23, 2024
• Dow Jones Industrials Index »» New Pattern Forming
• NASDAQ Composite Index »» Turning Back UP
• NASDAQ 100 Index »» Still BULLISH
• S&P 500 Index »» Turning Back UP
• Russell 2000 Index »» New Pattern Forming
• US Dollar Index »» Temp Pause
• CBOE VIX Index »» Possible Temp Low
• NY Gold Futures »» Pressing Higher
• NY Silver COMEX Futures »» Reaction High
• NY Crude Oil Futures »» Turning BACK DOWN
DiscoverGold
S&P 500 $SPX is expensive on 19 of 20 metrics according to Bank of America
By: Barchart | May 22, 2024
• S&P 500 $SPX is expensive on 19 of 20 metrics according to Bank of America.

Read Full Story »»»
DiscoverGold
$SPY $1.2 BILLION worth of singular Dark Pool prints 8 minutes after the close
By: Cheddar Flow | May 22, 2024
• $SPY $1.2 BILLION worth of singular Dark Pool prints 8 minutes after the close
This is a very significant amount of premium (not the same as signature prints)

Read Full Story »»»
DiscoverGold
The Anatomy of Forecasting the NASDAQ100’s Counter Trend Rally
By: Dr. Arnout Ter Schure | May 22, 2024
• The NDX has traveled past our ideal target zone of $17900-18250 and stopped following average seasonality. However, it appears that it is close to topping out soon.
60% of the Time, It Works All the Time
Due to recent travels, we have not been able to keep you abreast as much as we would have liked since our update from late April (see here), where we found for the NASDA100 (NDX) using primarily the Elliott Wave Principle (EWP)
“The current rally off the recent low counts best as a counter-trend rally [to ideally $17900-18250] and, together with seasonality, suggests the next leg lower to ideally $15900+/-500, is underway, contingent on holding below the warning levels for the Bears outlined in this article.”
Well, as they say, ”60% of the time, it works all the time” [Anchor Man], and the market stopped following the average seasonal path. Moreover, the index is now trading at around $18710. So, let’s review how we have forecasted the NDX over the past month to understand better how the EWP works, how our forecasting works, and how to apply it.
In April, we had three (grey a-b-c) waves from the red W-a low into the green W-a/1 high (see the chart below). Since the red W-a counted best as three waves lower, we knew that “after three waves down, expect at least three waves back up” because either the correction became protracted/complex (triangle or flat) or it ended with those three waves lower (zigzag). We cannot know beforehand which it will be.

Figure 1. NDX daily chart with detailed EWP count and technical indicators
Waves Can Always Extend
However, with those initial three grey waves up into the April 29, green W-a/1, high, at around the 50-62% retracement (See red target box), the “at least three waves back up” leg appeared most likely completed. Moreover, we got five waves lower just before the FED announcement, as we alerted our premium members intra-day, suggesting the correction would continue after a bounce. Thus, the most probable path was for lower over the intermediate term, contingent on holding below the green W-a/1 level. Also, seasonality supported this thesis.
The market responded to the FED announcement with three waves back up -the expected bounce- and another five waves lower to complete the green W-b as a 5-3-5. Thus, at that stage, it continued to follow our expectations as a W-1, 2, i set up lower, and that is why we preferred lower prices, contingent on holding at least below the FED bounce high. We viewed the “higher prices” as an alternative at that stage, but less probable does not mean impossible, and thus, we are always aware that our POV is “contingent on the market staying -in this case- below a certain price level.”
The market had different intentions than we preferred—no big deal, as that can happen—and signaled a protracted path by breaking above the green W-a/1 high. If one were short, for example, that was the signal to take the loss and turn the ship to a long position. In that case, we initially look for the common c=a relationship (blue arrow). That extension would then also tag the 76.40% retracement of the red W-a, which is a common target for both the red W-b and the green W-c/3.
Just as before, we cannot know beforehand if the green W-c/3 will extend or not, just as we cannot know beforehand if the red W-b will be regular (<100% of W-a) or irregular (>100%). We need to see breakdowns below the warning levels we outline daily to our premium members to know if we will get an extension or if c=a is all she will write. Thus, in this case, there’s no reason to short until the warning levels for the Bulls are broken.
Once again, the market decided to extend, surpassing the next Fib-extension targets of 1.236, 1.382 (not shown), and even 1.618x a (grey arrow). The latter is uncommon. But uncommon does not equal impossible, and uncommon is, of course, even less likely to be known beforehand. Hence, we initially go with the more common c=a and 50-76.4% retracements. With the red W-b = W-a target exceeded, the next target zone is -just as we did for the green W-c- the “1.236 to 1.382x a” extension (orange box).
If the index can stay above at least the blue -1st- warning level, it will be able to reach it, and today we’re getting close. Thus, there was still no reason to short because the indexes never broke below the warning levels. Moreover, the market hasn’t told us it has topped; thus, it can still move higher.
As you can see, once the red W-a was completed, we knew we would get a counter-trend rally (red W-b). We start with a common 50-76.40% retracement. When that target zone is reached in a three-wave fashion, it suggests the counter-trend rally is already over. However, we know counter-trend rallies can always extend like any other move. When that extension announces itself by a break higher, we will look for the next logical Fib-extensions and confluences (100%, 123.6%, 138.2%, etc.).
When the markets fail to break below the warning levels after reaching each extension, c=a, for example, we know the next extension is on tap. We stay comfortably long while raising our stops and preferably taking partial profits until it stops working. That’s how we anticipate the markets, forecast them, and trade them using the EWP and our forecasts. We hope you appreciate this explanation.
Read Full Story »»»
DiscoverGold
The 10 Top/Bottom S&P 500 Index percent net change performers
By: Thom Hartle | May 22, 2024
• Today (8:34 CST), the 10 top/bottom percent net change performers in the S&P 500 Index.

Read Full Story »»»
DiscoverGold
Thursday Historically Most Bullish Day Before Memorial Day
By: Almanac Trader | May 21, 2024

Friday before Memorial Day has become getaway day on The Street and trading can be lackluster with light volume. Dow has been up 12 times in the last 21 years with an average gain of 0.08%. S&P has a modestly better record, with one additional advance and an average gain of 0.16%. NASDAQ has the best record on Friday, up 15 of 21 and averages a respectable 0.38% gain. Russell 2000 has the fewest advances on Friday, but a still solid 0.30% gain.
Based upon average performance Thursday has been the best day before Memorial Day with gains ranging from 0.24% from DJIA to a solid 0.46% by Russell 2000. Frequency of gains is also best on Thursdays, except for NASDAQ. Wednesday has been the softest of the three days with DJIA’s performance turning negative.
Read Full Story »»»
DiscoverGold
$QQQ & $SPY $6+ Million Worth of Unusual Puts
By: Cheddar Flow | May 21, 2024
• $QQQ & $SPY $6M+ Worth of Unusual Puts
These were executed above the ask and follow the recent trend of further-dated put buying on $SPY

Read Full Story »»»
DiscoverGold
Equity Bulls Notch Another Positive Week But Are Probably Not Enthralled By How Thu And Fri Traded
By: Hedgopia | May 21, 2024
Last week brought another positive week for equity bulls, with the major US equity indices rallying for a fourth consecutive week. Amidst this, how the indices traded the last two sessions should give the bears some hope.

Equity bulls used last Wednesday’s softer-than-expected consumer price index for April to break out to new high. The S&P 500 peaked at 5265 on March 28th, having failed to break out of 5260s in three of seven sessions around that high. This quickly led to a 5.9-percent drop through April 19th. From that low, the large cap has now rallied for four straight weeks.
On Wednesday, the index gapped up to convincingly break out of 5260s. Come Thursday, it tagged 5325 intraday to close at 5297; bulls are probably not happy with the mini reversal in a session in which a new record was notched. This was followed by Friday’s dragonfly doji (Chart 1). The action in the last two sessions should embolden the bears, but the candles need confirmation this week.
Should the S&P 500, which remains way overbought on the daily, come under pressure, how a bull-bear duel evolves around 5260s is key.

There is a similar pattern in play on the Nasdaq 100. The index peaked at 18465 on March 21st. Before that, on the 1st that month, it hit 18333 and retreated. After that, 18300s was hit several more times, with the last one occurring on April 11th, before the index fell hard. By April 19th, the Nasdaq 100 declined 8.1 percent from the March high and then went the other way.
Last Thursday, a new intraday high of 18670 was recorded. This was preceded by Wednesday’s break out of 18300s post-CPI; in fact, the intraday low of 18359 was bought hand over fist, ending the session at 18597 (Chart 2). From tech bulls’ perspective, this is all well and good – except that they are probably not too excited how Thursday and Friday behaved.
On Thursday, bulls were unable to latch on to the intraday high, ending the session at 18558, resulting in a shooting star. Come Friday, a potentially bearish hanging man was formed. These candles need confirmation before the bears can say ‘gotcha’ and this should be evident this week.

In the small-cap arena, bulls once again were stopped at 2100, which is increasingly proving significant. In the last three sessions last week, the Russell 2000 pushed through 2100 in each session but only to close lower by the end of week. It closed up 1.7 percent for the week to 2096. The index has struggled to clear 2100 for over two months (Chart 3).
After peaking in November 2021 at 2459, the Russell 2000 bottomed at 1641 in June 2022; this level was subsequently tested in October of both 2022 and 2023. A 61.8-percent Fibonacci retracement of that drop lies at 2144. Further, the index lost 2100 in January 2022 and has since struggled at that price point. Plus, the index was rangebound between 1700 and 1900 going back to January 2022; 2100 in this regard represents a measured-move price target post-breakout at 1900 last December.
The daily is overbought, and last week’s failure to reclaim 2100 raises the odds of a trip back to 2000; worse, breakout retest at 1900 can occur.
The bottom line for equities overall is that the momentum ball remains with the bulls, but the action on Thursday and Friday last week is raising a yellow flag. If they do not put their foot down early this week, momentum – at least near-term – can go the bears’ way.
Read Full Story »»»
DiscoverGold
Another very low volume day in QQQ, which is a sign of trader complacency
By: Tom McClellan | May 20, 2024
• Another very low volume day in QQQ, which is a sign of trader complacency. Low volume days can also be holiday related, so one must have at least a mental filter for that.

Read Full Story »»»
DiscoverGold
S&P 500 - With a reading of 85.67, the US stock market remains overbought, raising concerns among some investors who foresee a possible correction in the near future
By: Isabelnet | May 21, 2024
• S&P 500
With a reading of 85.67, the US stock market remains overbought, raising concerns among some investors who foresee a possible correction in the near future.

Read Full Story »»»
DiscoverGold
$QQQ $2.9 Million OTM Call (Highly Unusual)
By: Cheddar Flow | May 21, 2024
• $QQQ $2.9M OTM Call (Highly Unusual)
This print has a lot of premium, a near-term expiration and is an opening order (Vol > OI)
*Above the Ask*

Read Full Story »»»
DiscoverGold
Extreme Nasdaq Extremes
By: Bespoke Investment Group | May 21, 2024
The VIX may be trading at 52-week lows lately, but the Nasdaq has been nothing short of volatile. Less than a month ago, we all recall when the Nasdaq traded down at ‘extreme’ oversold levels (2+ standard deviations below 50-DMA), trading down over 5% from its prior 52-week high. As swift as the April sell-off was, the rebound was just as rapid, and just last Wednesday, the Nasdaq was back at new highs and at ‘extreme’ overbought levels (2+ standard deviations above 50-DMA). While it took 17 trading days to move from extreme oversold to extreme overbought for the Nasdaq, late last year, the shift was even more rapid when it took just 16 trading days!

Based on recent action, you’d think that these types of rapid shifts between extreme oversold and overbought levels were common, but the last year has been more of an exception than a rule. Since the Nasdaq’s inception in 1971, the current period is just the 15th time it shifted from extreme oversold to extreme overbought levels in 20 trading days or less. In the table below we list each of those prior periods along with the Nasdaq’s performance over the following one, three, six, and twelve months.
Are these types of rapid shifts a good or bad sign for the market? The last occurrence was certainly positive as the Nasdaq rallied more than 12% over the following three months and just under 19% in six months. More broadly, though, forward returns were essentially in line with the index’s average returns for all periods since 1971, especially over the following six and twelve months. Nothing extreme about that!

Read Full Story »»»
DiscoverGold
Markets Monthly Pattern »» Watchlist - Top 10
By: Marty Armstrong | May 21, 2024
• Dow Jones Industrials Index »» New Pattern Forming
• NASDAQ Composite Index »» Still BULLISH
• NASDAQ 100 Index »» Still BULLISH
• S&P 500 Index »» Turning Back UP
• Russell 2000 Index »» New Pattern Forming
• US Dollar Index »» Temp Pause
• CBOE VIX Index »» Turning BACK DOWN
• NY Gold Futures »» Pressing Higher
• NY Silver COMEX Futures »» Pressing Higher
• NY Crude Oil Futures »» Turning BACK DOWN
DiscoverGold
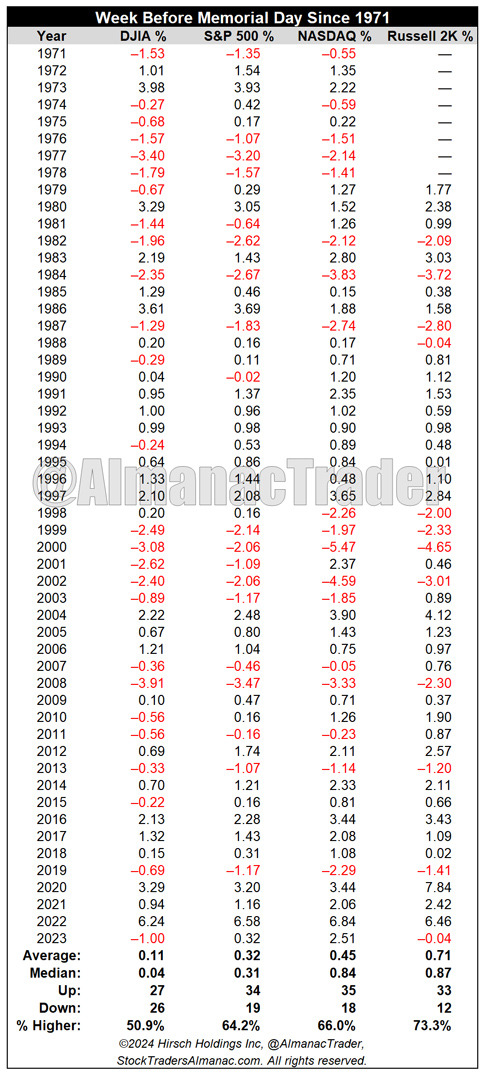
Tech & Small Caps Historically Best Week Before Memorial Day
By: Almanac Trader | May 20, 2024
In the table below we went back to 1971, the year the Uniform Monday Holiday Act took effect, moving Memorial Day and most other federal holidays to Monday. The Friday before Memorial has become getaway day on The Street and volume can be diminished and trading uninspired. However, this has not stopped the market from making some sizable moves during the week. In 2022, DJIA, S&P 500, NASDAQ, and Russell 2000 all jumped over 6%.
DJIA is the weakest in the week before Memorial Day up 27 of the past 53 years and a paltry 0.11% average gain. S&P is a bit better, up 64.2% of the time with an average gain of 0.32%. NASDAQ is up 66.0% of the time, averaging a gain of 0.45% while the Russell 2000 takes the lead ahead of the official kick-off to summer up 73.3% of the time with an average gain of 0.71%. Over the last 20 years, since 2004, all four indexes have been stronger. Russell 2000 and NASDAQ still held the advantage up 80% and 75% of the time respectively. Average performance improved to 1.59% from Russell 2000 and 1.39% from NASDAQ.
Read Full Story »»»
DiscoverGold
$QQQ $4.9 Million OTM Put This order has an unusual amount of premium and a June expiration
By: Cheddar Flow | May 20, 2024
• $QQQ $4.9M OTM Put
This order has an unusual amount of premium and a June expiration
*Above the Ask*

Read Full Story »»»
DiscoverGold
The 10 Top/Bottom S&P 500 Index percent net change performers
By: Thom Hartle | May 20, 2024
• Today (8:35 CST), the 10 top/bottom percent net change performers in the S&P 500 Index.

Read Full Story »»»
DiscoverGold
The 10 Top/Bottom NASDAQ 100 Index percent net change performers
By: Thom Hartle | May 20, 2024
• Today (8:35 CST), the 10 top/bottom percent net change performers in the NASDAQ 100 Index.

Read Full Story »»»
DiscoverGold
VIX closes below 12.00, having been above 20 and first time in 6-months
By: Nautilus Research | May 20, 2024
• #vix $vix VIX closes below 12.00, having been above 20 and first time in 6-months.

Read Full Story »»»
DiscoverGold
Sentiment: At 81.92, the current Market Greed/Fear Index reading indicates significant market greed, reflecting high optimism among market participants
By: Isabelnet | May 20, 2024
• Sentiment
At 81.92, the current Market Greed/Fear Index reading indicates significant market greed, reflecting high optimism among market participants.

Read Full Story »»»
DiscoverGold
Historically, the S&P 500 has consistently rebounded and performed strongly after bear markets. It has consistently delivered positive returns in the first and second year of new bull markets since World War II
By: Isabelnet | May 20, 2024
• Historically, the S&P 500 has consistently rebounded and performed strongly after bear markets. It has consistently delivered positive returns in the first and second year of new bull markets since World War II.

Read Full Story »»»
DiscoverGold
$QQQ now entering a two week window of historical outperformance
By: TrendSpider | May 19, 2024
• $QQQ now entering a two week window of historical outperformance.
If $NVDA earnings are strong, it could be the perfect storm for continuation higher.

Read Full Story »»»
DiscoverGold
CoT: Peek Into Future Through Futures, How Hedge Funds Are Positioned
By: Hedgopia | May 19, 2024
• Following futures positions of non-commercials are as of May 14, 2024.
E-mini S&P 500: Currently net short 25.3k, up 15.6k.

The S&P 500 continued to press higher, up 1.5 percent this week to 5303, having tagged 5325 intraday Thursday. This was the fourth consecutive weekly rise, with the large cap index having bottomed at 4954 on April 19th.
Importantly, equity bulls on Wednesday decisively broke out of 5260s. The S&P 500 peaked on March 28th at 5265. Bears’ small consolation is that how Thursday when the new high was made traded, with the index closing slightly lower with a shooting star. This was followed by Friday’s potentially bearish dragonfly doji/hanging man, but this needs confirmation early next week.
In the event the index comes under pressure, breakout retest at 5260s is key.
Nasdaq (mini): Currently net long 3.2k, down 1.2k.

The Nasdaq 100 peaked at 18465 on March 21st, failing to sustainably break out of 18300s for seven weeks before rolling over; from that high through last month’s low, it swiftly gave back 8.1 percent. All of this loss has now been recovered – and then some.
This week, the tech-heavy index added 2.1 percent to 18546, with a new intraday high of 18670 on Thursday, when the index reversed slightly lower ending with a shooting star. This was followed by Friday’s potentially bearish hanging man. These candles need confirmation early next week.
In the event downward pressure develops in the sessions ahead, 18300s is the one to watch. On Wednesday, when the index rallied strongly post-CPI report for April, intra-session weakness was bought at that level – 18359, to be exact.
Russell 2000 mini-index: Currently net short 32.1k, down 5.9k.

On Wednesday through Friday, the Russell 2000 (2096) rallied north of 2100 in each session intraday but closed the week just shy of that level. For over two months now, the small cap index has failed to decisively clear 2100, which is important.
The index peaked in November 2021 at 2459, subsequently reaching 1641 in June 2022, which was successfully tested in October of both 2022 and 2023. A 61.8-percent Fibonacci retracement of that drop lies at 2144. The index lost 2100 in January 2022 and has since struggled at that price point; 2100 also represents a measured-move price target post-breakout at 1900 last December. Before that, the index went back and forth between 1700 and 1900 going back to January 2022.
Inability to reclaim 2100 opens the door toward 2000 at best and 1900 at worse.
US Dollar Index: Currently net long 2.4k, up 582.

The US dollar index dropped to 103.97 on Thursday, successfully testing a rising trendline from last December when it bottomed at 100.32. It closed the week down 0.8 percent to 104.33. Horizontal support at 103-104 also goes back to December 2016.
A breach of this support is probably just a matter of time. The daily is oversold, and a rally can ensue should dollar bulls succeed in rallying past the 200- and 50-day (104.19 and 104.65 respectively).
VIX: Currently net short 48.1k, up 9.2k.

With a weekly close of 11.99, VIX is dangerously close to a further breakdown. The volatility index has come under pressure since tagging 21.36 on April 19th. This week’s sub-12 close is the first since September 2018.
For the most part, volatility bulls have defended 12 the past six years. As low as the odds are right here and now, it will be yet another victory for equity bulls should 12 gets meaningfully breached.
Read Full Story »»»
DiscoverGold
Consumers are becoming more discerning
By: Raymond James Financial | May 17, 2024
Key Takeaways
• Interest rates and inflation dent consumer confidence
• Consumers are becoming more discerning
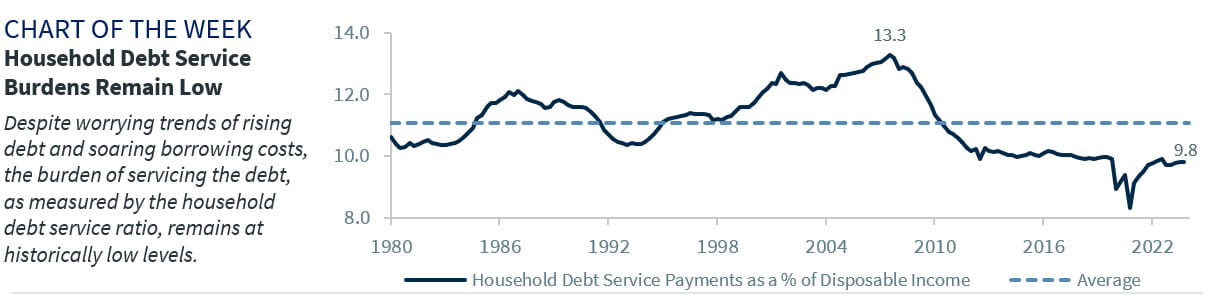
• Household balance sheets remain healthy
As goes the consumer, so goes the U.S. economy. As Wall Street knows, the importance of the consumer cannot be overstated. That’s because consumer spending is the main engine of growth, representing ~70% of US economic activity – nearly 10% more of the economy than it did in the early 1980s. That is why there is so much focus on what the consumer will do next. Thus far, the consumer has been resilient – supported by a strong job market, excess pandemic savings and solid wage gains. However, some cracks have started to surface. Below we discuss a myriad of factors that are impacting the consumer, highlighting the more challenged areas in red, concerning, but not overly problematic areas in yellow, and positive areas in green, along with our view on where the consumer and the economy will go next.
• Consumer confidence is deteriorating | Consumer confidence has deteriorated for the third month in a row as rising interest rates and lingering inflation hit sentiment. The unexpected 10-point plunge in the latest University of Michigan’s consumer sentiment survey—its biggest monthly drop since August 2021 – confirms that optimism is waning. While spending has been resilient despite subdued confidence up to this point, any further weakness will likely cause consumers to pull back spending.
• Rising delinquencies pose a risk | Financially strapped consumers are starting to fall behind on their payments. In fact, a recent NY Fed article cited that nearly 1 in 5 borrowers are now “maxed out” on credit cards and the percentage of balances transitioning into serious delinquency (i.e., 90 days late) has climbed to the highest level since 2011. While this is typically a worrisome sign for an economy powered by consumer spending, the total outstanding debt at some stage of delinquency (~3.3%) is still quite low.
• Record levels of debt, but still manageable servicing costs | Household debt climbed to a record high of $17.7T in 1Q24. Soaring borrowing costs on everything from mortgage rates, credit cards and auto loans have raised concerns that debt servicing costs could explode. But while debt servicing costs have risen, they remain manageable. Case in point: the household debt servicing ratio, a measure of debt-servicing payments as a percentage of disposable income (9.8%) remains well below its long-term average of 11.1%. Key reasons why consumers have been less interest rate sensitive is that 60% do not hold any credit card debt, 75% of homeowners have a 4% or lower mortgage rate (well below the current ~7% rate) and 40% own their home outright.
• Consumers are becoming more cautious | While one of the key themes we heard through 1Q24 earnings season was that consumer spending, in aggregate, remains healthy, there were plenty of warnings that consumers (particularly those on the lower end of the income scale) are starting to pull back on spending. Not only was this confirmed in this week’s softer than expected retail sales report, but this was on full display in this quarter’s company earnings reports. For example, Amazon and Pepsi reported that consumers are beginning to trade down to cheaper options. And with restaurant activity declining for four consecutive months, select restaurants, such as McDonalds and Jack in the Box, have had to roll out more value offerings to lure back customers. This dynamic is expected to persist and should lead to a further moderation in spending in the months ahead.
• Consumer balance sheets are in good shape | Thanks to the surging stock market, rising home values and higher interest rates on savings accounts, household balance sheets are in good shape. In fact, at the end of 4Q23, household net worth (i.e., assets minus liabilities) climbed to a record $156.2T – that’s an increase of 8% from 2022 and a 33% increase since 2019. This wealth effect has been a powerful driver of consumer spending in recent years and a key factor behind the resilience of the economy. And with the S&P 500 hitting 23 new record highs this year, the upper-end consumer will likely benefit and continue to spend, cushioning any weakness from lower-end consumers. Remember, the top 20% of earners drive 40% of total spending.
• Rising real income should support spending | Real wage gains have been another positive trend supporting consumption and propelling the economy forward over the last year. The combination of strong labor markets and a powerful disinflationary trend have been key factors driving real incomes higher over the last 12 months. While there are some concerns this favorable trend may stall as the labor market cools and inflation remains sticky, we expect the trend to continue. In fact, we anticipate disinflation to resume and the labor market to ease but remain solid, with minimal job losses relative to past downturns.
Bottom line |Although pockets of concern have emerged, we are only expecting a modest pullback in consumer spending in the months ahead. The slowdown will most likely be driven by the lower-end consumer, who is more acutely feeling the pain of the Fed’s restrictive policy and lingering impacts from inflation. However, modest job growth, rising real wages and record net worth should keep upper-income consumers spending, cushioning any weakness from financially strapped consumers. This is a key reason why 2024 consensus estimates for growth have climbed from 1.2% at the start of the year to 2.2% today.
Read Full Story »»»
DiscoverGold
S&P 500 Index (SPX) »» Weekly Summary Analysis
By: Marty Armstrong | May 18, 2024
S&P 500 Cash Index closed today at 530327 and is trading up about 11% for the year from last year's settlement of 476983. This price action here in May is reflecting that this is within the scope of a bearish reactionary move on the monthly level thus far. As we stand right now, this market has made a new high exceeding the previous month's high reaching thus far 532549 intraday and is still trading above that high of 526395.
ECONOMIC CONFIDENCE MODEL CORRELATION
Here in S&P 500 Cash Index, we do find that this particular market has correlated with our Economic Confidence Model in the past. The Last turning point on the ECM cycle low to line up with this market was 2009 and 2002. The Last turning point on the ECM cycle high to line up with this market was 2022 and 2007 and 2000.
MARKET OVERVIEW
NEAR-TERM OUTLOOK
The S&P 500 Cash Index has continued to make new historical highs over the course of the rally from 1974 moving into 2024. Noticeably, we have elected two Bullish Reversals to date.
This market remains in a positive position on the weekly to yearly levels of our indicating models. Pay attention to the Monthly level for any serious change in long-term trend ahead.
Focusing on our perspective using the indicating ranges on the Daily level in the S&P 500 Cash Index, this market remains in a bullish position at this time with the underlying support beginning at 523726.
On the weekly level, the last important high was established the week of May 13th at 532549, which was up 29 weeks from the low made back during the week of October 23rd. So far, this week is trading within last week's range of 532549 to 521116. Nevertheless, the market is still trading upward more toward resistance than support. A closing beneath last week's low would be a technical signal for a correction to retest support.
When we look deeply into the underlying tone of this immediate market, we see it is currently still in a weak posture. This market has made a new historical high this past week reaching 532549. Here the market is trading positive gravitating more toward resistance than support. We have technical support lying at 529174 which we are still currently trading above for now.
Right now, the market is above momentum on our weekly models hinting this is still bullish for now as well as trend, long-term trend. Looking at this from a wider perspective, this market has been trading up for the past 4 weeks overall.
INTERMEDIATE-TERM OUTLOOK
YEARLY MOMENTUM MODEL INDICATOR
Our Momentum Models are rising at this time with the previous low made 2022 while the last high formed on 2023. However, this market has rallied in price with the last cyclical high formed on 2022 warning that this market remains strong at this time on a correlation perspective as it has moved higher with the Momentum Model.
Looking at the longer-term monthly level, we did see that the market has made a low following the previous high of March at 495356. The fact that the market for April close below the previous month's low is a sign of near-term weakness with a possible decline into the next turning point on the Array. So far here in May this market has held above last month's low reaching 501105. At this time, May has rallied to exceed the previous month's high reaching 532549. This implies we may see a rally into the next turning point on the top line of the Array. So pay close attention.
Critical support still underlies this market at 438504 and a break of that level on a monthly closing basis would warn that a sustainable decline ahead becomes possible. Nevertheless, the market is trading above last month's high showing some strength.
DiscoverGold
Nasdaq Composite Index (COMP) »» Weekly Summary Analysis
By: Marty Armstrong | May 18, 2024
NASDAQ Composite Index Cash closed today at 1668597 and is trading up about 11% for the year from last year's settlement of 1501135. This price action here in May is reflecting that this is within the scope of a bearish reactionary move on the monthly level thus far. As we stand right now, this market has made a new high exceeding the previous month's high reaching thus far 1679783 intraday and is still trading above that high of 1649065.
ECONOMIC CONFIDENCE MODEL CORRELATION
Here in NASDAQ Composite Index Cash, we do find that this particular market has correlated with our Economic Confidence Model in the past. The Last turning point on the ECM cycle low to line up with this market was 2022 and 2009 and 2002. The Last turning point on the ECM cycle high to line up with this market was 2007 and 2000.
MARKET OVERVIEW
NEAR-TERM OUTLOOK
The NASDAQ Composite Index Cash has continued to make new historical highs over the course of the rally from 2009 moving into 2024. Clearly, we have elected four Bullish Reversals to date.
This market remains in a positive position on the weekly to yearly levels of our indicating models. Pay attention to the Monthly level for any serious change in long-term trend ahead.
The perspective using the indicating ranges on the Daily level in the NASDAQ Composite Index Cash, this market remains in a bullish position at this time with the underlying support beginning at 1640705.
On the weekly level, the last important high was established the week of May 13th at 1679783, which was up 29 weeks from the low made back during the week of October 23rd. So far, this week is trading within last week's range of 1679783 to 1633486. Nevertheless, the market is still trading upward more toward resistance than support. A closing beneath last week's low would be a technical signal for a correction to retest support.
When we look deeply into the underlying tone of this immediate market, we see it is currently still in a weak posture. This market has made a new historical high this past week reaching 1679783. Here the market is trading positive gravitating more toward resistance than support. We have technical support lying at 1669126 which we are currently trading below implying the market is very weak. This infers that this level will now be resistance. Our Major Channel Support lies at 1418428 and a break of that level would be a bearish indication for this market.
Right now, the market is above momentum on our weekly models hinting this is still bullish for now as well as trend, long-term trend. Looking at this from a wider perspective, this market has been trading up for the past 4 weeks overall.
INTERMEDIATE-TERM OUTLOOK
YEARLY MOMENTUM MODEL INDICATOR
Our Momentum Models are rising at this time with the previous low made 2022 while the last high formed on 2023. However, this market has rallied in price with the last cyclical high formed on 2021 warning that this market remains strong at this time on a correlation perspective as it has moved higher with the Momentum Model.
Looking at the longer-term monthly level, we did see that the market has made a low following the previous high of March at 1522278. The fact that the market for April close below the previous month's low is a sign of near-term weakness with a possible decline into the next turning point on the Array. So far here in May this market has held above last month's low reaching 1555764. At this time, May has rallied to exceed the previous month's high reaching 1679783. This implies we may see a rally into the next turning point on the top line of the Array. So pay close attention.
Critical support still underlies this market at 1405840 and a break of that level on a monthly closing basis would warn that a sustainable decline ahead becomes possible. Nevertheless, the market is trading above last month's high showing some strength.
DiscoverGold
The One Chart to Watch as S&P 500 Makes New All-Time Highs
By: David Keller | May 17, 2024
As the S&P 500 and Nasdaq 100 have once again made new all-time highs, and the Dow Jones Industrial Average has briefly broken above the 40,000 level for the first time, how should we think about further upside for our equity benchmarks?

There are two general ways to play a chart pushing higher into uncharted territory, pun intended. First, we can use technical tools to identify potential upside objectives, using things like Elliott Wave or Gann or pattern measurements. I tend to avoid this sort of approach, only because I've learned that when something is working, you want to keep it working as long as possible!
Peter Lynch famously compared this approach to growing a garden. If you're selling your winners and doubling down on your losers, it's like pulling your flowers and watering your weeds! To grow a beautiful garden, you want to pull the weeds and water your flowers. So in a portfolio context, that means riding winning stocks higher as long as they continue to help your portfolio.
So the second general approach is to become a trend-follower, tracking the uptrend and looking for signs of any change in that trend. Here's one chart I'm using now to make that general assessment for the S&P 500.

This chart has three series, starting with a high yield index option-adjusted spread from Bank of America. If you're confused by that wordy title, allow me to simplify. Bonds are quoted in terms of a spread above a risk-free rate. So US Treasury bonds are considered a "risk-free investment" because it is highly unlikely that the US government would be unable to pay interest on their debt obligations. Any corporate bond, issued by a particular company, by definition will bear additional risk than a Treasury bond. So a corporate spread of any kind tells you the additional yield you should expect to receive for taking on that additional risk.
Lots of corporate bonds include call options, meaning the bond can be redeemed by the company before maturity. In this case, we're using an "option-adjusted spread", which means you are stripping out those options to compare bonds on more of an apples-to-apples basis. And this spread is based on high-yield or "junk" bonds, meaning the bonds of risky companies with lower credit scores.
So to summarize, we are tracking how much of a spread bond investors are demanding for taking on the risk of junk bonds. I've plotted this series upside down because wider spreads mean additional risk, which usually means bad news for equities. You can see that when spreads are widening (the line is going lower on this chart), that tends to coincide with downtrends for the S&P 500 (bottom panel). Conversely, narrowing spreads tend to coincide with uptrend for the major equity indexes.
High-yield spreads are currently at the lowest levels in years, suggesting that bond investors are expecting a low-risk environment for the foreseeable future. If and when we see spreads start to widen, as they did in early April, that would be a bearish sign for stocks.
The middle series shows the VIX, because markets tend to rise on low volatility and stocks tend to drop with much higher volatility conditions. I've plotted this series upside-down as well, because it makes it easier to compare volatility to the S&P 500 trend. The VIX is also at its lowest levels that we've seen in the last two years, demonstrating what I would describe as a low-volatility environment. If and when the VIX would increase above 15, and especially if it would eclipse the 20 level, that would indicate a much more bearish environment for risk assets like the S&P 500 and Nasdaq 100.
To be clear, this chart is currently quite bullish, with the S&P 500 trending higher along with narrow high-yield spreads and very low volatility. If and when we see a widening of credit spreads, and if and when volatility begins to increase, that could be a great opportunity for equity investors to really question the sustainability of the bull market phase.
Read Full Story »»»
DiscoverGold
The Pending Crash - Short Sweat or into 2026?
By: Marty Armstrong | May 18, 2024
Our two precise targets here in 2024 were 40825.47 and 44300.58. We can see that since the Dow did NOT peak precisely on May 7th, that is the GOOD NEWS. Otherwise, that would have warned of a decline of 4 to 5 years to come, which really did not make sense given the prospects for the combination of war and the Sovereign Debt Crisis.
There is no question that 2024 was a Directional Change and we still see higher volatility into 2025. Yes, one would expect commercial real estate to crash with higher interest rates and the damage done to this sector thanks to the COVID lockdowns...
DiscoverGold $SPY $2.9 Billion worth of sig Dark Pool prints today
By: Cheddar Flow | May 17, 2024
• $SPY $2.9B worth of sig Dark Pool prints today
SPY has been pinned to this price for most of the session

Read Full Story »»»
DiscoverGold
$QQQ Unusual amount of singular Dark Pool prints from earlier today
By: Cheddar Flow | May 17, 2024
• $QQQ Unusual amount of singular Dark Pool prints from earlier today

Read Full Story »»»
DiscoverGold
Is This The Magic Upward Break Everybody Was Waiting For?
By: Julius de Kempenaer | May 17, 2024
• Sector rotation still pointing to defense
• Upward break in SPY not supported by volume
• Asset class rotation` starting to rotate in favor of bonds

No Confirmation In Volume.
This week, the S&P 500 is breaking out above its previous high, undeniably a bullish sign for the market.
After the initial break on Wednesday, the market held up well on Thursday. However, a few things are holding me back from getting overly enthusiastic.
One of the issues is the volume pattern, as can be seen on the above spy chart. The lower pane holds the volume combined with its moving average (the blue line). During the decline from the 525 peak at the end of March all the way down to 494 in the second half of April, the volume rose slightly. So, we had a declining price on rising volume.
The rally out of the low has taken place on declining volumes. The technical rule is that volume should increase in the direction of the trend. So, if we were in a full-fledged uptrend, I would have expected the volume to decline during the move lower and then rise again from 494 to current levels. Also, higher volumes do not accompany the break above resistance, which usually makes upward breaks (more) reliable.
Sector Rotation Not Supportive

The relative rotation graph above shows long and strong tails for defensive sectors. As you know, the traditionally defensive sectors are utilities, consumer staples, and healthcare.
Utilities and staples are inside the improving quadrant and on a strong RRG-Heading toward leading. The healthcare sector is inside the lagging quadrant and has just started to curl back up.
Reading from the JdK RS-Ratio axis, energy is the strongest sector at the moment. Although it is not considered a really defensive sector, it has a low beta compared to other sectors, which is also a defensive characteristic.
On the other hand, we see a really offensive sector like consumer discretionary inside the legging quadrant and moving further into it. Other sectors inside the lagging quadrant are technology and real estate. Both move lower on the JdK RS-ratio scale at a stable negative RS-momentum level.
Other more offensive or cyclical sectors, like materials, industrials, and financials, are inside the leading quadrant. Still, they have rolled over and are now out of the zero to 90-degree RG heading. Overall, this combination of rotations is not what you would expect during a strong rally in a bull market.
A strong rally in the S&P 500 is not in line with this type of sector rotation.
Obviously, there are two ways this situation can be resolved. The first one is that the sector rotation will move to a more offensive trajectory in the coming weeks, matching and catching up with the rally in the S&P 500. The second one is that the S&P 500 gets back in line with a more defensive rotation.
Asset Class Rotation Turning Towards Bonds

Finally, the third observation that makes me cautious is the current state of asset class rotation. as seen in the RRG above.
The tail for SPY is inside the leading quadrant but has been moving lower on the RS momentum scale for a few weeks already, almost crossing over into the weakening quadrant. The tails for fixed-income-related asset classes, government bonds, corporate bonds, and high-yield bonds are inside the improving quadrant, and all are moving at a positive RRG-heading.

Bringing that relationship back to the SPY:IEF chart shows us that this ratio is struggling with the resistance offered by the previous peak, around 5.7.
At the same time, the RSI plotted below the price chart shows a buildup of negative divergence. As you know, this is usually a sign of, at least, a pause or a turn in the existing trend.
A clear reversal of this trend would mean that bonds are taking over the leadership role from stocks. And this usually happens when stocks are moving lower.
All In All
All in All, these three observations make me very cautious regarding the quality of the upside break in the S&P500.
Read Full Story »»»
DiscoverGold
Our Targets on the Dow for 2024
By: Marty Armstrong | May 17, 2024
We have reached our first MID-RANGE target for the Dow in this bull market, and it appears that the vast majority remain totally ignorant of what is truly behind it. For the life of me, I do not understand why people never just look at the trends to see if what they are reporting is valid. I guess it's like polls in California, where people are so brainwashed that they believe men can become pregnant. Here we have the standard explanation of the rally that traders are looking at signs, as reported by Reuters, "of U.S. disinflation resuming and the wider economy cooling all stoked hopes that Federal Reserve interest rate cuts are indeed coming - with annual corporate profit growth and year-to-date stock index gains revving up into double digits." Yet just look, interest rates doubled between 1927 and 1929, and so did the stock market.
Interest rates began to rise when Trump took office. The stock market rallied, and they called it the Trump Rally. They lowered rates thanks to the insane COVID Lockdowns that destroyed the economy and created shortages that produced inflation that the Fed has still been forced to confront...
The plain truth is that where there is that our targets here in 2024 are:
40825.47 and 44300.58
We have to be concerned that a KNEE-JERK Reaction can occur first with the prospect of war. This is the danger as we head into June. Thereafter, as war are the debt crisis merge together, then the shift from PUBLIC to PRIVATE will unfold.
DiscoverGold
$SPX $Millions of Puts
By: Cheddar Flow | May 17, 2024
• $SPX Hello There

Read Full Story »»»
DiscoverGold
Nasdaq 100 breadth rebounds, signaling a more favorable market environment.
By: Dean Christians | May 17, 2024
• Nasdaq 100 breadth rebounds, signaling a more favorable market environment.

Read Full Story »»»
DiscoverGold
The 10 Top/Bottom S&P 500 Index percent net change performers
By: Thom Hartle | May 17, 2024
• Today (8:34 CST), the 10 top/bottom percent net change performers in the S&P 500 Index.

Read Full Story »»»
DiscoverGold
The 10 Top/Bottom NASDAQ 100 Index percent net change performers
By: Thom Hartle | May 17, 2024
• Today (8:34 CST), the 10 top/bottom percent net change performers in the NASDAQ 100 Index.

Read Full Story »»»
DiscoverGold
Earnings season for S&P 500 companies is about 87% complete, and the picture looks pretty healthy
By: SentimenTrader | May 16, 2024
• Earnings season for S&P 500 companies is about 87% complete, and the picture looks pretty healthy.
Reported earnings are on track to grow 10% from Q1 2023; the first back-to-back quarterly increases in a couple of years.
A cruel irony of markets is that what's obvious is often not helpful. It should be obvious that earnings growth is good for stocks. And double-digit growth should be even better.
That hasn't been the case, however.

Read Full Story »»»
DiscoverGold
$SPY $2.5 Million Very Far OTM Put Due to how far OTM it is, the whale is likely hedging an existing position
By: Cheddar Flow | May 16, 2024
• $SPY $2.5M Very Far OTM Put
This contract has seen a jump in volume today
Due to how far OTM it is, the whale is likely hedging an existing position


Read Full Story »»»
DiscoverGold
$SPY Millions worth of ATM Puts just hit the tape were all executed above the ask and have late June + September expirations
By: Cheddar Flow | May 16, 2024
• $SPY Millions worth of ATM Puts just hit the tape
These were all executed above the ask and have late June + September expirations
The flow is still skewed towards further-dated $SPY puts (2-4 months and shorter-dated $SPX calls (1-6 weeks)

Read Full Story »»»
DiscoverGold
Money managers Reduced their exposure to the US Equity markets since last week...
DiscoverGold
NAAIM Exposure Index
May 16, 2024
The NAAIM Number
89.25
Last Quarter Average
87.84
»»» Read More…
|
Followers
|
179
|
Posters
|
|
|
Posts (Today)
|
0
|
Posts (Total)
|
68501
|
|
Created
|
06/10/03
|
Type
|
Free
|
| Moderators DiscoverGold | |||
:::::::::::: Welcome to S&P 500 & Nasdaq Analysis and Trends :::::::::::::
• The purpose of this board is to help others with Short & Long term S&P 500 & Nasdaq analysis and direction.
• This is strickly an educational board helping traders to learn market direction, swing and bottom trading.
• I ask that everyone respect opinions on the board whether you agree with them or not. We are all here to make money and avoid the
minimum loss we can.
Rules of the Board
Most of this board's WATCHERS are "lurkers" who appreciate info available without the need to sift through tons of "empty" posts.
1. Respect everyone opinions on trades.
2. No Pumping of Stocks.
3. No OTCBB or PINK STOCKS
*********************************************************************************************************
To help us evaluate our performance, please "BoardMark" the board if you find it useful.
To do so, just click on "Add to Favorites" Button at Right just above the Posts Dates.
 Presently, the Board has 179 Boardmarks, Thank you!
*Information Posted on this Board is not Meant to Suggest any Specific Action, But to Point Out the Technical Signs That Can Help Our Readers Make Their Own Specific Decisions. Your Due Deligence is a Must.
EXCHANGE TRADED FUNDS~ETFs COMPONENTS~RSI and I/V charts#msg-5495097 COMPONENTSFOR ^NDX / QQQQ ~ I/V charts #msg-9787995
Gold~ Silver~ HUI~ XAU~ US$~ €uro~ Crude #msg-29347660 (thanks,bob)
Cookies/Bandwidth/Security/Privacy #msg-9353921 PIEs/Cookies/Macromedia/Flash #msg-9412363 PerformanceTips for WinXP #msg-9854670
| Volume | |
| Day Range: | |
| Bid Price | |
| Ask Price | |
| Last Trade Time: |


