 News
News  Market Data
  Discover

Support: 888-992-3836
Copyright © 2023 InvestorsHub Inc.


Register for free to join our community of investors and share your ideas. You will also get access to streaming quotes, interactive charts, trades, portfolio, live options flow and more tools.
The 10 Top/Bottom NASDAQ 100 Index percent net change performers
By: Thom Hartle | April 17, 2024
• Today (8:34 CST), the 10 top/bottom percent net change performers in the NASDAQ 100 Index.

Read Full Story »»»
 DiscoverGold
$SPX Forward Returns Analog Analysis
By: Nautilus Research | April 16, 2024
• #spx $spx FWIW top 10 unique 1-year analog matches.

Read Full Story »»»
DiscoverGold
April 2 Seasonal MACD Signal Triggered Right on Time
By: Almanac Trader | April 16, 2024
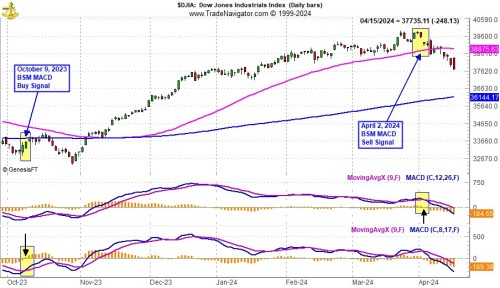
We issued our Best Six Months MACD Seasonal Sell signal for DJIA and S&P 500 to newsletter subscribers on April 2 when slower moving MACD indicators applied to DJIA and S&P 500 both turned negative after the start of the last month of the BSMs. This marked the start of our transition to a more cautious stance.
Arrows in the charts point to a crossover or negative histogram on the slower moving MACD used by our Seasonal Switching Strategy to issue a sell signal. NASDAQ’s “Best Eight Months” lasts until June. Subscribe to our Almanac Investor Newsletter and get all our trades. https://stocktradersalmanac.com/Alerts.aspx
We do not merely “sell in May and go away.” Instead, we take some profits, trim or outright sell underperforming stock and ETF positions, tighten stop losses and limit adding new long exposure to positions from sectors that have a demonstrated a record of outperforming during the “Worst Months” period.

Read Full Story »»»
DiscoverGold
$SPX $40+ Million Put Sellers (Unusual) These prints have very near-term expirations and are OTM
By: Cheddar Flow | April 16, 2024
• $SPX $40M+ Put Sellers (Unusual)
These prints have very near-term expirations and are OTM, which means the whales are capitalizing on heightened IV and believe downside will remain muted for the next 2 days
These traders will get paid if SPX remains above the strikes

Read Full Story »»»
DiscoverGold
$SPX It's a Flow Fight Bull vs. Bear
By: Cheddar Flow | April 16, 2024
• $SPX It's a Flow Fight
Bull vs. Bear

Read Full Story »»»
DiscoverGold
AI-generated Buy and Sell Daily Signals
By: Hedgeye | April 16, 2024

Read Full Story »»»
DiscoverGold
Markets Monthly Pattern »» Watchlist - Top 10
By: Marty Armstrong | April 16, 2024
• Dow Jones Industrials Index »» Moving Lower
• NASDAQ Composite Index »» Possible Important High
• NASDAQ 100 Index »» New Highs Still Possible
• S&P 500 Index »» Possible Important High
• Russell 2000 Index »» Knee Jerk Low
• US Dollar Index »» Pressing Higher
• CBOE VIX Index »» Pressing Higher
• NY Gold Futures »» Pressing Higher
• NY Silver COMEX Futures »» Temp High
• NY Crude Oil Futures »» Possible Temp High/New Highs Still Possible
DiscoverGold
The 10 Top/Bottom S&P 500 Index percent net change performers
By: Thom Hartle | April 15, 2024
• Today (8:35 CST), the 10 top/bottom percent net change performers in the S&P 500 Index.

Read Full Story »»»
DiscoverGold
The 10 Top/Bottom NASDAQ 100 Index percent net change performers
By: Thom Hartle | April 15, 2024
• Today (8:35 CST), the 10 top/bottom percent net change performers in the NASDAQ 100 Index.

Read Full Story »»»
DiscoverGold
$SPX - Tapped the 1st Target from the Bear 'Wedge'...
By: Sahara | April 15, 2024
• $SPX - Tapped the 1st Target from the Bear 'Wedge'...

Read Full Story »»»
DiscoverGold
S&P 500 And Nasdaq 100 Each Down Sub-3% From Recent Highs To End Right On 50-Day; Russell 2000 In Slight Breach
By: Hedgopia | April 15, 2024
From last month’s record highs, both the S&P 500 and Nasdaq 100 are down just under three percent and have now approached the 50-day, which has not been lost since last October when they bottomed. Given that the trendline support from the October lows has now been breached, bulls understand the significance of the need to save the 50-day.
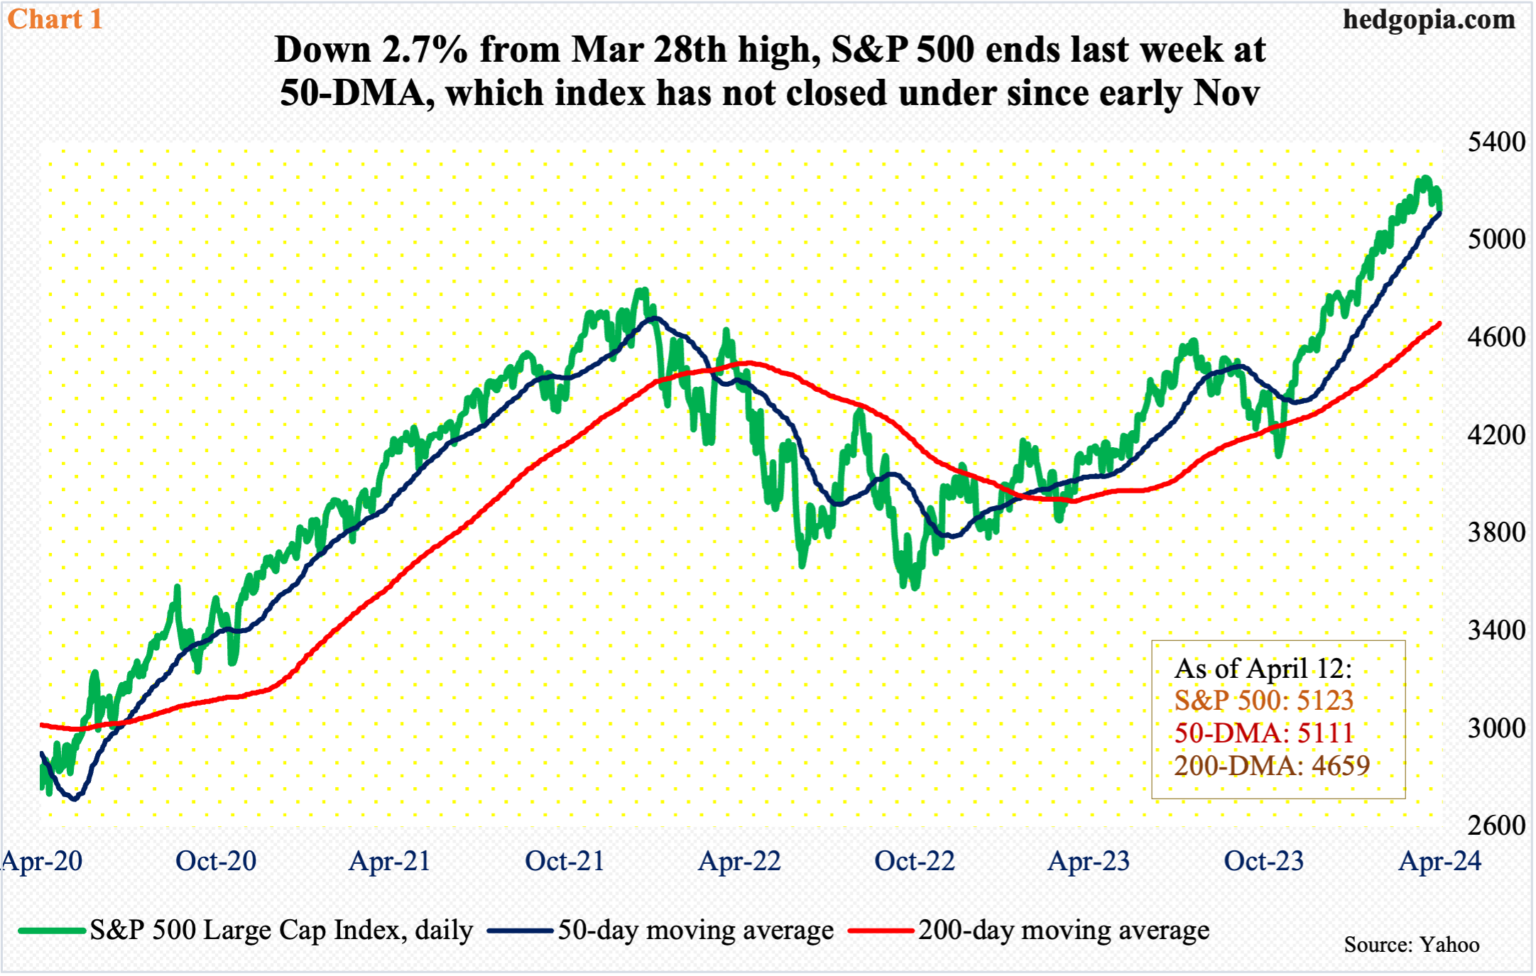
The S&P 500 has been under slight pressure since reaching a fresh high of 5265 on March 28th. This was followed by an intraday high of 5264 in the very next session (April 1st) and was preceded by 5261 on March 21st. Inability to push through 5260s has led to downward pressure. Through last Friday, the large cap index is down 2.7 percent from the March high – which is nothing in the big scheme of things.
From last October’s trough through last month’s high, the S&P 500 jumped 28.3 percent! The bullish momentum is at risk of cracking.
As the index pushed higher, the RSI began to diverge in March. Then came a breach of a rising trendline from last October. This was then followed by last week’s potentially bearish cross-down between the 10- and 20-day moving averages. With all this in the background, the index (5123) finished last week right on the 50-day (5111) – just about (Chart 1). It is a must-save for the bulls. In the event of a rally, their first test will occur at 5170s.
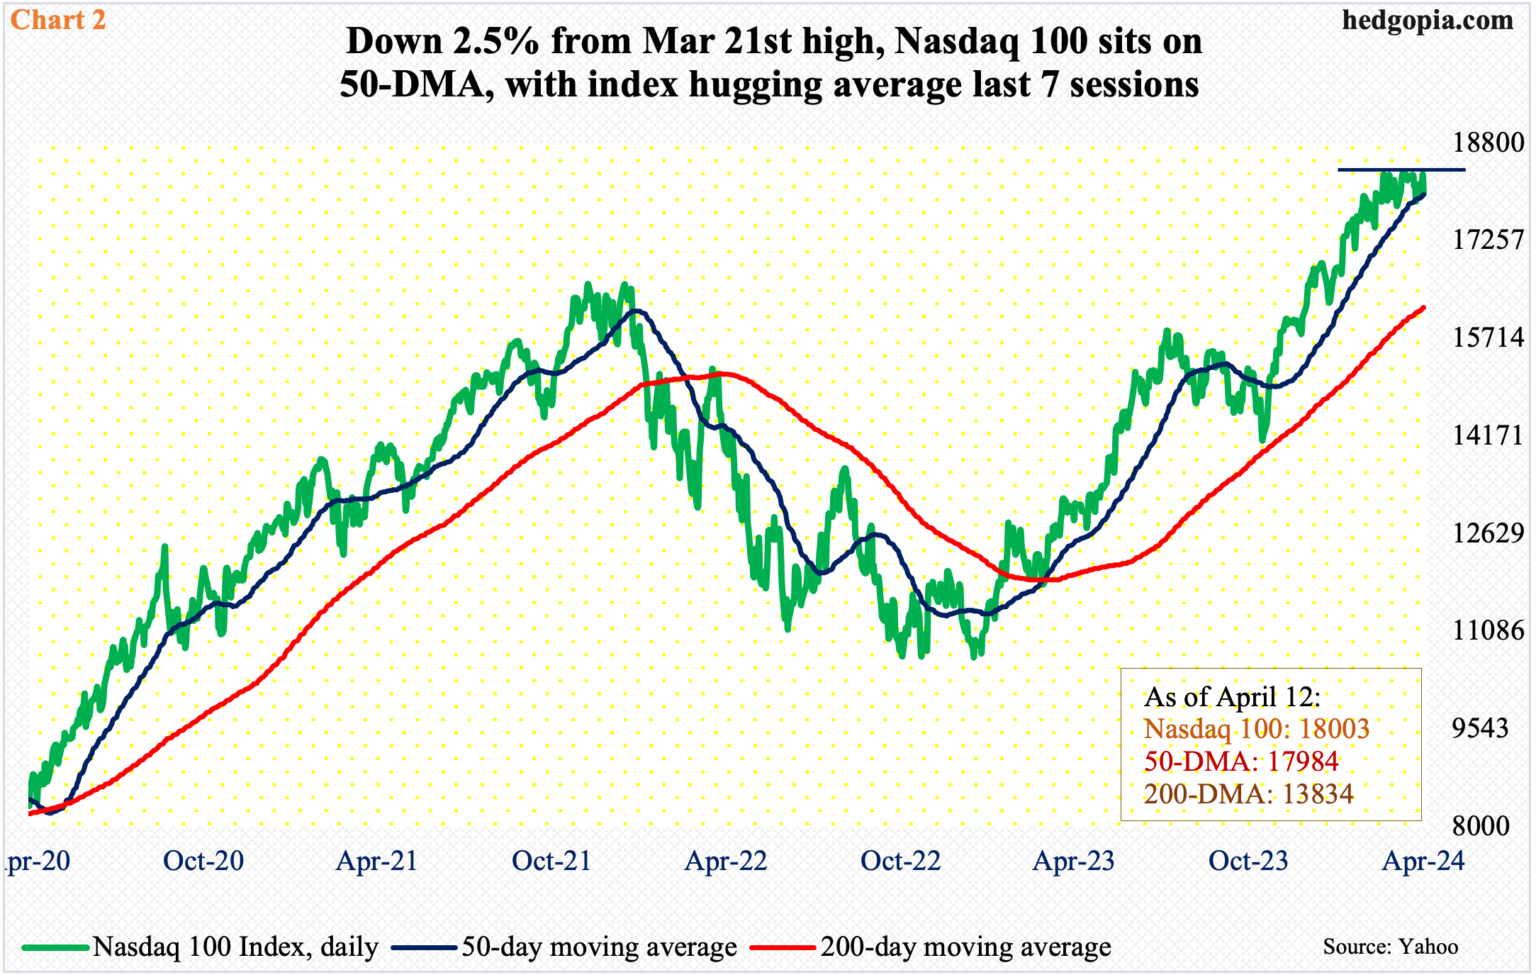
Things have evolved similarly on the Nasdaq 100, which surged 31.3 percent from the October low to then hit the wall early March, although it went on to post a new intraday high of 18465 on March 21st.
On the 1st last month, the tech-heavy index tagged 18333 intraday. Since then, 18300s have been touched several times, including last Thursday when the weekly high of 18337 was ticked. The index in essence has gone sideways since early March (Chart 2).
In the meantime, trendline support from last October has been compromised. Last week, the Nasdaq 100 (18003) essentially finished on the 50-day (17984). In fact, the index has essentially hugged the average last seven sessions. Inability to rally right off the average raises the risk that a breach is just a matter of time.
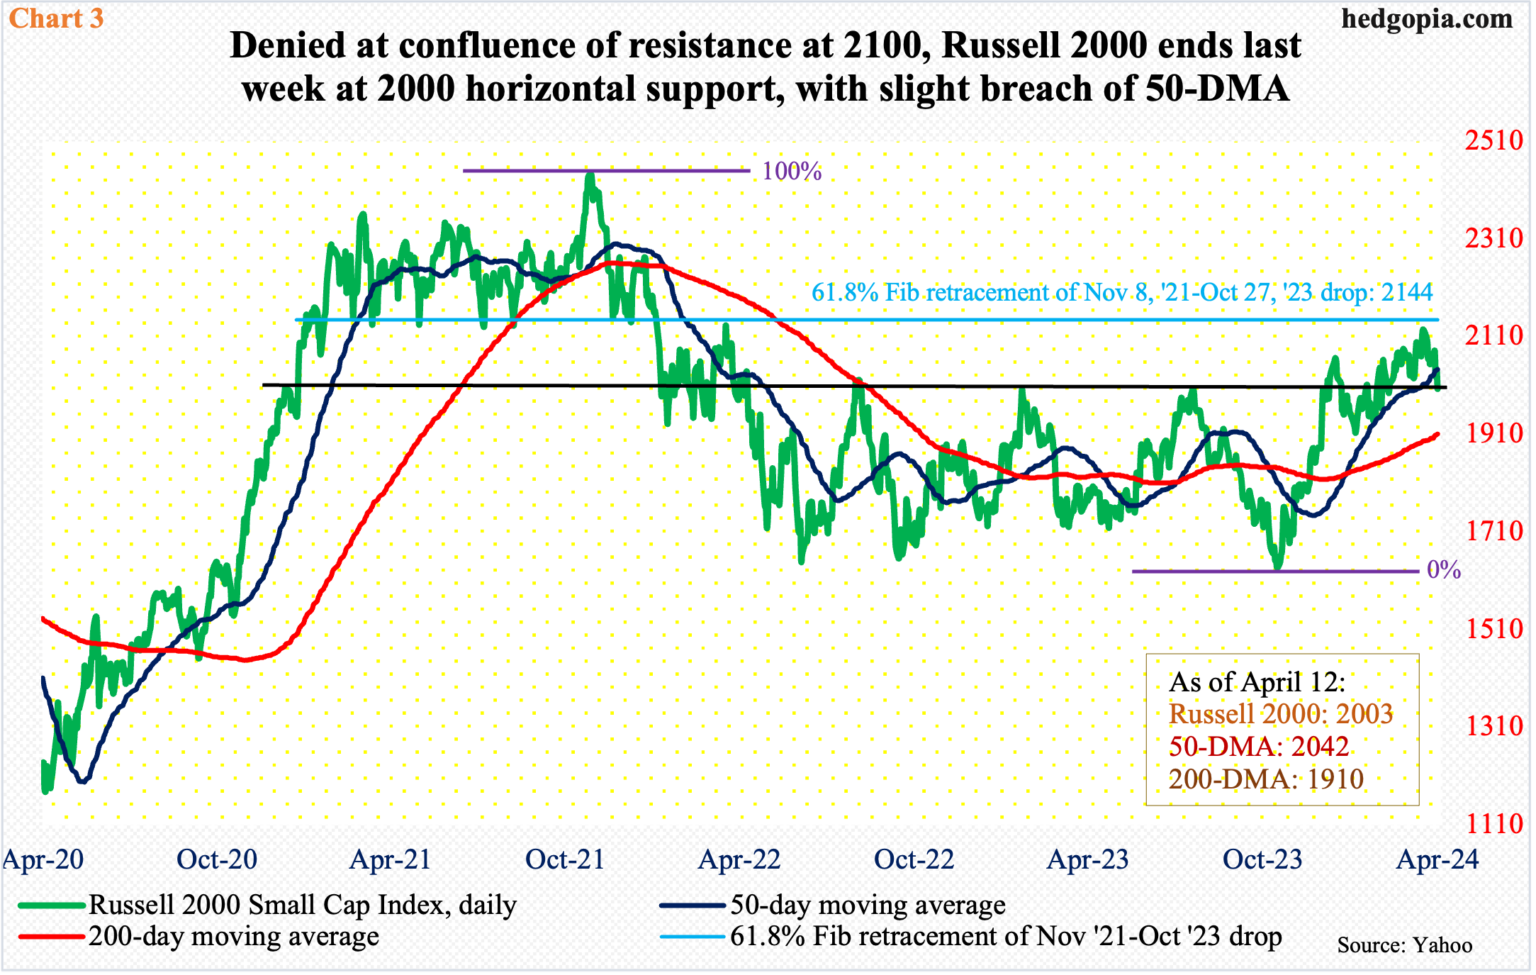
On the Russell 2000 (2003), the 50-day (2042) has been breached, albeit not by a whole lot. Unlike its large-cap cousins mentioned above, it never rallied to a new high post-October low.
The small cap index peaked in November 2021 at 2459. The subsequent drop bottomed next June at 1641, which was successfully tested that October at 1642. Then, last October, bulls once again showed up near those lows as the index ticked 1634 and turned up. The rally that followed stopped at 2135 on March 28th. After that, 2100-plus was hit twice more – and three times before that, with the first occurring on March 8th. This level is important from various angles.
A 61.8-percent Fibonacci retracement of the November 2021-October 2023 decline amounts to 2144 (Chart 3). It also represents a measured-move target of a range breakout that took place on December 13th; before that, it was rangebound between 1700-1900 going back to January 2022. As well, horizontal resistance at 2100 goes back to January 2021. The resistance has held.
Last week, the index closed essentially at 2000 lateral support, a breach of which will expose the index to breakout retest at 1900.
As things stand, be it small- or large-cap bulls, they are being forced to step up and show their mettle. Stocks have rallied huge since last October, and bearish sentiment is way suppressed. The major US tech outfits do not report until late this month and early next month. If to go by how last Friday’s bank earnings got treated, there will be tough sessions ahead in this earnings season.
Read Full Story »»»
DiscoverGold
S&P 500 Levels to Watch Heading Into Expiration Week
By: Schaeffer's Investment Research | April 15, 2024
• As investor optimism falls, the SPX and VIX are nearing inflection points on the charts
• Delta hedging at the SPY's 510 strike this week could be pivotal to price action
A higher-than-expected consumer price index (CPI) reading on Wednesday, in addition to geopolitical tensions, culminated in additional stock market weakness last week. Remaining hopes of a rate cut in June were dashed as some Federal Reserve officials appeared to backtrack on expectations that inflation was headed in the right direction.
Last week’s decline in the equity market followed a warning shot the week prior, on the heels of hints from one Fed official that there may not be a rate cut in 2024. This helped push the S&P 500 Index (SPX – 5,123.41) below channel support. Additionally, there was a hint from the Cboe Market Volatility Index (VIX – 16.74) that higher volatility was an increasing probability after two closes above 15.40 in the first week of April.
At risk of drawing lines in the sand, bulls and bears should be aware of levels that came into play on Friday that could be a pivot or hesitation point for both the SPX and VIX.
The SPX’s 50-day moving average, which acted as resistance on a bounce prior to the October 2023 trough, marked the Friday afternoon low. As such, keep an eye on this trendline, which is sloping higher and rising about five points each day. It enters the week at 5,111.
There are two points of resistance overhead. The first is the 30-day moving average, which is beginning to flatten, and comes into the week around 5,175-5,180. The second resistance level is at 5,220, site of the channel break on April 4. This level marked highs last week.

Another notable level to watch for the VIX is 18.68, which corresponds with 50% above the 2023 close. If you follow the VIX closely, you know it tends to respect round numbers that anchor to a key high or low, or a key year-to-date percentage level.
In past weeks, for example, we discussed the importance of 15.40, or half the 2023 high. Will 18.68 have the same importance as 15.40 in terms of acting as resistance like 15.40 did in the first three months of the year? If so, a VIX peak would correspond to a low in equity prices.

The SPX is now 2.5% below its late-March closing high, hardly considered a correction at this point. But with optimism among active investment managers and newsletter writers in the early stages of unwinding, equity option buyers increasing the number of put purchases relative to call purchases, and shorts building positions in recent weeks, the risk of corrective action is heightened, since quantified momentum measures on the SPX are no longer in place.
The chart below displays the recent optimistic extreme among active investment managers, as measured by the weekly National Association of Active Investment Managers (NAAIM) survey.
In this survey, managers indicate their net allocation to equities each week, and we smooth the results with a four-week moving average. Note the four-week moving average is currently rolling over from an optimistic extreme, implying active managers are slowly decreasing their allocation to stocks.
This rollover could be short-lived, resulting in little additional downside, but the risk is a decrease in allocations to stocks persisting over weeks or months, which occurred in late 2021 and last summer.


Loyal readers of this commentary may remember that during the momentum stage of the bullish run from November into most of March, short-term traders using SPDR S&P 500 ETF Trust (SPY – 510.85) options were great contrarian indicators, as they were emphasizing put options more so than call options on contracts with five days or less until expiration.
It’s interesting that last week, and after the break below the bottom rail of the SPX bullish channel, this group emphasized calls (or upside bets) more so than puts (downside bets) on the weekly 4/12 options that just expired. In fact, there were put liquidations on multiple strikes.

It is now standard April expiration week. The SPY is currently sitting in the vicinity of the 510-strike, which is also home to more than 80,000 put open interest in the expiring April series.
I point this out because a technical break below this popular moving average could induce selling. Moreover, those short 510-strike puts are likely to hedge their position by selling SPX futures to remain neutral. If an onslaught of both technical-based and option-related selling occurs, big put strikes – such as the peak put open interest at the 500 strike – could become magnets.
But this scenario could occur on a significant break of the 510-strike. The bullish scenario is the 50-day moving average holding, and any short positions related to the out-of-the-money put open interest strikes being unwound, which would support an expiration week rally.
Be open to both possibilities, if trading this time frame.

Read Full Story »»»
DiscoverGold
Every S&P 500 Sector declined last week. That's the first time that's happened since September!
By: Barchart | April 14, 2024
• Every S&P 500 Sector declined last week. That's the first time that's happened since September!

Read Full Story »»»
DiscoverGold
The $NYSE McClellan Oscillator is far below 70 already, a level that indicates significant oversold levels
By: SmartReversals | April 12, 2024
• Be Careful Staying Too Bearish On The Market
The $NYSE McClellan Oscillator is far below 70 already, a level that indicates significant oversold levels.
Extreme high or low readings +70 or -70, can indicate overbought or oversold conditions, respectively. It suggests the market might be due for a bounce.
Posted earlier the $SPX chart, indicating support levels and mentioning that a reversal candle would not be a surprise on Monday or Tuesday.
Last Friday, the $NDX McClellan oscillator was oversold, it was not the case for the broader market. It is now.

Read Full Story »»»
DiscoverGold
The NASDAQ 100's $QQQ performance each year since 1999
By: Evan | April 13, 2024
• The NASDAQ 100's $QQQ performance each year since 1999
1999: +79%
2000: -36.1%
2001: -33.4%
2002: -37.4%
2003: +49.7%
2004: +10.5%
2005: +1.6%
2006: +7.1%
2007: +19%
2008: -41.7%
2009: +54.7%
2010: +19.9%
2011: +3.4%
2012: +18.1%
2013: +36.6%
2014: +19.2%
2015: +9.5%
2016: +7.1%
2017: +32.7%
2018: -0.1%
2019: +39%
2020: +48.6%
2021: +27.4%
2022: -32.6%
2023: +54%
2024*: +7.2% (So far)
Read Full Story »»»
DiscoverGold
Tech pulling back right on cue? $QQQ
By: TrendSpider | April 13, 2024
• Tech pulling back right on cue? $QQQ
When we refine seasonality data to include only election years, the Nasdaq 100's win rate drops to only 33% in April over the last 25 years.

Read Full Story »»»
DiscoverGold
CoT: Peek Into Future Through Futures, How Hedge Funds Are Positioned
By: Hedgopia | April 13, 2024
• Following futures positions of non-commercials are as of April 9, 2024.
E-mini S&P 500: Currently net short 62.9k, down 15.2k.
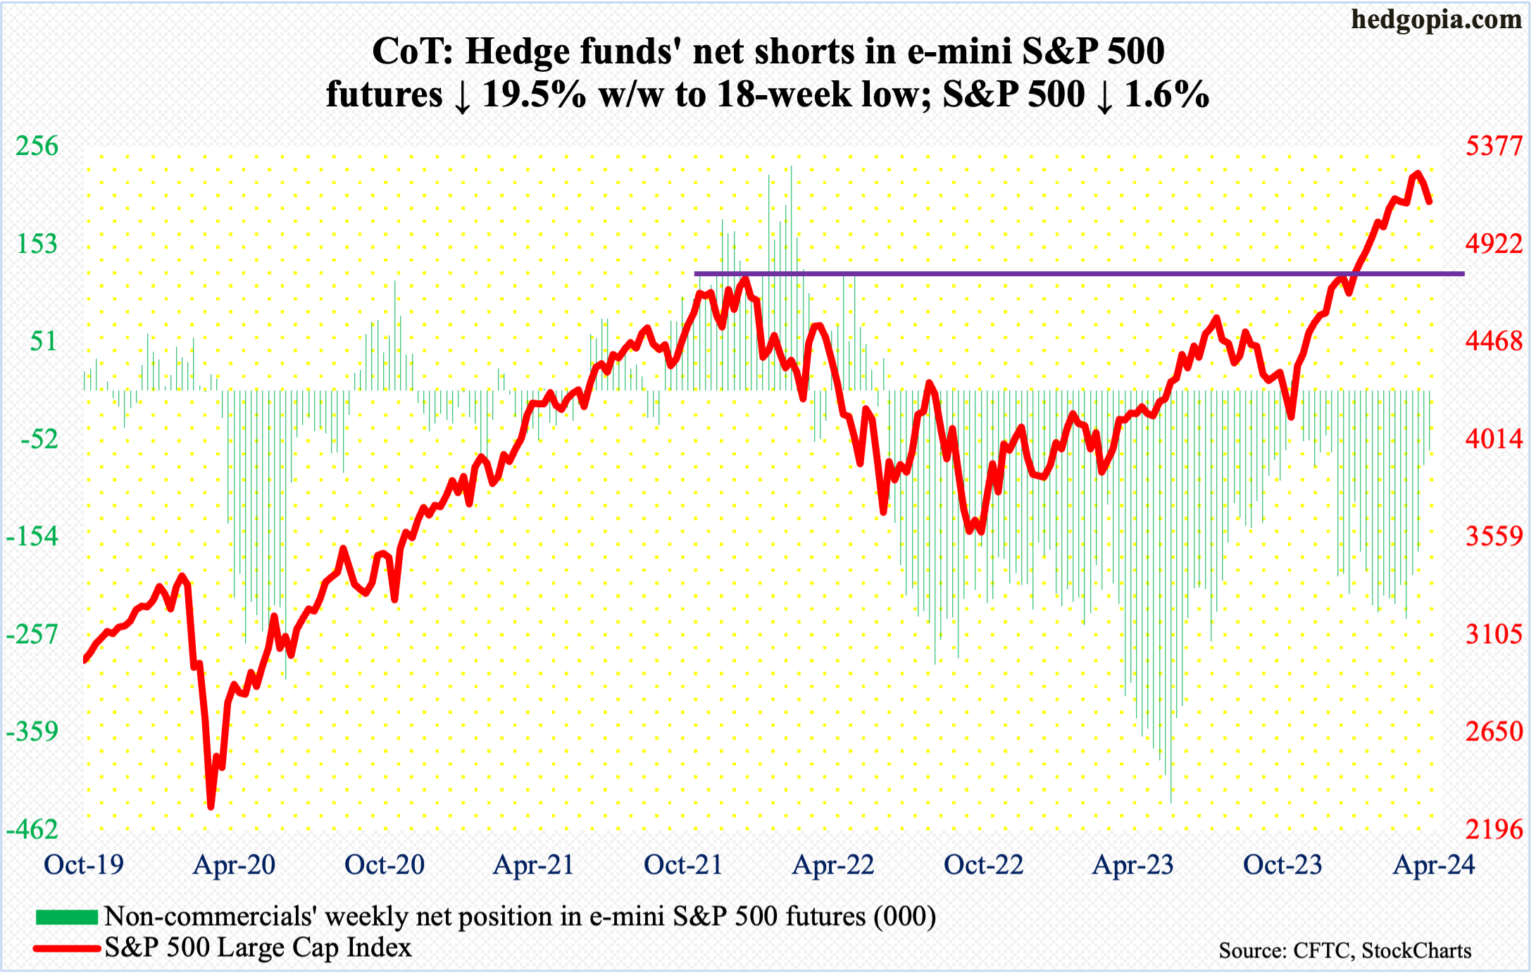
Equity bulls are at risk of losing short-term momentum on the S&P 500. A potentially bearish cross-down between the 10- and 20-day averages is complete. This is the second time since last October’s low this has occurred. The first one took place mid-January, but that did not amount to much, lasting just a couple of sessions. Back then, the 50-day was much lower; this time around, the average (5111) is right here. In fact, Friday’s intraday low of 5108 did attract some buying, with the large cap index down 1.6 percent for the week to 5123. The index peaked at 5265 on March 28th.
Bears have an opportunity here. For the bulls, the ongoing collapse in bearish sentiment is a problem, as what has been a tailwind is turning into a headwind (more on this here). To boot, trendline support from last October has been breached.
Immediately ahead, in the event of a rally, bulls’ first test will occur at 5170s.
Nasdaq (mini): Currently net long 7.5k, up 12.7k.
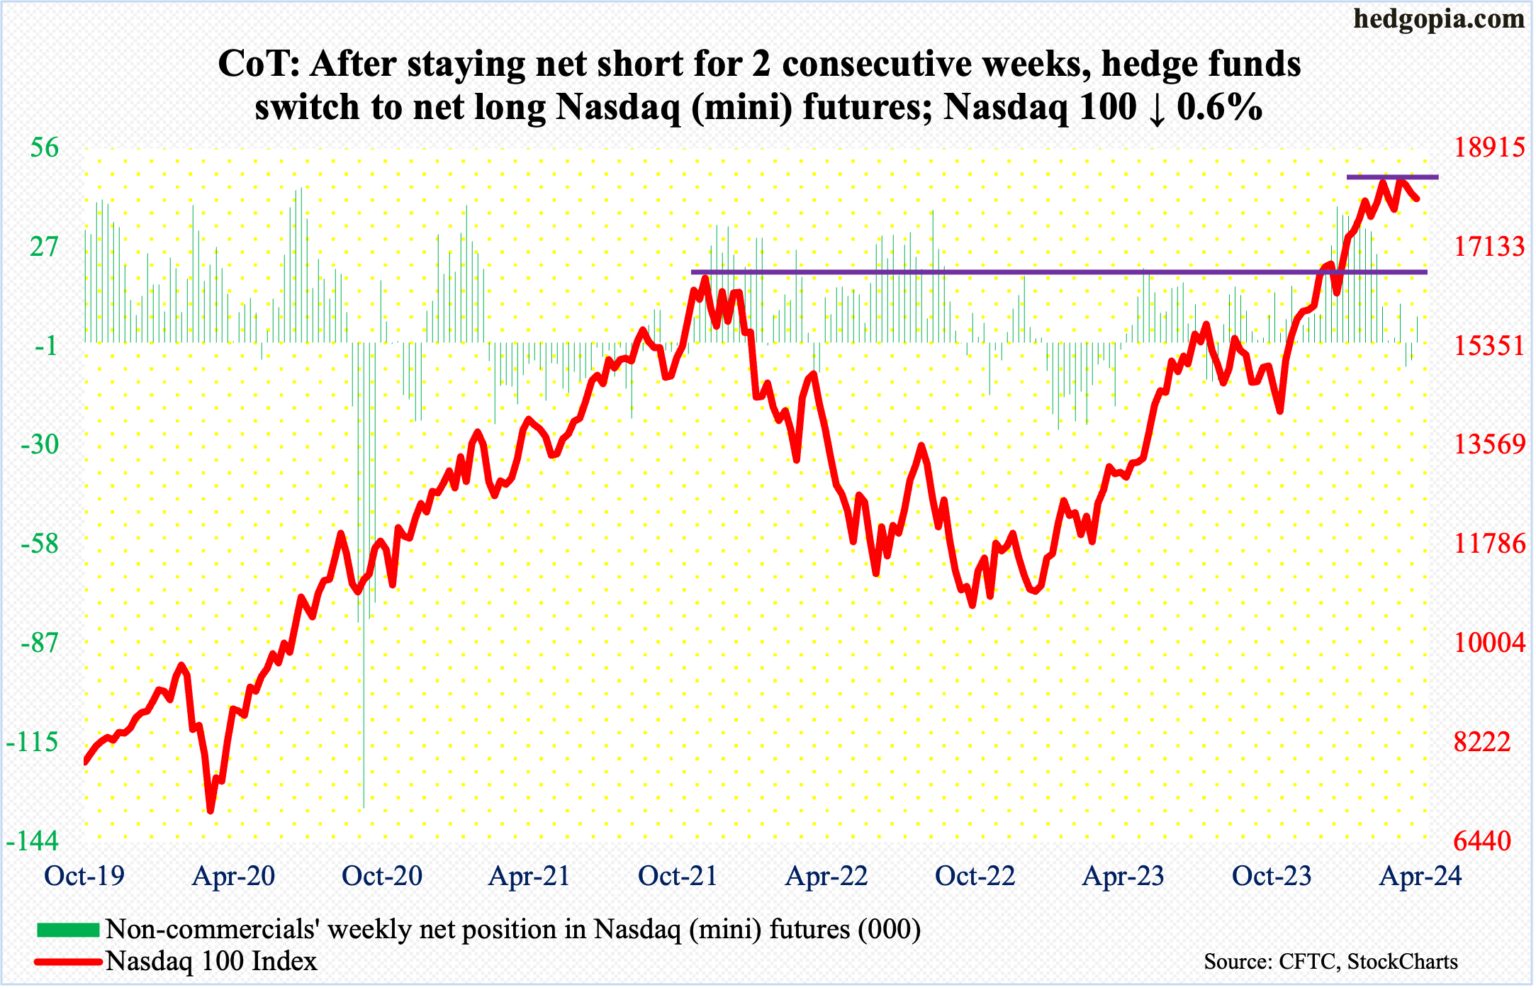
As did the S&P 500, the Nasdaq 100 ended the week essentially right on the 50-day (17984). In fact, Friday’s intraday low of 17952 did breach the average but closed the session at 18003. The tech-heavy index has essentially hugged the average the last seven sessions. Inability to rally right off the average raises the risk that a breach is just a matter of time.
Non-commercials probably do not think a breach is in order – at least not right away anyway. After staying net short Nasdaq (mini) futures for a couple of weeks, they switched to net long this week.
For a breach not to occur, catalysts are needed, and the major US tech outfits do not report until late April and early May. Momentum has been down since the Nasdaq 100 peaked on March 21st at 18465, followed by a breach of a rising trend line from last October’s low.
Russell 2000 mini-index: Currently net short 27.6k, up 5.4k.
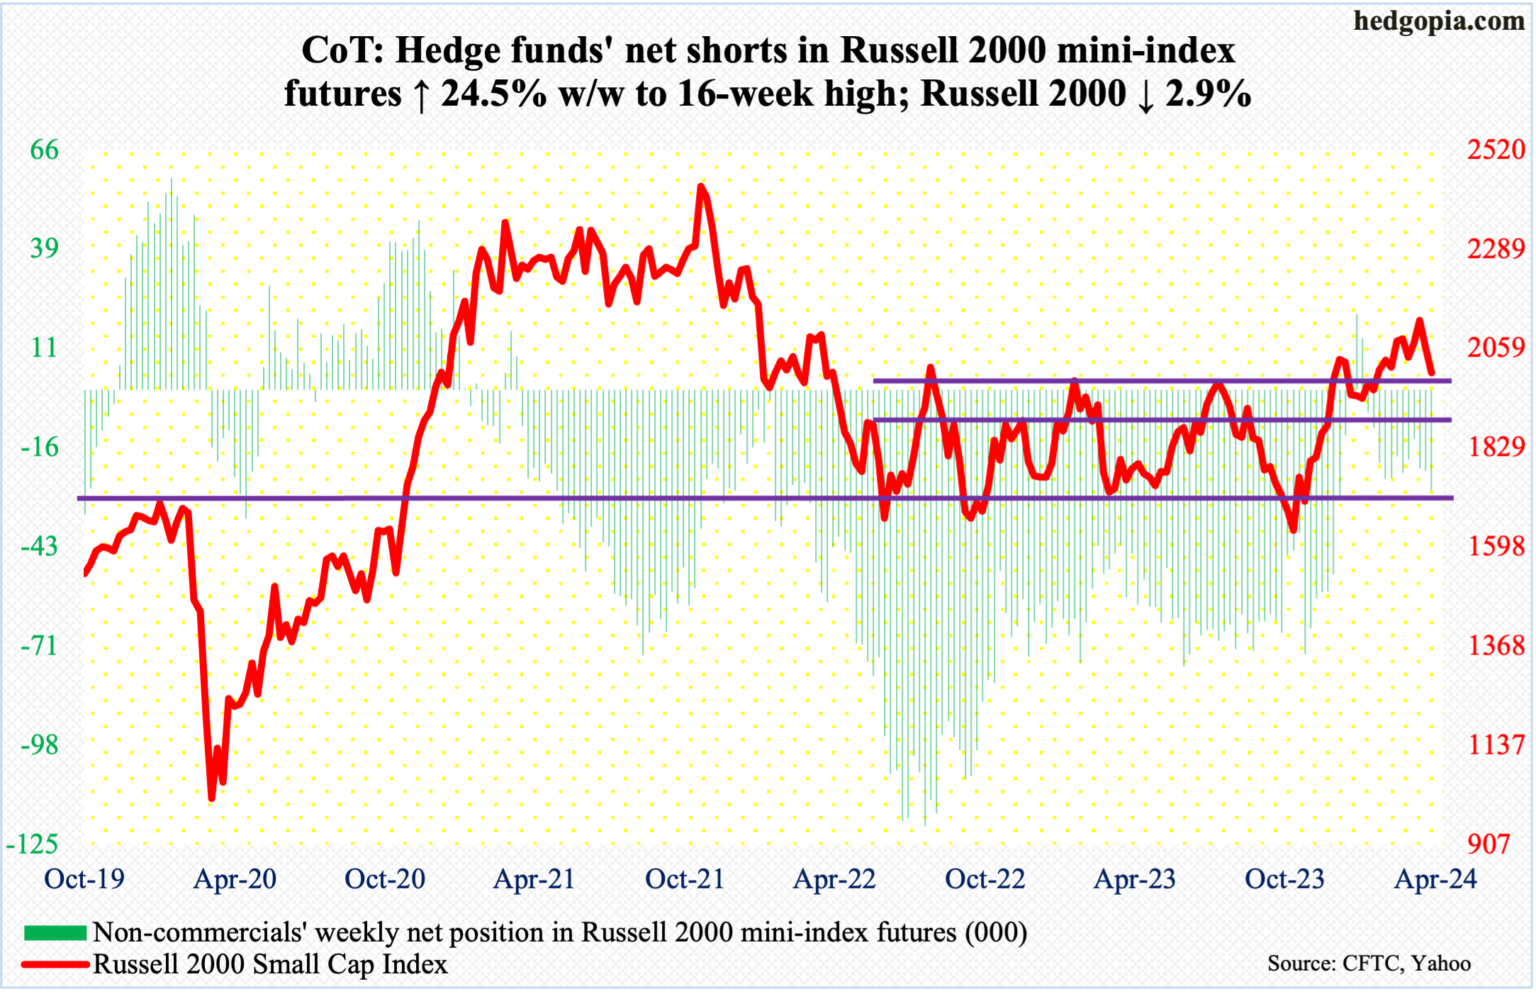
Once again, small-cap bulls are being forced to defend 2000. The Russell 2000 declined 2.9 percent this week to 2003, having tagged 1995 intraday Friday. Inability to save 2000 will expose the index to breakout retest at 1900. On December 13th, it broke out of a 1700-1900 range in place since January 2022.
As things stand, bulls have their back against the wall, as for nearly a month through early this month several tries at 2100 were rejected. Horizontal resistance at 2100 goes back to January 2021. This level also represents a measured-move target of the 1700-1900 range breakout.
Much as the S&P 500 and the Nasdaq 100 did, the Russell 2000 has now compromised trendline support from last October’s low.
US Dollar Index: Currently net short 1.1k, down 754.
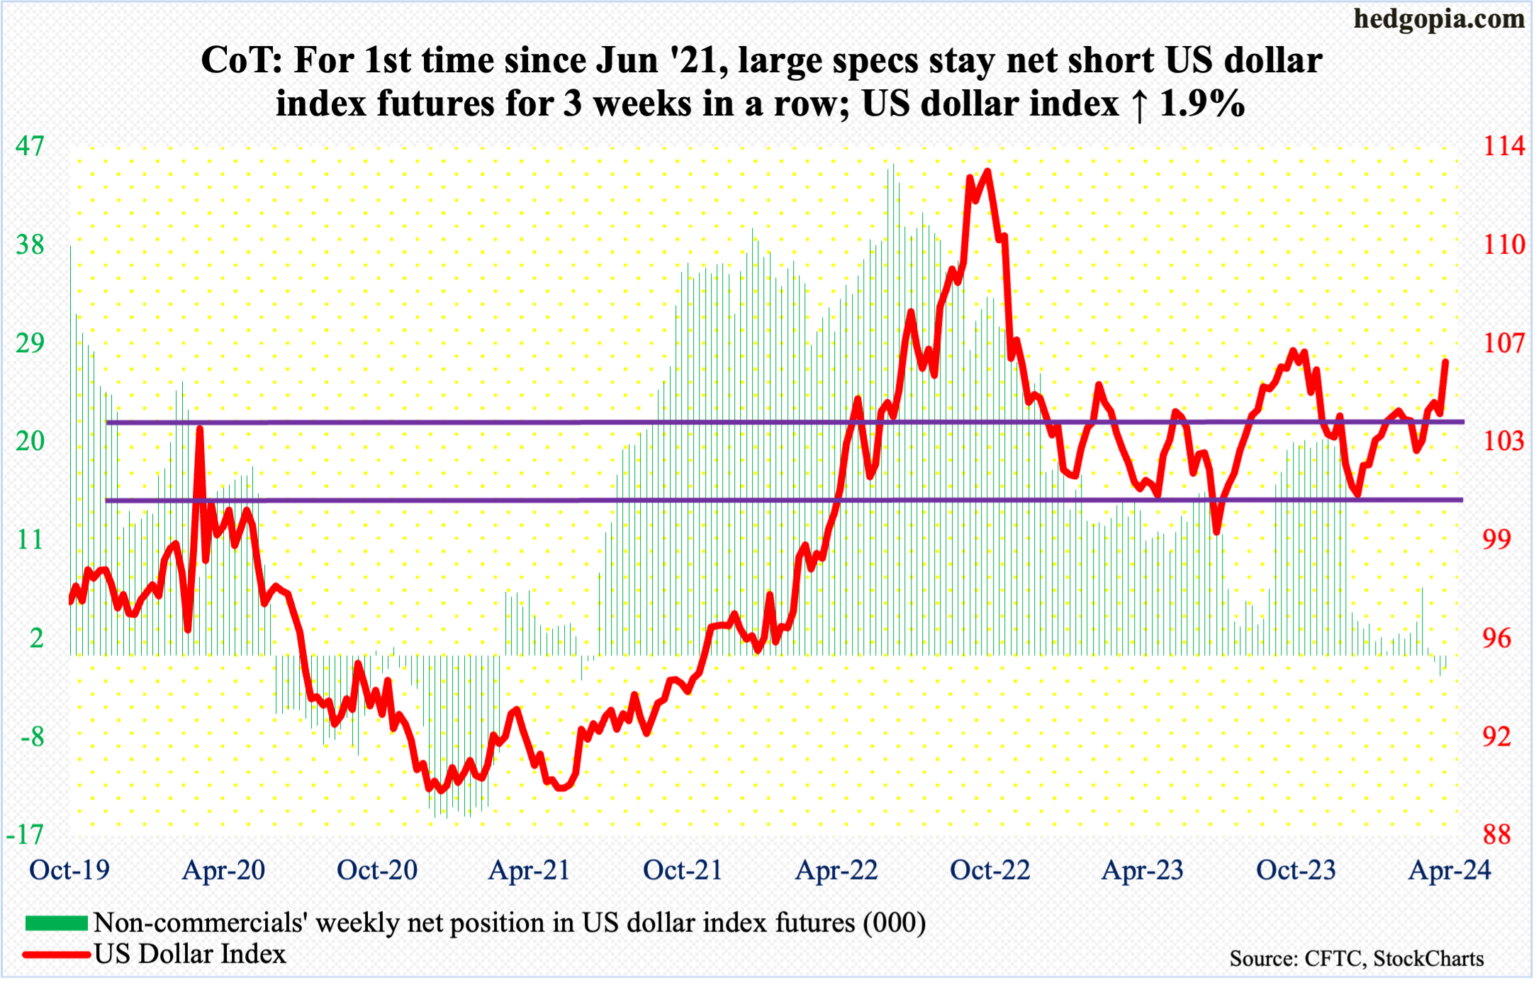
The US Dollar Index had a huge week, up 1.9 percent to 106.01. Resistance at 103-104 goes back to December 2016, and since bottoming at 102.30 on March 8th, it hesitated at the upper end for a few weeks. This week, the resistance was emphatically taken out.
Between early October and early November last year, sellers showed up at 107, which dollar bulls are probably eyeing for now.
VIX: Currently net short 31.3k, down 19k.
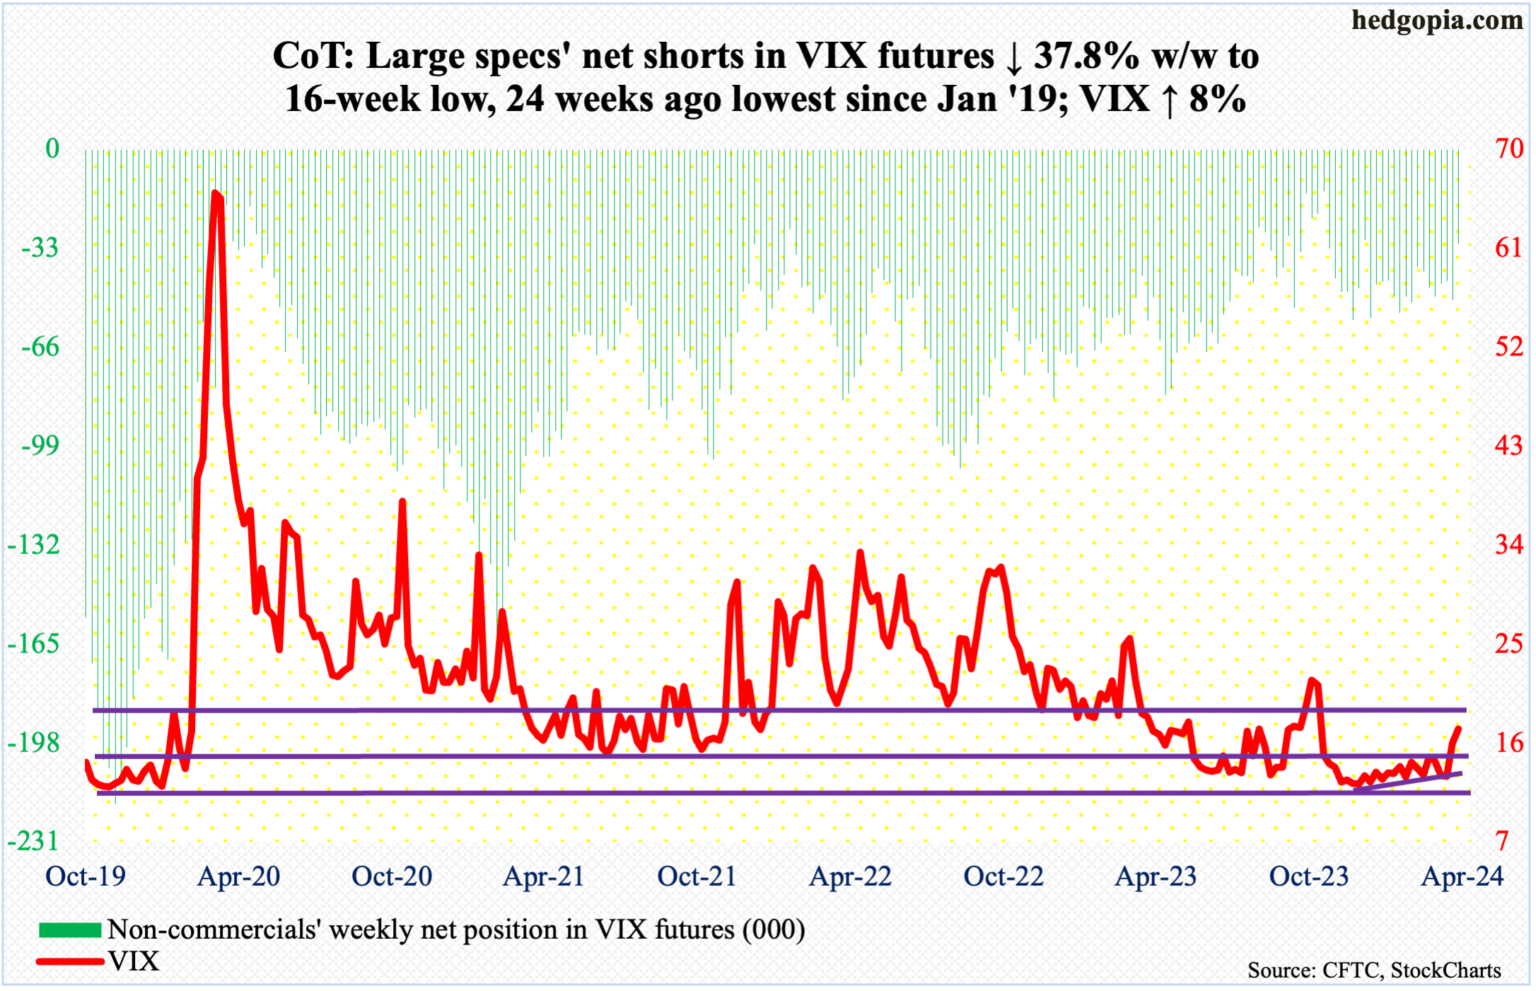
VIX closed out the week at 17.31 but rose as high as 19.20 intraday Friday; this was the highest print since October 31st. Back then, after spiking to 23.08 on October 23rd – just before US stocks bottomed – the volatility index was on its way down.
Now, the trend is looking up, with both the 50- and 200-day beginning to turn up – although ever so slightly. If the weekly prevails, volatility likely continues to firm up. The only thing volatility bulls need to watch out for is if Friday’s action is part of a spike reversal. They definitely would not want to see a similar spike followed by a reversal next week.
Read Full Story »»»
DiscoverGold
S&P 500 Index (SPX) »» Weekly Summary Analysis
By: Marty Armstrong | April 13, 2024
S&P 500 Cash Index closed today at 512341 and is trading up about 7.41% for the year from last year's settlement of 476983. Up to this moment in time, this market has been rising for 5 months going into April suggesting that this has been a bull market trend on the monthly time level which has been confirmed by electing all of our model's long-term Bullish Reversals from the key low.
ECONOMIC CONFIDENCE MODEL CORRELATION
Here in S&P 500 Cash Index, we do find that this particular market has correlated with our Economic Confidence Model in the past. The Last turning point on the ECM cycle low to line up with this market was 2009 and 2002. The Last turning point on the ECM cycle high to line up with this market was 2022 and 2007 and 2000.
MARKET OVERVIEW
NEAR-TERM OUTLOOK
The S&P 500 Cash Index has continued to make new historical highs over the course of the rally from 1974 moving into 2024. Distinctly, we have elected two Bullish Reversals to date.
This market remains in a positive position on the weekly to yearly levels of our indicating models. Pay attention to the Monthly level for any serious change in long-term trend ahead.
Solely focusing on only the indicating ranges on the Daily level in the S&P 500 Cash Index, this market remains moderately bearish position at this time with the overhead resistance beginning at 517987 and support forming below at 511448. The market is trading closer to the support level at this time.
On the weekly level, the last important high was established the week of March 25th at 526485, which was up 22 weeks from the low made back during the week of October 23rd. We have seen the market drop sharply for the past week penetrating the previous week's low and it closed beneath that low which was 514606. This was a very bearish technical indicator warning that we have a shift in the immediate trend. We are still trading neutral on the Weekly Momentum Indicators and this is a warning that initial support has been breached. This strongly implies we should pay close attention now to the Weekly Bearish Reversals. If we begin to elect Weekly Bearish Reversals, then we are dealing with a more sustainable near-term correction. When we look deeply into the underlying tone of this immediate market, we see it is currently still in a weak posture.
INTERMEDIATE-TERM OUTLOOK
YEARLY MOMENTUM MODEL INDICATOR
Our Momentum Models are rising at this time with the previous low made 2022 while the last high formed on 2023. However, this market has rallied in price with the last cyclical high formed on 2022 warning that this market remains strong at this time on a correlation perspective as it has moved higher with the Momentum Model.
Interestingly, the S&P 500 Cash Index has been in a bullish phase for the past 12 months since the low established back in March 2023.
Critical support still underlies this market at 438504 and a break of that level on a monthly closing basis would warn that a sustainable decline ahead becomes possible. Immediately, the market is trading within last month's trading range in a neutral position.
DiscoverGold
Nasdaq Composite Index (COMP) »» Weekly Summary Analysis
By: Marty Armstrong | April 13, 2024
NASDAQ Composite Index Cash closed today at 1617509 and is trading up about 7.75% for the year from last year's settlement of 1501135. Caution is required for this market is starting to suggest it may now decline on the MONTHLY level. Factually, this market has been rising for 5 months going into April suggesting that this has been a bull market trend on the monthly time level which has been confirmed by electing all of our model's long-term Bullish Reversals from the key low.
ECONOMIC CONFIDENCE MODEL CORRELATION
Here in NASDAQ Composite Index Cash, we do find that this particular market has correlated with our Economic Confidence Model in the past. The Last turning point on the ECM cycle low to line up with this market was 2022 and 2009 and 2002. The Last turning point on the ECM cycle high to line up with this market was 2007 and 2000.
MARKET OVERVIEW
NEAR-TERM OUTLOOK
The NASDAQ Composite Index Cash has continued to make new historical highs over the course of the rally from 2009 moving into 2024. Noticeably, we have elected four Bullish Reversals to date.
This market remains in a positive position on the weekly to yearly levels of our indicating models. Pay attention to the Monthly level for any serious change in long-term trend ahead.
Focusing on our perspective using the indicating ranges on the Daily level in the NASDAQ Composite Index Cash, this market remains moderately bearish position at this time with the overhead resistance beginning at 1622072 and support forming below at 1613724. The market is trading closer to the support level at this time.
On the weekly level, the last important high was established the week of March 18th at 1653886, which was up 21 weeks from the low made back during the week of October 23rd. We have been generally trading up for the past week from the low of the week of April 1st, which has been a move of 2.605%. When we look deeply into the underlying tone of this immediate market,
INTERMEDIATE-TERM OUTLOOK
YEARLY MOMENTUM MODEL INDICATOR
Our Momentum Models are rising at this time with the previous low made 2022 while the last high formed on 2023. However, this market has rallied in price with the last cyclical high formed on 2021 warning that this market remains strong at this time on a correlation perspective as it has moved higher with the Momentum Model.
Interestingly, the NASDAQ Composite Index Cash has been in a bullish phase for the past 12 months since the low established back in March 2023.
Critical support still underlies this market at 1405840 and a break of that level on a monthly closing basis would warn that a sustainable decline ahead becomes possible. Immediately, the market is trading within last month's trading range in a neutral position.
DiscoverGold
$SPY & $SPX They're adding more into the dip
By: Cheddar Flow | April 12, 2024
• $SPY & $SPX They're adding more into the dip.

Read Full Story »»»
DiscoverGold
% of S&P 500 stocks trading above their 5-Day Moving Average plunges to 4%, the lowest level in 13 months
By: Barchart | April 12, 2024
• % of S&P 500 stocks trading above their 5-Day Moving Average plunges to 4%, the lowest level in 13 months.

Read Full Story »»»
DiscoverGold
April Monthly Option Expiration Week - DJIA Up 33 of Last 42
By: Almanac Trader | April 12, 2024

April’s monthly option expiration is generally bullish across the board with respectable gains on the last day of the week, the entire week, and the week after. Since 1982, DJIA and S&P 500 have both advanced 27 times in 42 years on expiration day with average gains of 0.22% and 0.17%, respectively. Monthly expiration day was staging a comeback after four or five declines from 2014 to 2018 but took a hit in 2022’s bear market. Expiration week has a bullish track record over the past 42 years. Average weekly gains are right around 1% for S&P 500, DJIA and NASDAQ. The bullish bias of April monthly expiration also persists during the week after although average gains have not been as strong with selling pressure rising recently (since 2014).


Read Full Story »»»
DiscoverGold
Corporate Insider Velocity indicator: Extremes and/or reversals in corporate insider activity often highlight potential opportunities for alert investors
By: SentimenTrader | April 11, 2024
• Corporate Insider Velocity indicator. Extremes and/or reversals in corporate insider activity often highlight potential opportunities for alert investors.

Read Full Story »»»
DiscoverGold
1Q24 Earnings Season Begins Amidst Collapse In Bearish Sentiment And More Or Less Sideways S&P 500
By: Hedgopia | April 12, 2024
The earnings season is upon us. The bar is low. With the S&P 500 sideways in recent weeks after a massive rally since last October, better results can help the index push through short-term resistance, but building on the gains will be tough, as bearish sentiment has collapsed.
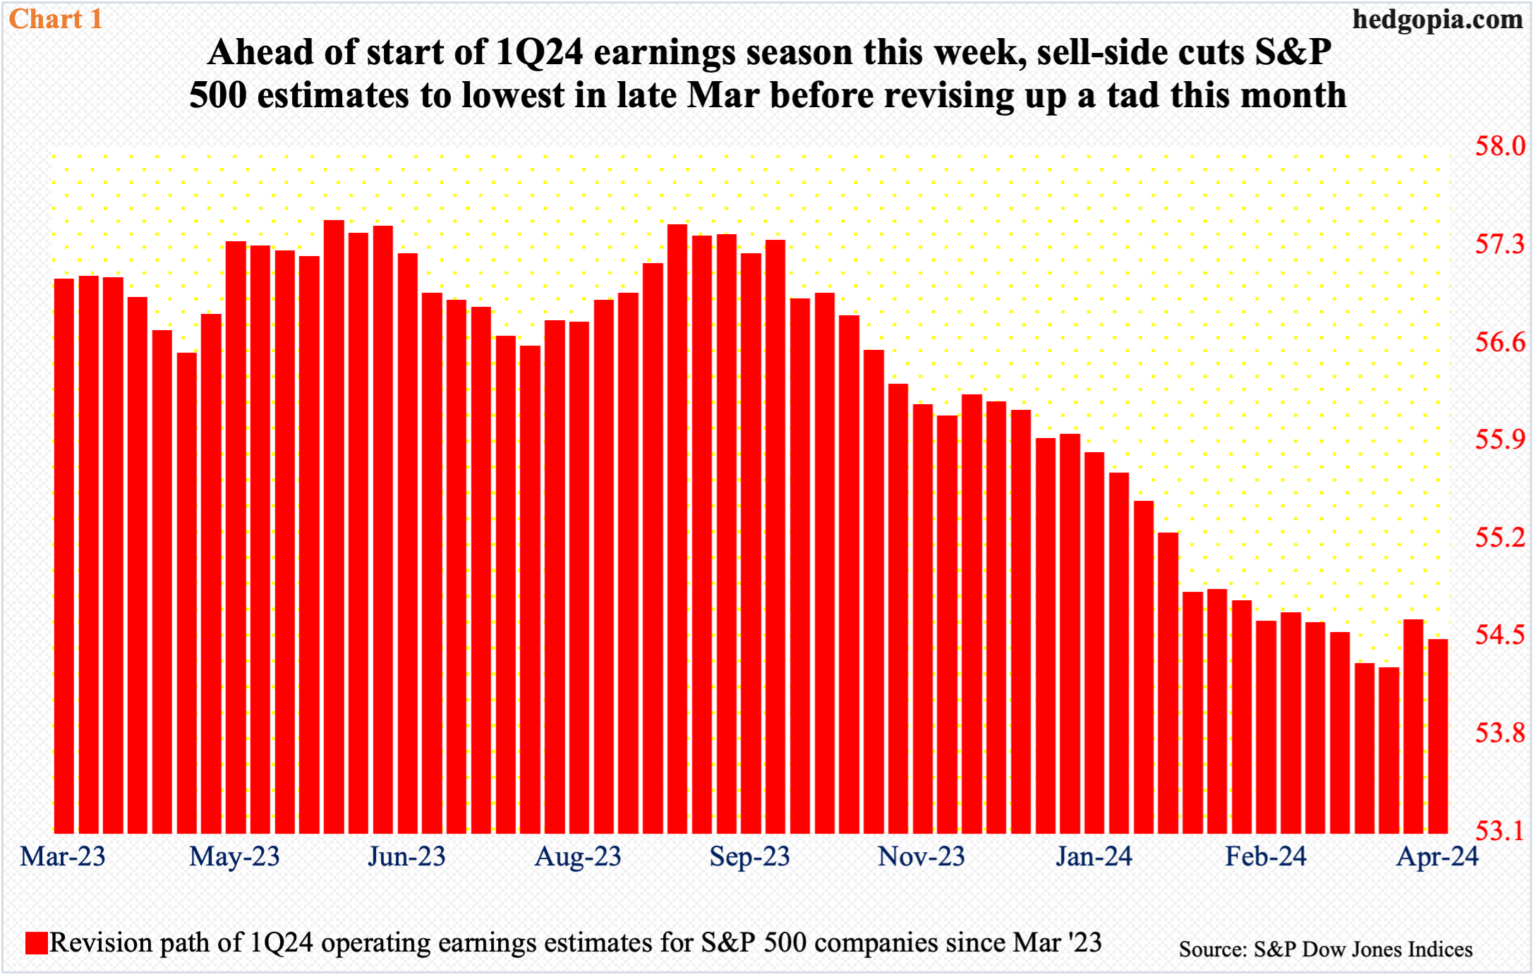
The March-quarter earnings season begins in earnest later this morning. Customarily, financials will get the ball rolling, with results from JP Morgan (JPM), Citigroup (C) and Wells Fargo (WFC) in the dock. Leading into this, the revision trend is decidedly down. Estimates for all these three are lower from even a week ago.
This is also true for the entire S&P 500. As of Tuesday, operating earnings estimates for these companies stood at $54.45 – up slightly from $54.25 as of March 27th but down from a high of $57.45 as of May 30th last year (Chart 1).
Once again, the sell-side habitually has lowered the bar ahead of the season.
Stocks act as if they are low enough the companies in the aggregate will be able to meet/beat.
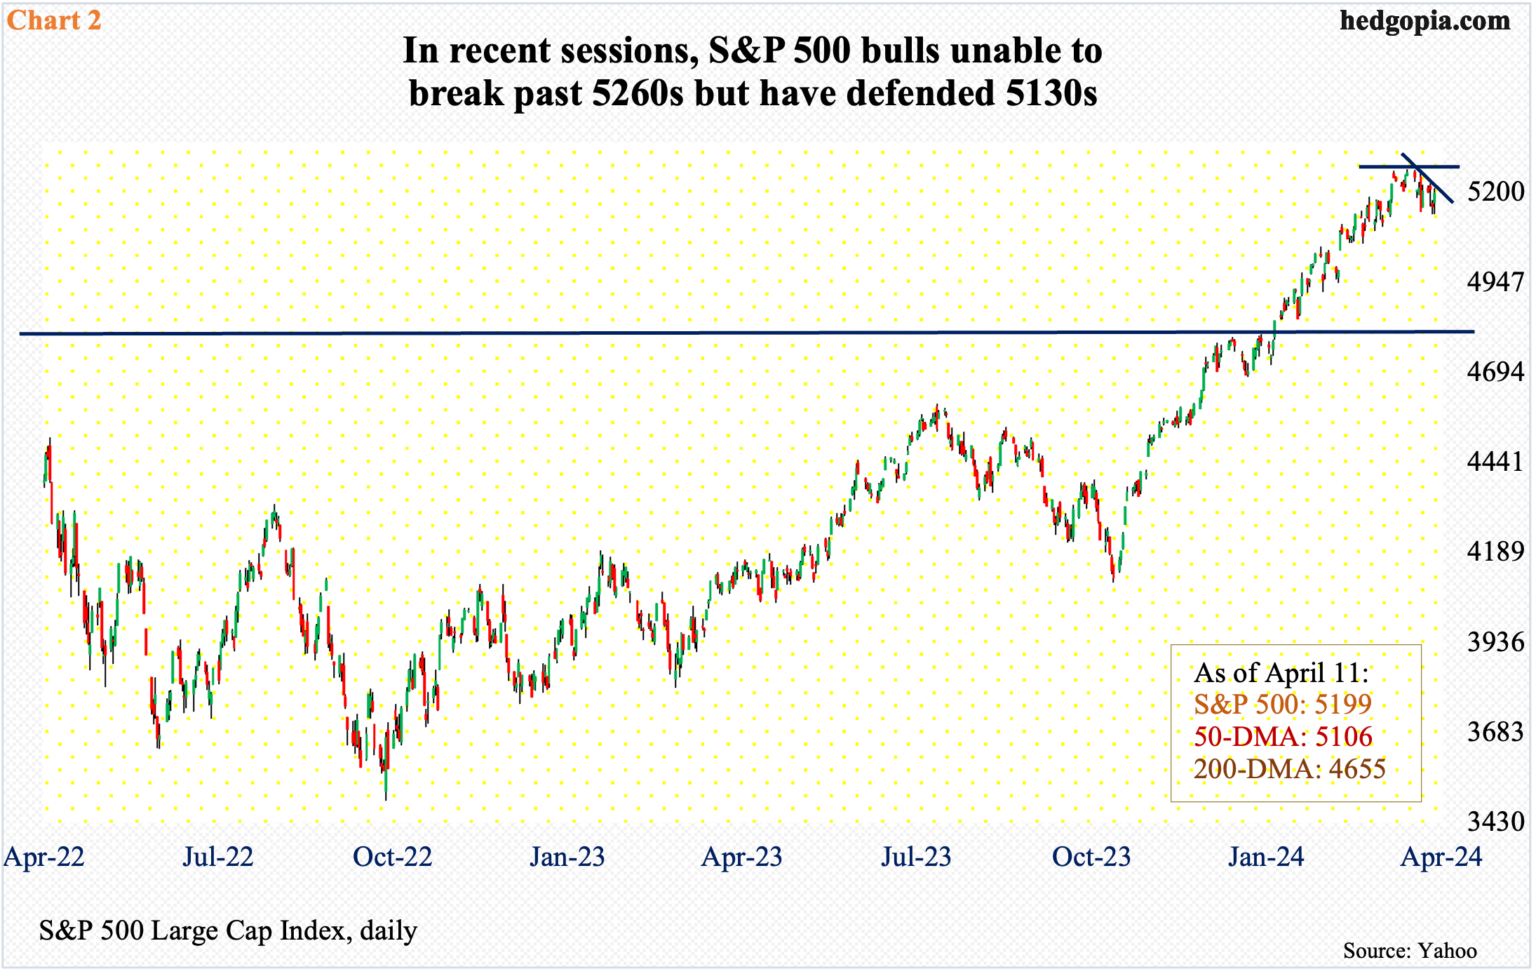
The S&P 500 peaked on March 28th at 5265. In three sessions between March 21st and April 1st, the large cap index touched 5260s but only to then retreat. Equity bears, however, have not been able to make much of the subsequent drop.
On both Wednesday and Thursday this week, bids showed up at 5139, with the latter session ending up 0.7 percent to 5199. Bulls stepped up to the plate just above the 50-day; the last time the index closed below the average was early November last year, with an important bottom having been reached only a few sessions ago in October.
As things stand, unless earnings disappoint big time, bulls should fight tooth and nail to save the average. In fact, the S&P 500 has trended lower along a line month-to-date, with Thursday closing right on/underneath it (Chart 2). Concurrently, shorter-term averages (10, 20) are on the verge of a cross-down, which, should one unfold, will embolden the bears.
Hence the importance of this morning’s results from the banks. A trendline breakout will mean the bulls will get another shot at 5260s. And this would have come at a time when there are fewer and fewer bears around.
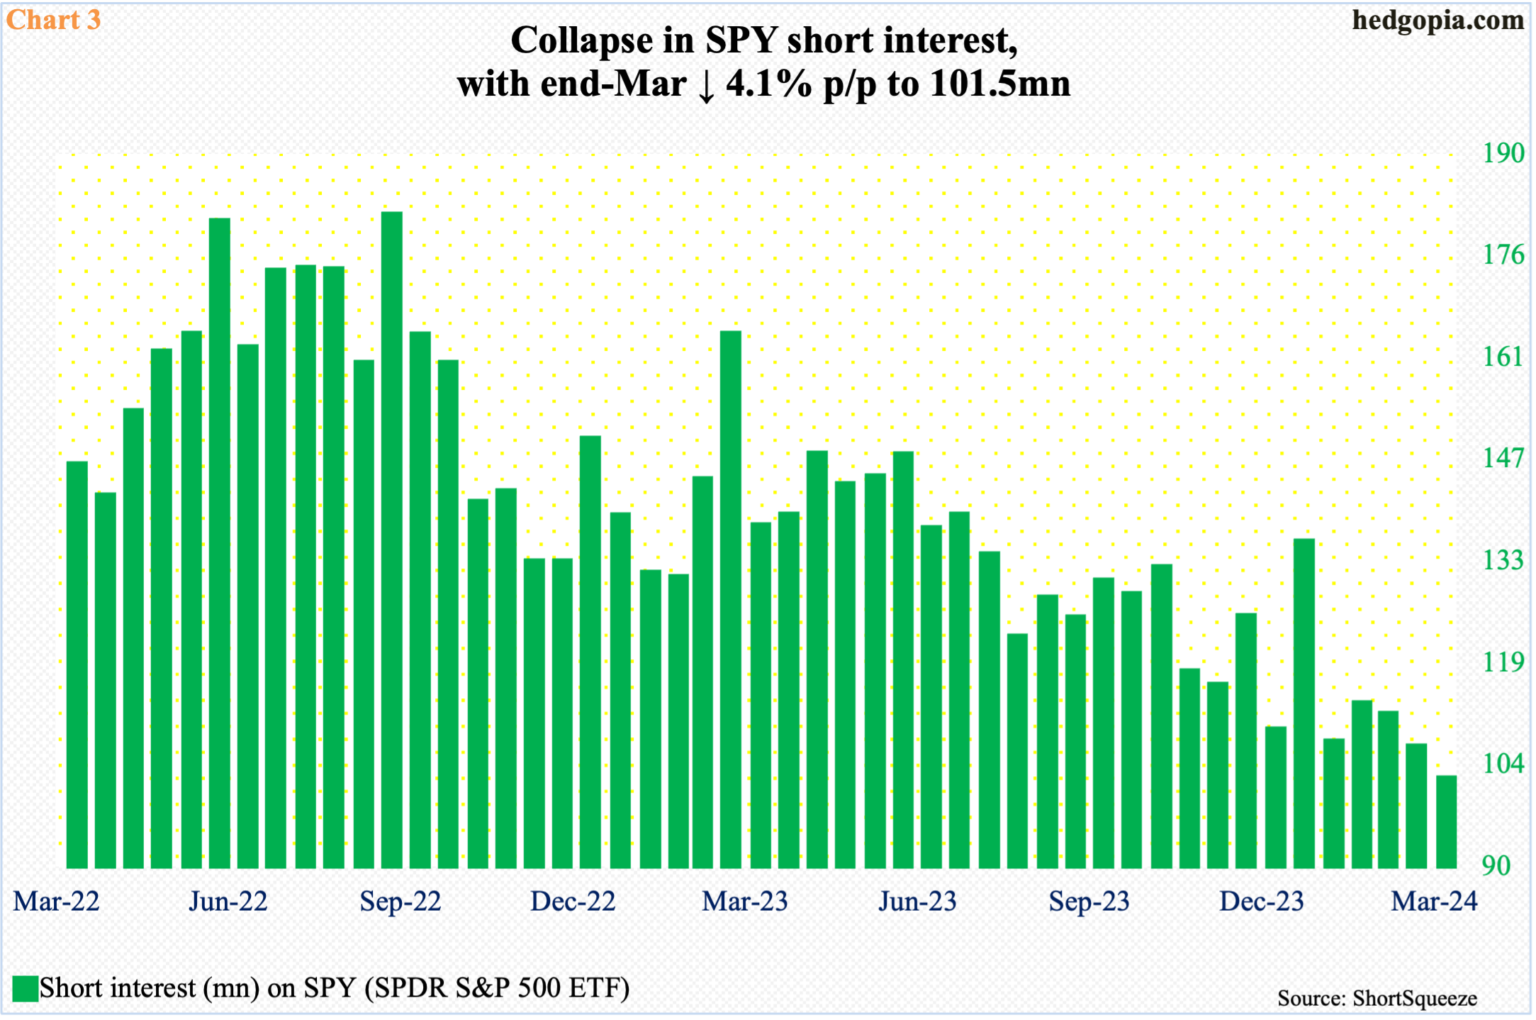
At the end of March, short interest on SPY (SPDR S&P 500 ETF) was only 101.5 million (Chart 3). This is nothing but an absolute collapse in bearish sentiment. At the middle of September 2022, short interest was 180.5 million – shortly before the S&P 500 reached a major bottom in October. This has been quite a squeeze since.
This also means that the bulls will not be benefiting from a squeeze tailwind going forward; or, if they did, it will be increasingly trivial.
Read Full Story »»»
DiscoverGold
$SPY Millions Worth of OTM Puts Flooding the Tape
By: Cheddar Flow | April 12, 2024
• $SPY Millions Worth of OTM Puts Flooding the Tape

Read Full Story »»»
DiscoverGold
The 10 Top/Bottom NASDAQ 100 Index percent net change performers
By: Thom Hartle | April 12, 2024
• Today (8:34 CST), the 10 top/bottom percent net change performers in the NASDAQ 100 Index.

Read Full Story »»»
DiscoverGold
Markets Monthly Pattern »» Watchlist - Top 10
By: Marty Armstrong | April 12, 2024
• Dow Jones Industrials Index »» Pendulum Swing to Downside
• NASDAQ Composite Index »» New Pattern Forming
• NASDAQ 100 Index »» New Pattern Forming
• S&P 500 Index »» Turning BACKDOWN
• Russell 2000 Index »» Turning BACKDOWN
• US Dollar Index »» New Pattern Forming
• CBOE VIX Index »» Temp High
• NY Gold Futures »» Pressing Higher
• NY Silver COMEX Futures »» Temp High
• NY Crude Oil Futures »» New Pattern Forming
DiscoverGold
2023 Q4 Earnings Analysis and Projections Through 2024 Q4
By: Carl Swenlin | April 11, 2024
S&P 500 earnings are in for 2023 Q4, and here is our valuation analysis.
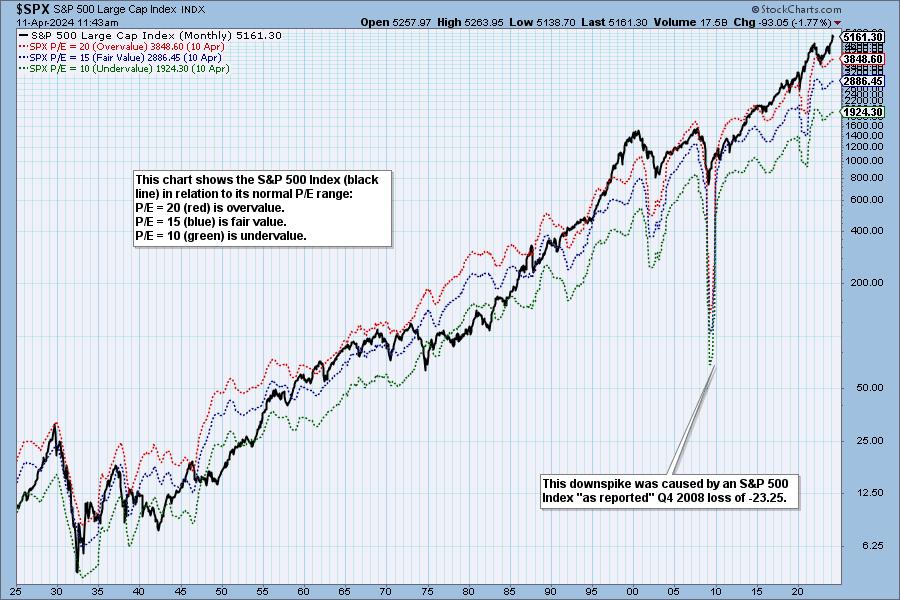
The following chart shows the normal value range of the S&P 500 Index, indicating where the S&P 500 would have to be in order to have an overvalued P/E of 20 (red line), a fairly valued P/E of 15 (blue line), or an undervalued P/E of 10 (green line). Annotations on the right side of the chart show where the range is projected to be based upon earnings estimates through 2024 Q4.
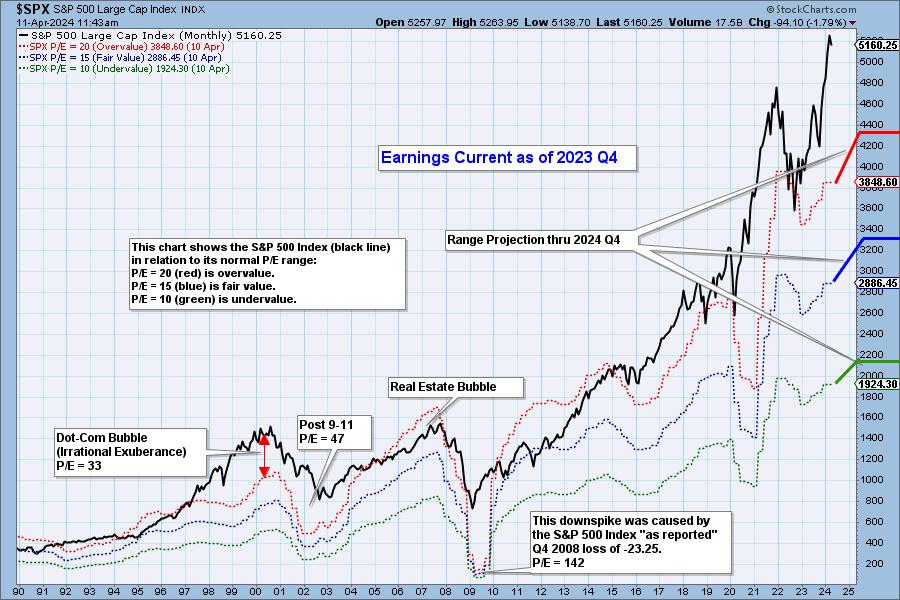
Historically, price has usually remained below the top of the normal value range (red line); however, since about 1998, it has not been uncommon for price to exceed normal overvalue levels, sometimes by a lot. The market has been mostly overvalued since 1992, and it has not been undervalued since 1984. We could say that this is the "new normal," except that it isn't normal by GAAP (Generally Accepted Accounting Principles) standards.
We use GAAP earnings as the basis for our analysis. The table below shows earnings projections through December 2024. Keep in mind that the P/E estimates are calculated based upon the S&P 500 close as of December 29, 2023. They will change daily depending on where the market goes from here. It is notable that the P/E is outside the normal range.
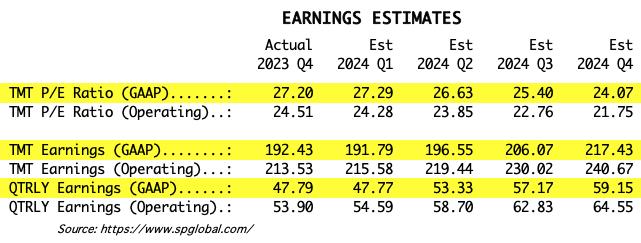
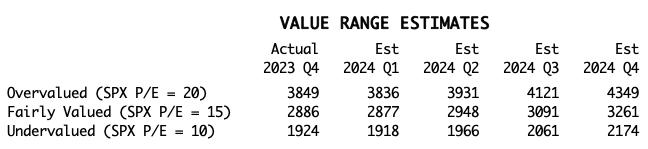
The following table shows where the bands are projected be, based upon earnings estimates through 2024 Q4.
This DecisionPoint chart keeps track of S&P 500 fundamentals, P/E and yield, and it is updated daily -- not that you need to watch it that closely, but it is up-to-date when you need it.
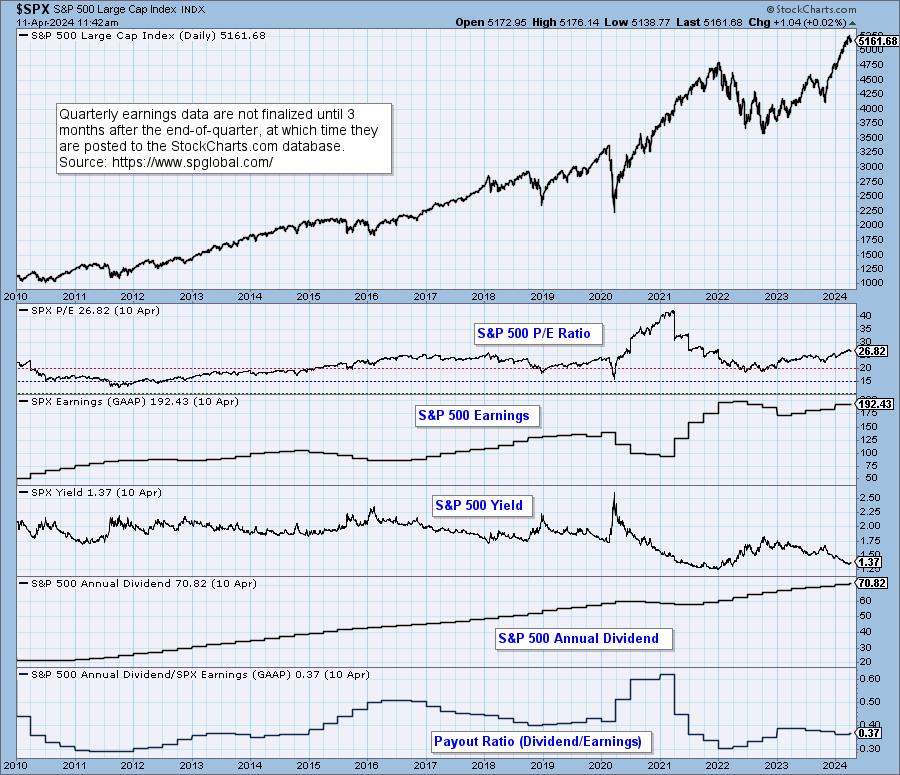
CONCLUSION: The market is still very overvalued and the P/E is still above the normal range. Earnings have ticked up, are trending up, and are estimated to be higher through the end of this year. Being overvalued doesn't require an immediate decline to bring valuation back within the normal range, but high valuation applies negative pressure to the market environment.
Read Full Story »»»
DiscoverGold
Money managers Reduced their exposure to the US Equity markets since last week...
DiscoverGold
NAAIM Exposure Index
April 11, 2024 
The NAAIM Number
81.92
Last Quarter Average
87.84
»»» Read More…
The 10 Top/Bottom S&P 500 Index percent net change performers
By: Thom Hartle | April 11, 2024
• Today (8:34 CST), the 10 top/bottom percent net change performers in the S&P 500 Index.

Read Full Story »»»
DiscoverGold
The AAII Investor Sentiment
By: AAII | April 11, 2024
Bullish 43.4%
Neutral 32.5%
Bearish 24.0%
• Historical 1-Year High
Bullish: 52.9%
Neutral: 39.5%
Bearish: 50.3%
Read Full Story »»»
DiscoverGold
Did the NASDAQ 100 Top in March?
By: Dr. Arnout Ter Schure | April 10, 2024
• A break below $17300 is still needed to confirm the top, but for now, the weight of the evidence looks Bearish and suggests a trip to $15900+/-200 should be expected.
The Recent All-time High Was Made Three Weeks Ago
In our previous update from late March, see here, we assessed where the NASDA100 (NDX) could ideally top using the Elliott Wave Principle (EWP), and we postulated back then:
“…When we assess the daily chart, see Figure 2 above, we find that the typical W-5 = W-1 relationship targets ~$18615, …, the colored dotted lines are the warning levels that will tell us if the uptrend is in jeopardy. The Bulls’ 1st warning is the blue level at $18,3000. The 2nd warning is the grey level at $18000, etc. This means that below the red warning level (the green W-4 low), the black W-4? is underway to ideally NDX15900+/-200.”
Fast-forward: The index peaked at $18464 on March 21, which is only 0.81% below the ideal target of ~$ $ $18615 and has declined since. The index has now broken below two of the four colored warning levels for the Bulls we had identified ($18300, $18000, $17750, $17300), as it is currently trading at $17980.
Moreover, it has lost the (green) 20-day Simple Moving Average (d SMA) but is sitting right at the 50d SMA. Besides, all the technical indicators (TIs) are pointing lower and are on a sell, adding weight to the Bearish evidence. However, it is still above the Ichimoku Cloud and 200d SMA. See Figure 1 below. Thus, although the weight of the evidence is Bearish, the index has yet to break below $17750. When it does that, it increases the odds it topped for the potential black W-3 in March and is heading for the ideal black W-4? target zone of $15900+/-200.
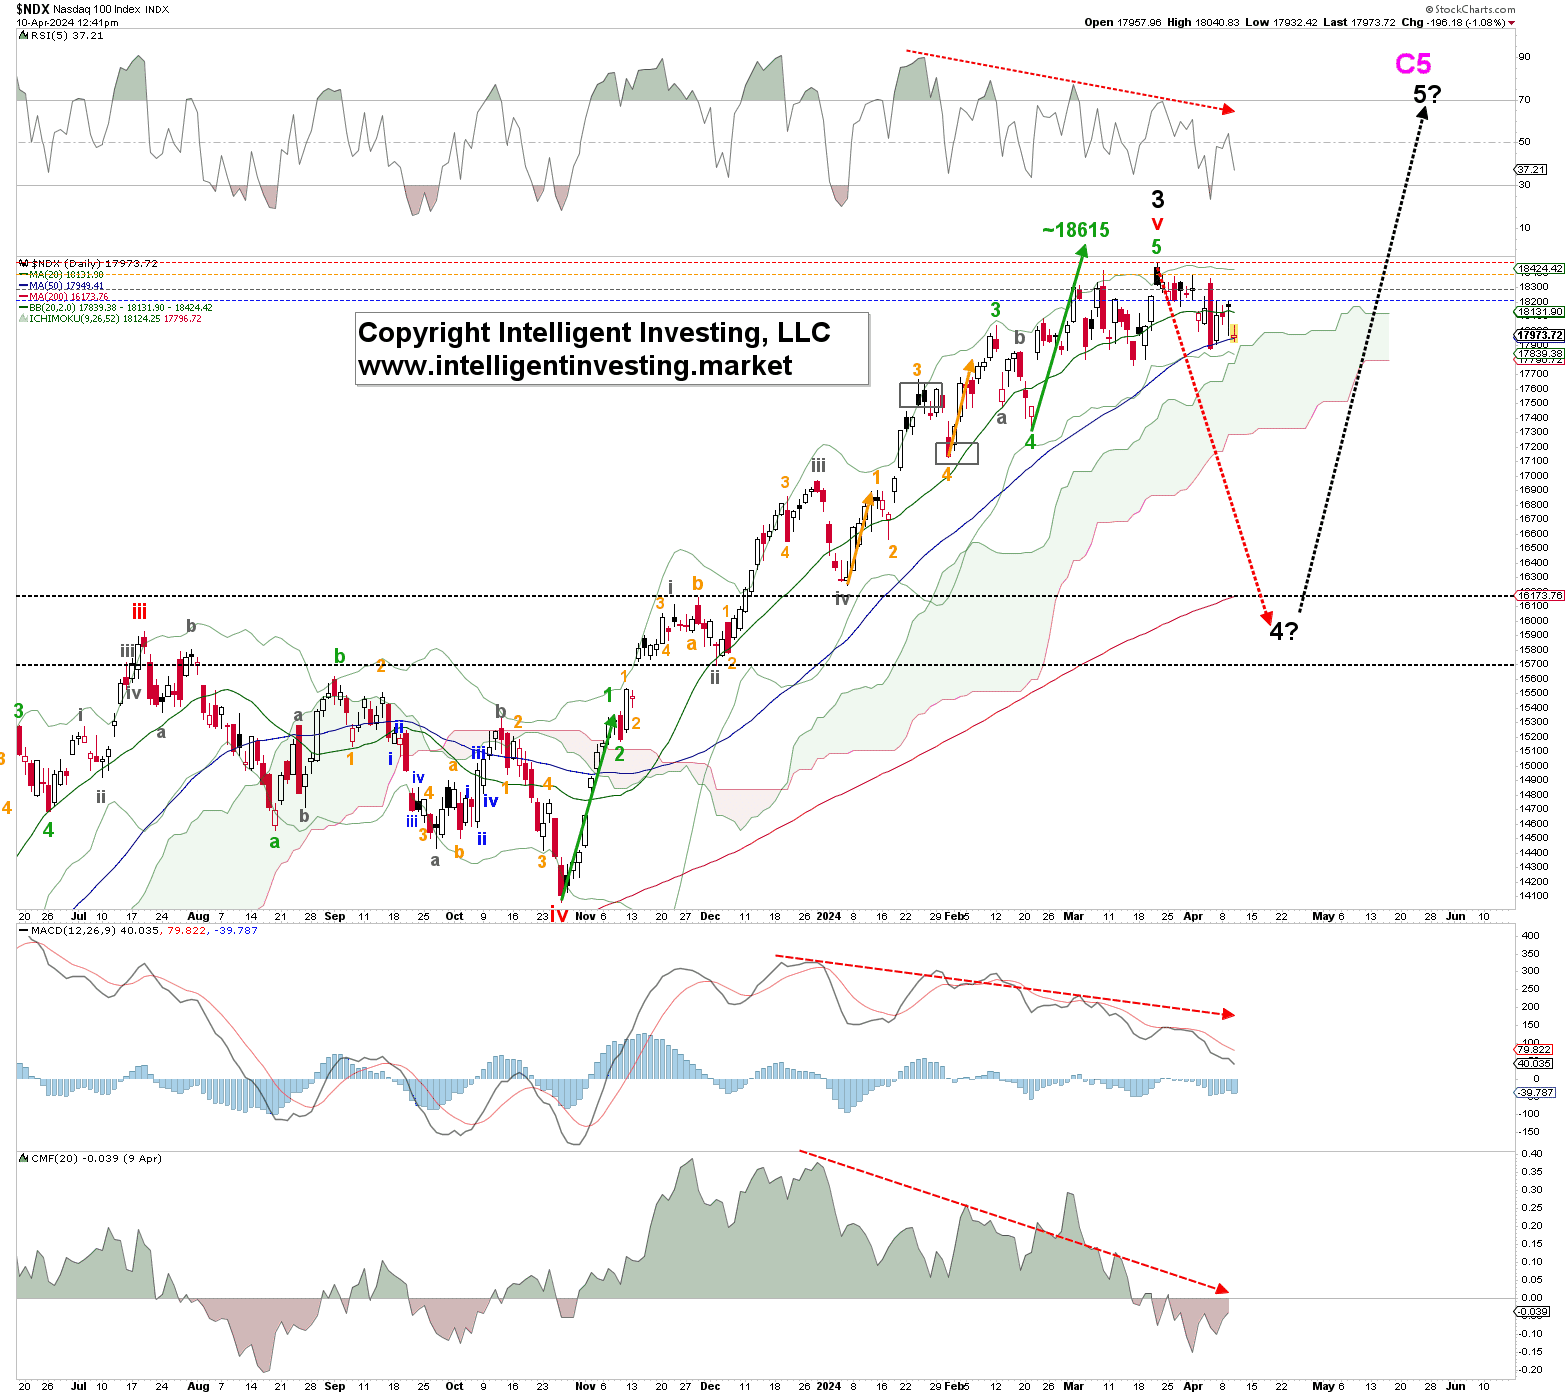
Figure 1. NDX daily chart with detailed EWP count and technical indicators
Thus, our preferred EWP count is for a larger top to have formed, contingent on holding below the colored warning levels shown in Figure 1 above.
The Bulls Have One Last Option Left
However, in a five-wave ending diagonal, the wave structure is most often a 3-3-3-3-3 count as all five of the waves of an ending diagonal break down to only three waves each, indicating exhaustion of the trend. Also, Wave 3 is not the shortest, and Wave 1 and Wave 4 may overlap.
Most ending diagonals have a wedge shape where they fit within two converging lines. In Figure 2 below, we can see that the possible W-i, ii, iii, and iv thus far are all made up of three waves and that W-iv overlapped with W-i, whereas the two grey trend lines thus far contain the price action.
Thus, our alternate EWP count is that the price action is ticking off all the boxes for an ending diagonal, contingent on holding above the colored dotted warning levels. These levels are so close to the current price that the Bulls are walking a tightrope while playing with fire, which is why we view it currently as our alternative.
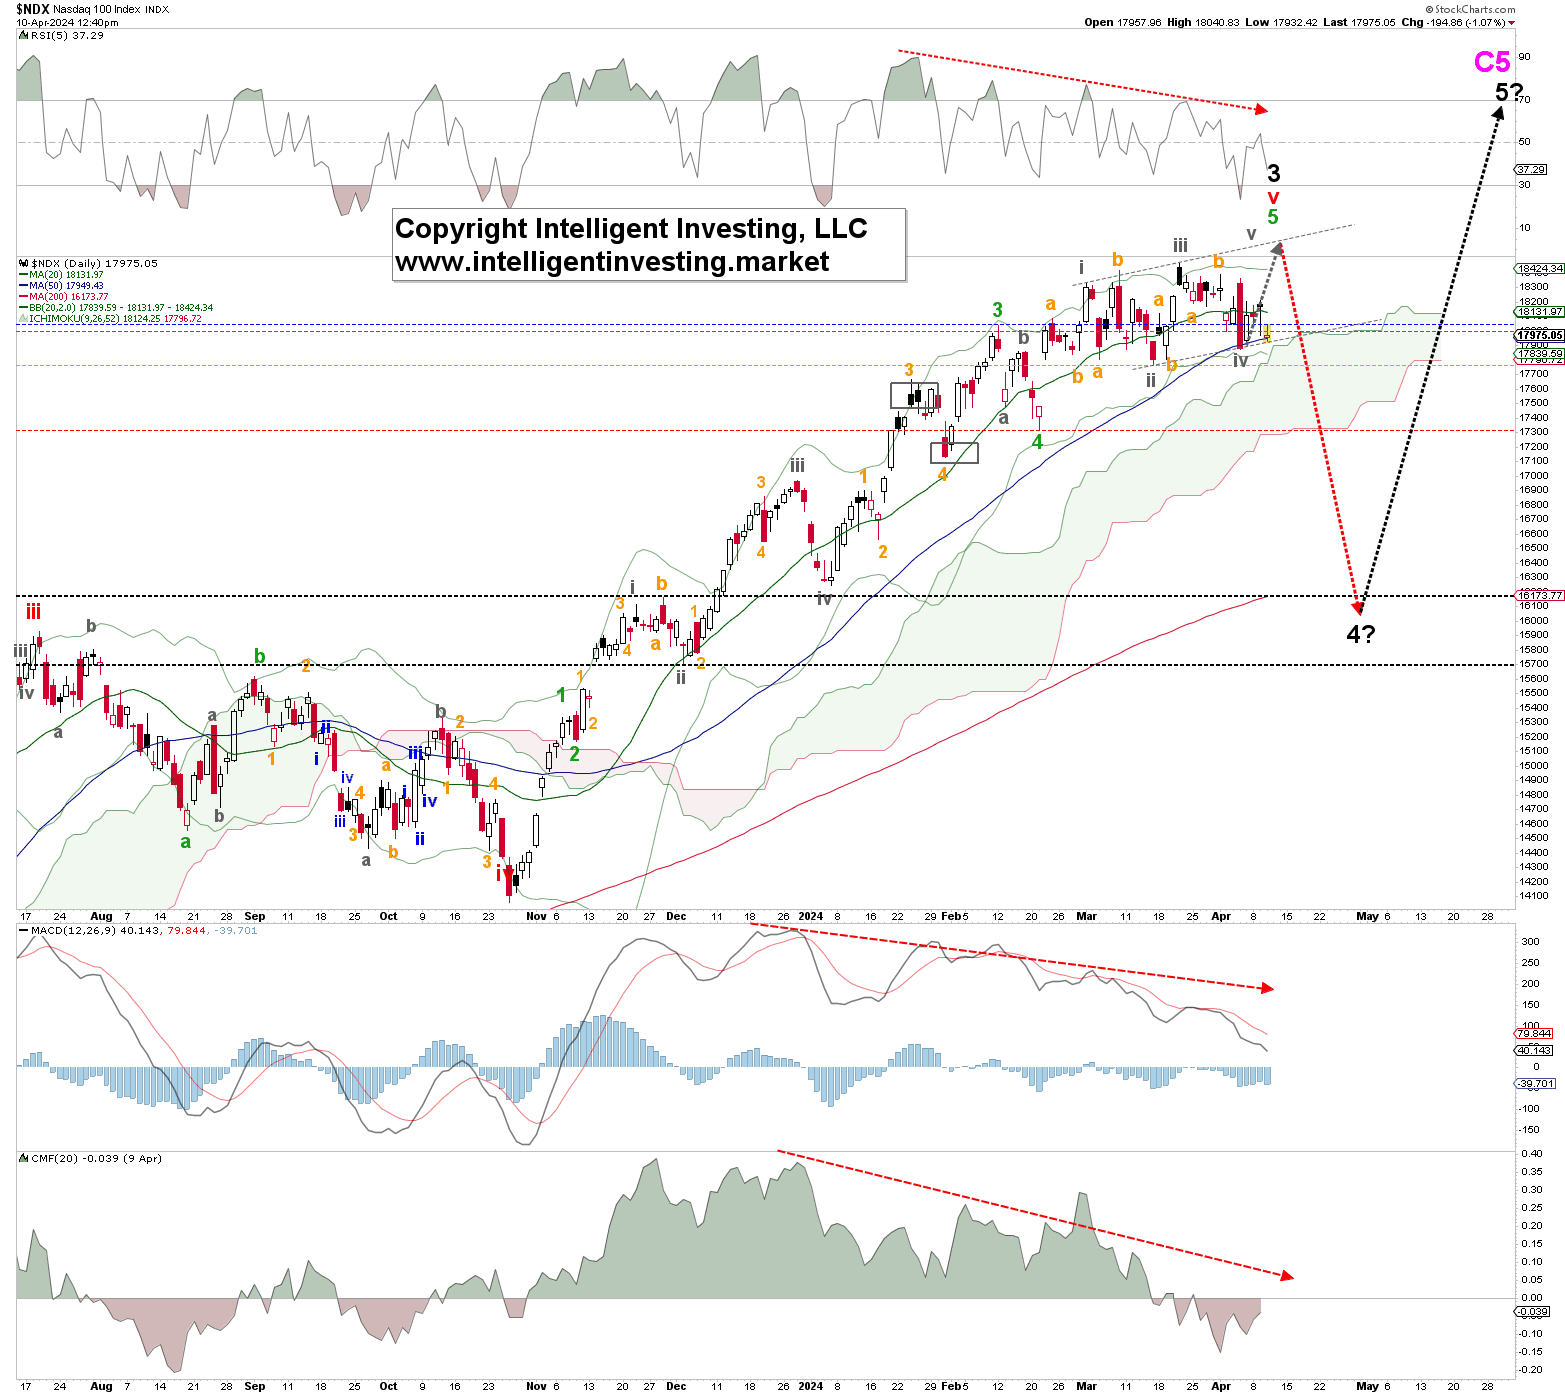
Figure 2. Daily NDX chart with detailed EWP count and technical indicators
Moreover, even if we see a last grey W-v materialize to ideally $18615, the black W-4? still looms after it. Thus, that would make for a 640p reward vs. a 2000p risk—something to consider. Lastly, please note that a break below the October 2023 low tells us the bull market is over.
Read Full Story »»»
DiscoverGold
$SPY & $QQQ Millions worth of more OTM Puts. They have been buying these all day
By: Cheddar Flow | April 10, 2024
• $SPY & $QQQ Millions worth of more OTM Puts
They have been buying these all day

Read Full Story »»»
DiscoverGold
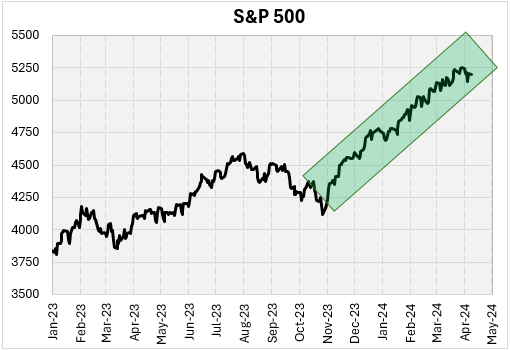
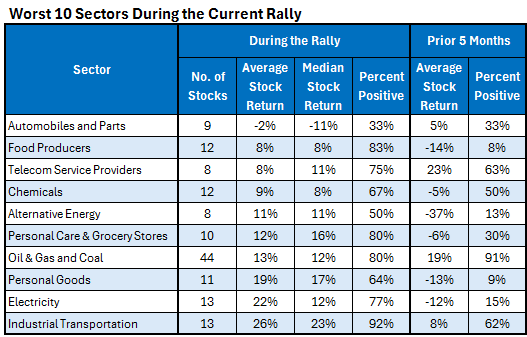
How SPX Sectors Performed During the Rally
By: Schaeffer's Investment Research | April 10, 2024
• Breaking down the 20 sectors that made outsized moves during the recent rally
• Plus, how options traders responded to the movements
Over the last five months, stocks have been remarkably strong. Since the S&P 500 Index (SPX) bottomed in late October of last year, the broader-market index has gained over 25%. I’ve written a few articles over the past several weeks about strength in stocks. This week, I’m going to focus on sector performance during this rally. I’ll also see what option buyers have been doing during this rally compared to the timeframe just before the rally.
BEST & WORST SECTORS DURING THE RALLY
Using a list of stocks that have decent option liquidity, I separated the them into 27 sectors and summarized the returns since the start of the current rally. The table below lists the 10 sectors with the highest average stock return.
Biotech stocks lead the way, but the average is skewed by some huge individual stock returns. Note that the median return for that sector is the lowest in the table. Also, in the table, I summarized the returns for the five months before the rally. Specifically, it looks at the return from the beginning of June until Oct. 27, the low point on the SPX in October. The biotech names struggled in the period leading up to the rally.
Banks and brokerages listed in the table have also performed well. Those two sectors consist of 39 stocks combined. All 39 stocks have been positive during the rally. Real estate investment trusts (REIT) is a sector that did not crack the top 10 in average return, but does consist of 12 stocks that were all positive (they ranked 11th with an average return of 34%). It seems you could not have gone wrong with anything in the financial realm over the past five months.

This next table shows the 10 worst sectors during the current rally. The automobiles and parts sectors is the only sector in which the stocks averaged a negative return. They averaged a 2% loss, with just three of nine stocks in that sector positive. The worst sector during the five months preceding the rally was the alternative energy sector, which averaged a 37% loss during those prior five months. It’s also been one of the worst sectors during the current rally. The eight stocks in that sector meeting the option liquidity criteria averaged an 11% return, with half of the stocks positive.
HOW HAVE OPTIONS TRADERS REACTED?
The table below shows the 10 best sectors by average stock return. So, it’s the same sectors as the first table above. The data gives a good idea about how option buyers have behaved recently during the rally compared to before the rally. I used buy-to-open (BTO) option volume which only considers option volume initiated by buyers. Looking at the pharma and biotech sector (the first row), calls were bought heavily compared to puts during rally. The BTO call/put ratio during the rally was 2.74. In the five months before the rally, calls and puts were bought almost evenly. The last column shows the volume during the rally was 12% higher than the five months before the rally (the ratio is 1.12).
Two of the sectors, despite these being the best sectors during the rally, showed fewer calls relative to puts during the rally. Those are the industrial metals and mining sector and consumer services.

Finally, this last table shows the 10 worst performing sectors during the rally. The worst performing sector has been the automobiles and parts sector. Option buyers haven’t changed their behavior much for these stocks. There has been about 10% less volume with the BTO call/put ratio being almost identical during the rally to the five months preceding the rally.
There was a huge increase in BTO option volume for the chemicals sector. Volume increased about 50% and calls have gotten popular compared to puts. The BTO call/put ratio was 1.05 in the five months before the rally but during this rally the ratio has been 2.21.

Read Full Story »»»
DiscoverGold
Markets Monthly Pattern »» Watchlist - Top 10
By: Marty Armstrong | April 10, 2024
• Dow Jones Industrials Index »» Possible Important High
• NASDAQ Composite Index »» Still BULLISH
• NASDAQ 100 Index »» Still BULLISH
• S&P 500 Index »» Still BULLISH
• Russell 2000 Index »» Turning Back Down
• US Dollar Index »» Pressing Higher
• CBOE VIX Index »» Temp High
• NY Gold Futures »» Pressing Higher
• NY Silver COMEX Futures »» Temp High
• NY Crude Oil Futures »» Possible Temp High, New Highs Still Possible
DiscoverGold
$SPY Large $2.7M Far OTM Put Buyer. This is an aggressive bet that expires in 1.5 months and is above the ask
By: Cheddar Flow | April 10, 2024
• $SPY Large $2.7M Far OTM Put Buyer
This is an aggressive bet that expires in 1.5 months and is above the ask

Read Full Story »»»
DiscoverGold
AI-generated Buy and Sell Daily Signals
By: Hedgeye | April 10, 2024

Read Full Story »»»
DiscoverGold
Best Six Months Rally Respite Underway April Tracks Election Year Seasonality
By: Almanac Trader | April 9, 2024

It’s been a banner “Best Six Months (BSM)” (November-April) for the Dow and S&P 500. From our Seasonal MACD Buy Signal on October 9, 2023, through our April 2, 2024 Seasonal MACD Sell Signal), DJIA gained 16.6%, S&P 500 20.1% – double the historical average BSM gains. These big gains have not left much on the table until later this year.
Risks are more elevated now. Sentiment continues to run high. Valuations are extended. Geopolitical tensions have not eased. And persistent inflation pressures have the Fed in no rush to cut rates. As the election campaign rhetoric heats up and the Best Six Months comes to a close, we are shifting to a more cautious stance.
As you can see in the chart of April 2024 compared to election year Aprils since 1950 the market is tracking the softer election year April pattern.
Read Full Story »»»
DiscoverGold
$SPY Large $2.4M OTM Call
By: Cheddar Flow | April 9, 2024
• $SPY Large $2.4M OTM Call
This is a highly unusual print that is betting on aggressive continuation to bullish momentum
*Above the Ask*

Read Full Story »»»
DiscoverGold
$SPX: Small speculators are wildly bullish. An absurdly small sample size from this particular indicator, so NOT a “sell signal” IMO. But perhaps a good place to invoke…
By: Jay Kaeppel | April 9, 2024
• Small speculators are wildly bullish. An absurdly small sample size from this particular indicator, so NOT a “sell signal” IMO. But perhaps a good place to invoke…

Read Full Story »»»
DiscoverGold
Today, the equal-weight S&P 500 fund $RSP will celebrate its 100th consecutive session levitating above its 50-day moving average...
By: Jason Goepfert | April 9, 2024
• Today, the equal-weight S&P 500 fund $RSP will celebrate its 100th consecutive session levitating above its 50-day moving average.
It's done this only 4 times in its history.
All good things come to an end.

Read Full Story »»»
DiscoverGold
S&P 500: With a reading of 87.86, the US stock market remains overbought, which is raising concerns among some investors who foresee a possible correction in the near future
By: Isabelnet | April 9, 2024
• With a reading of 87.86, the US stock market remains overbought, which is raising concerns among some investors who foresee a possible correction in the near future.

Read Full Story »»»
DiscoverGold
S&P 500: An increase of 25% or more in the S&P 500 within 100 days (using the first signal in a cluster) suggests a positive outlook for the next 12 months, historically resulting in a median gain of 13.4% since 1950
By: Isabelnet | April 9, 2024
• An increase of 25% or more in the S&P 500 within 100 days (using the first signal in a cluster) suggests a positive outlook for the next 12 months, historically resulting in a median gain of 13.4% since 1950.

Read Full Story »»»
DiscoverGold
The 10 Top/Bottom NASDAQ 100 Index percent net change performers
By: Thom Hartle | April 9, 2024
• Today (8:33 CST), the 10 top/bottom percent net change performers in the NASDAQ 100 Index.

Read Full Story »»»
DiscoverGold
AI-generated Buy and Sell Daily Signals
By: Hedgeye | April 9, 2024

Read Full Story »»»
DiscoverGold
$SPX 5200 is acting as a magnet level with the enormous options positioning at that strike across puts and calls
By: Markets & Mayhem | April 8, 2024
• $SPX 5200 is acting as a magnet level with the enormous options positioning at that strike across puts and calls.

Read Full Story »»»
DiscoverGold
Most Oversold Stocks coming into the week - $LULU $MCD $NKE $SBUX $ULTA making the list
By: Barchart | April 8, 2024
• Most Oversold Stocks coming into the week - $LULU $MCD $NKE $SBUX $ULTA making the list.

Read Full Story »»»
DiscoverGold
With a current value of 88.27, the Market Greed/Fear Index indicates an extreme level of greed within the US stock market, potentially leading to concerns about overconfidence
By: Isabelnet | April 8, 2024
• Sentiment
With a current value of 88.27, the Market Greed/Fear Index indicates an extreme level of greed within the US stock market, potentially leading to concerns about overconfidence.

Read Full Story »»»
DiscoverGold
S&P 500 after ending streak of >1 year without a -2% daily change
By: Jason Goepfert | April 8, 2024
• While some consider this frivolous trivia, I disagree.
It incorporates investor tendencies during and after periods of high momentum and low volatility.
And when these environments ended, they preceded losses of more than -10% within the next 6 months only once.

Read Full Story »»»
DiscoverGold
2 Indicators Pointing at Potential Volatility Ahead
By: Schaeffer's Investment Research | April 8, 2024
• Traders should be open to unusually large moves higher or lower this week
• The SPX channel depends on a "glass half empty" or glass half full" mindset
“There appears to be sideways action in the SPX 5,235 and 5,250 area, with the former level representing 10% above last year’s close… With respect to levels of support to watch if sellers overwhelm buyers in the near term, I recommend focusing on two levels, both of which are moving targets. The first is the bottom rail of the bullish channel connecting higher lows since mid-January, which comes into the week at 5,190, but will be at 5,225 on Friday. Another level of potential support is the SPX’s 30-day moving average, which is at 5,130 now and projected to be at 5,175-5,180 by week's end. ”
-Monday Morning Outlook, April 1, 2024
If you have been following this commentary over the past few weeks, I have been quantifying the momentum backdrop we have seen in the stock market -- measured by the S&P 500 Index’s (SPX – 5,204.34) impressive rise since late October -- in addition to potential points of resistance, such as the level that is exactly 10% above last year’s close, or 5,235.
Per the chart below, that area indeed came into play as resistance. Additionally, a bull channel began to become evident. I have mentioned the 30-day moving average as well, which contained the mid-January low. I find this interesting because it is not on the radar of most technicians, who focus on the more popular 20-day moving average.
When assessing last week’s price action, in a week that saw Federal Reserve funds futures participants push the odds of an interest rate cut in June from slightly more than a coin flip to slightly less than coin flip, one can either take a “glass half empty” or “glass half full” approach.
The former refers to the break of channel support on Thursday, which was attributed to a Fed president (who is not a voter in the monetary policy setting committee) floating the idea of no rate cuts this year. In fact, Friday’s intraday high at 5,225 was at the bottom rail of this channel.
The “glass half full” approach points to the SPX holding -- at least for now -- the 30-day moving average (at 5,160), a trendline that marked a solid buying opportunity in January.

This channel break is noteworthy because it could be suggesting that, at the very least, momentum has slowed. If the SPX quickly makes a bold move above the bottom-rail of the channel, it will confirm the 30-day moving average hold and give bulls renewed hope for more pain in the weeks ahead for bears.
Coincidentally, the bottom rail of the channel begins the week at 5,235, which is a level that coincides with 10% above the 2023 close. This channel ends the week at 5,271, which means a new high could be achieved this week, even with the SPX below the bottom rail of the channel.
Bulls should also take note of the CBOE Market Volatility Index’s (VIX – 16.01) move above 15.40, which is half the 2023 high and an area that has marked multiple peaks this year. With two closes comfortably above 15.40, be open to the possibility that the VIX is hinting at higher volatility ahead, which could mean coincidental weakness in equities.

“There was a short interest build in the second half of 2021 as stocks rallied, and this preceded notable weakness in the market from the start of 2022 that lasted into the fourth quarter of 2022. As such, it is not a given that the market will soar to new highs amid this seemingly bullish backdrop. ”
-Monday Morning Outlook, April 1, 2024
In last week’s commentary, I noted the short interest build that occurred in the first half of March. On the surface, this is bullish. But as I noted last week, if weakness in the market is in the cards, the shorts could become more aggressive and therefore add to selling.
On one hand, depending on how shorts react, they could use last week’s decline to cover losing positions, keeping pullbacks mild-natured. Or they may wait and look for opportunities to feed on additional weakness, as witnessed in 2022.
Something that intrigued me last week was Thursday’s candle, which happened on the day the bottom of the bull channel was breached. It was a bearish outside day, in which both the high and low were above the prior day’s high and low, with the close below the prior day’s low.
In fact, the SPX opened more than 0.5% higher that day and closed lower by over a percentage point. In other words, it covered a big distance from the open to the close.
I asked Rocky White, our Senior Quantitative Analyst, to investigate prior instances of this happening. Using data since 1998, he found this to be a rare occurrence, with only seven prior events and the first happening in 2008.
The good news is this signal is not overwhelmingly bearish, but the bad news is that it does hint at volatility ahead, as the VIX is currently suggesting. Note that in the five, ten, and 21 days after the SPX opens by 0.5% or higher, it closes more than one percentage point lower relative to the prior day. The average move higher is greater the average in these periods, but the average move lower is also greater than the average for these periods.
As such, if you are trading in these time frames, be open to unusually large moves higher or lower. With Fed minutes due out this week, there could be additional volatility. But for bulls, the good news is that the last time a candle occurred with the market near all-time highs was December 2021. The market was higher by four percent five and ten days later, and higher by nearly 6%, using a one-month measuring period.

Read Full Story »»»
DiscoverGold
|
Followers
|
180
|
Posters
|
|
|
Posts (Today)
|
0
|
Posts (Total)
|
68362
|
|
Created
|
06/10/03
|
Type
|
Free
|
| Moderators DiscoverGold | |||
:::::::::::: Welcome to S&P 500 & Nasdaq Analysis and Trends :::::::::::::
• The purpose of this board is to help others with Short & Long term S&P 500 & Nasdaq analysis and direction.
• This is strickly an educational board helping traders to learn market direction, swing and bottom trading.
• I ask that everyone respect opinions on the board whether you agree with them or not. We are all here to make money and avoid the
minimum loss we can.
Rules of the Board
Most of this board's WATCHERS are "lurkers" who appreciate info available without the need to sift through tons of "empty" posts.
1. Respect everyone opinions on trades.
2. No Pumping of Stocks.
3. No OTCBB or PINK STOCKS
*********************************************************************************************************
To help us evaluate our performance, please "BoardMark" the board if you find it useful.
To do so, just click on "Add to Favorites" Button at Right just above the Posts Dates.
 Presently, the Board has 180 Boardmarks, Thank you!
*Information Posted on this Board is not Meant to Suggest any Specific Action, But to Point Out the Technical Signs That Can Help Our Readers Make Their Own Specific Decisions. Your Due Deligence is a Must.
EXCHANGE TRADED FUNDS~ETFs COMPONENTS~RSI and I/V charts#msg-5495097 COMPONENTSFOR ^NDX / QQQQ ~ I/V charts #msg-9787995
Gold~ Silver~ HUI~ XAU~ US$~ €uro~ Crude #msg-29347660 (thanks,bob)
Cookies/Bandwidth/Security/Privacy #msg-9353921 PIEs/Cookies/Macromedia/Flash #msg-9412363 PerformanceTips for WinXP #msg-9854670
| Volume | |
| Day Range: | |
| Bid Price | |
| Ask Price | |
| Last Trade Time: |


