CoT: Peek Into Future Through Futures, How Hedge Funds Are Positioned By: Hedgopia | April 13, 2024
• Following futures positions of non-commercials are as of April 9, 2024.
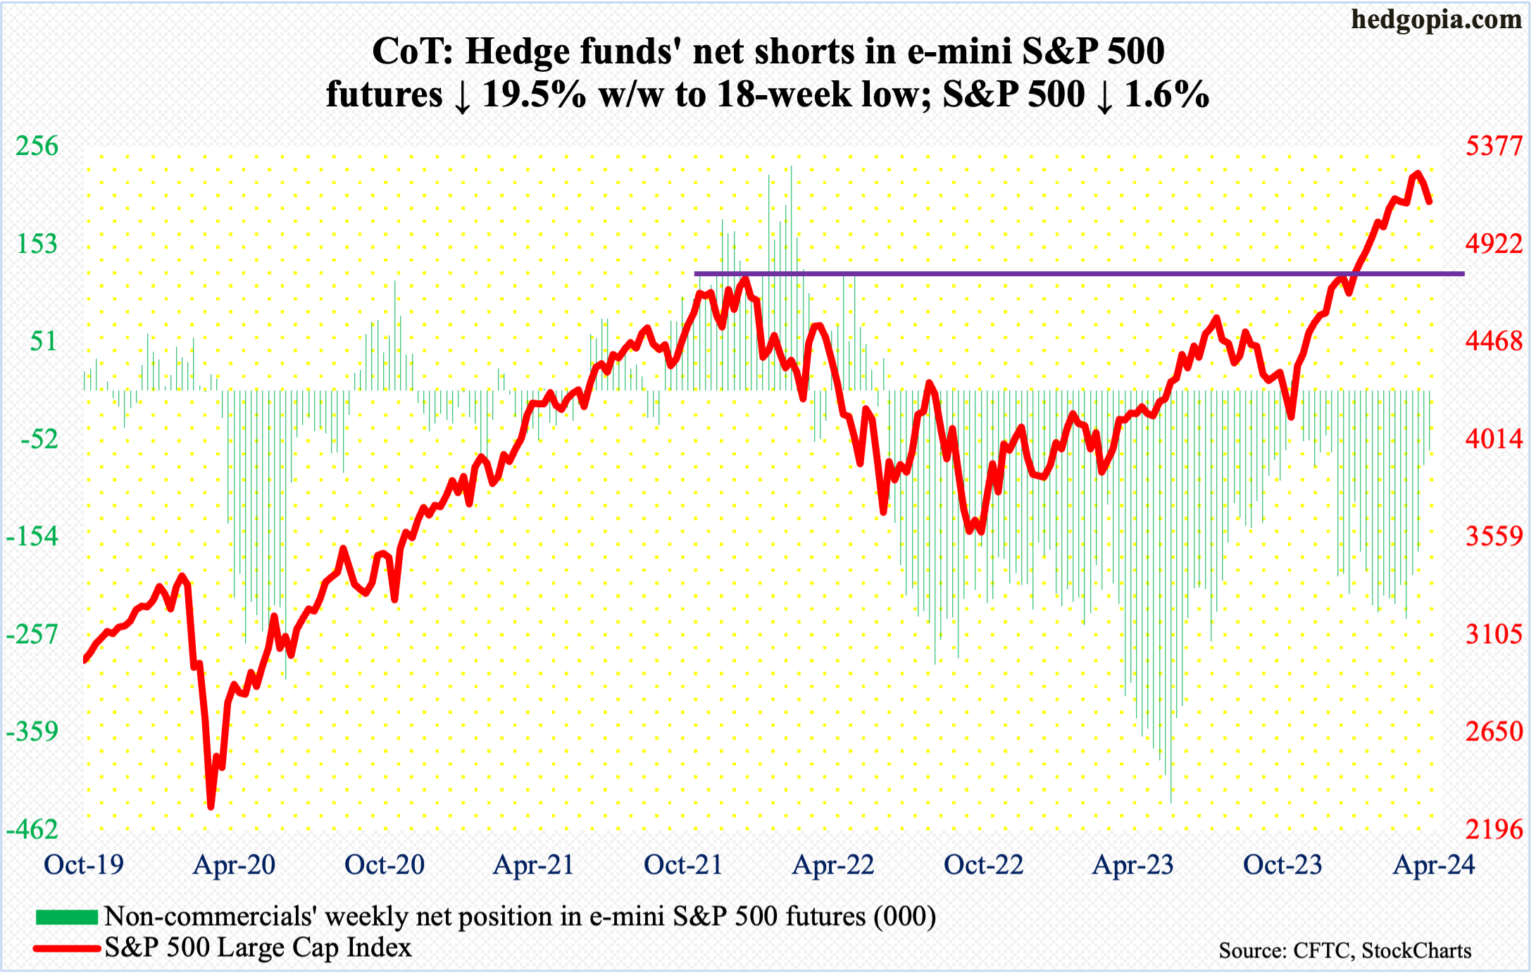
E-mini S&P 500: Currently net short 62.9k, down 15.2k.
Equity bulls are at risk of losing short-term momentum on the S&P 500. A potentially bearish cross-down between the 10- and 20-day averages is complete. This is the second time since last October’s low this has occurred. The first one took place mid-January, but that did not amount to much, lasting just a couple of sessions. Back then, the 50-day was much lower; this time around, the average (5111) is right here. In fact, Friday’s intraday low of 5108 did attract some buying, with the large cap index down 1.6 percent for the week to 5123. The index peaked at 5265 on March 28th.
Bears have an opportunity here. For the bulls, the ongoing collapse in bearish sentiment is a problem, as what has been a tailwind is turning into a headwind (more on this here). To boot, trendline support from last October has been breached.
Immediately ahead, in the event of a rally, bulls’ first test will occur at 5170s.
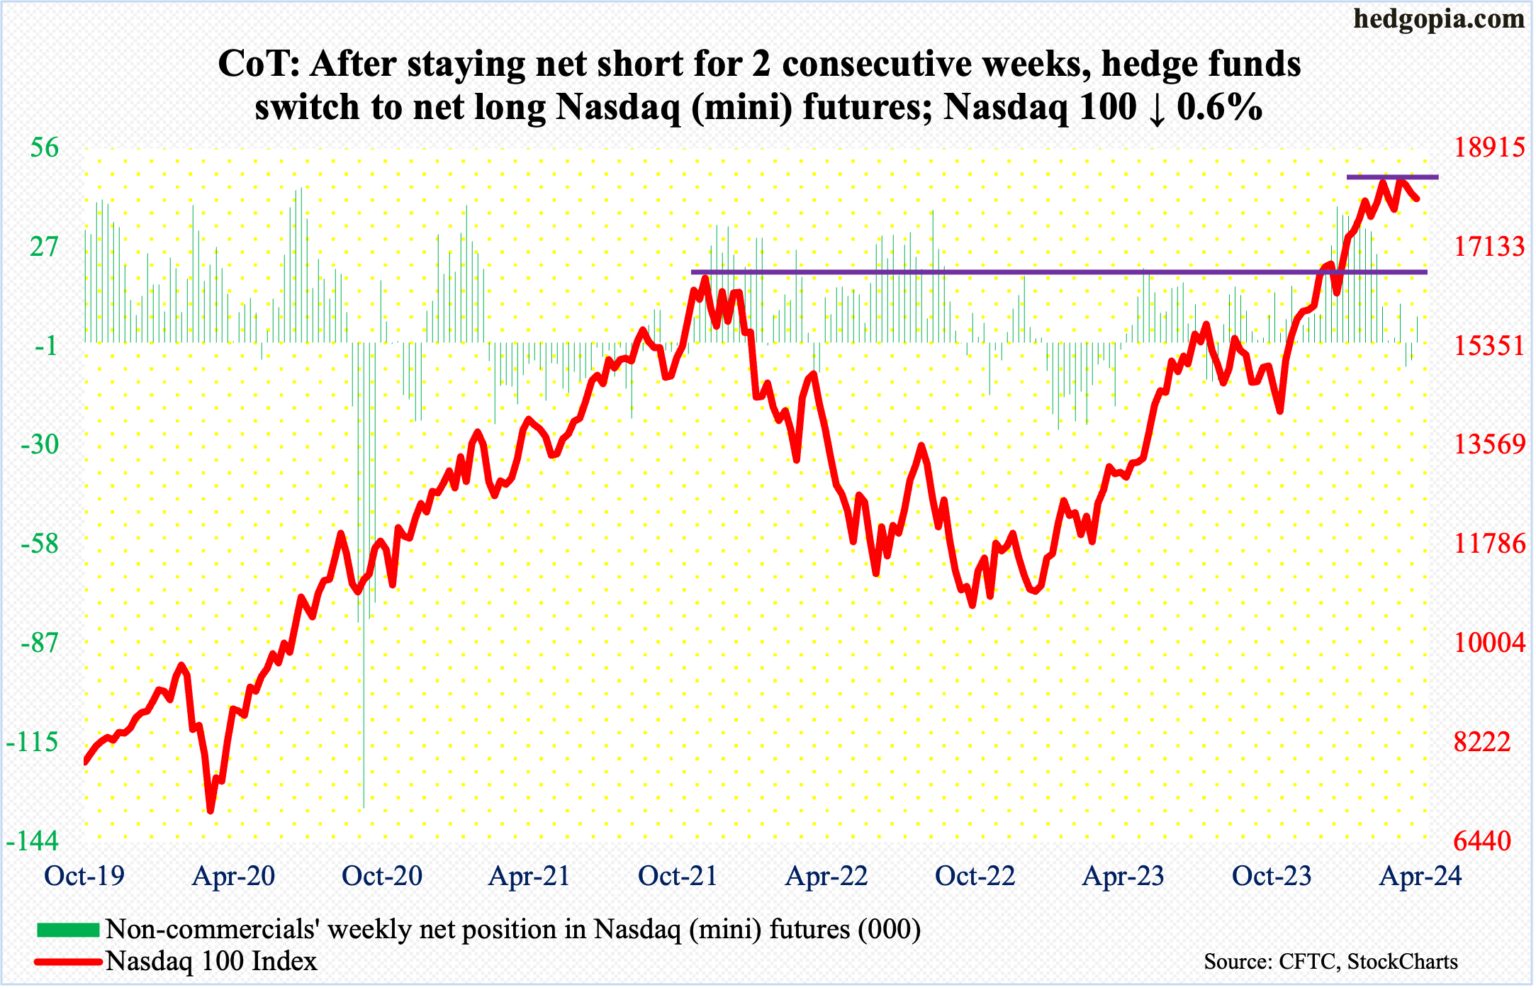
Nasdaq (mini): Currently net long 7.5k, up 12.7k.
As did the S&P 500, the Nasdaq 100 ended the week essentially right on the 50-day (17984). In fact, Friday’s intraday low of 17952 did breach the average but closed the session at 18003. The tech-heavy index has essentially hugged the average the last seven sessions. Inability to rally right off the average raises the risk that a breach is just a matter of time.
Non-commercials probably do not think a breach is in order – at least not right away anyway. After staying net short Nasdaq (mini) futures for a couple of weeks, they switched to net long this week.
For a breach not to occur, catalysts are needed, and the major US tech outfits do not report until late April and early May. Momentum has been down since the Nasdaq 100 peaked on March 21st at 18465, followed by a breach of a rising trend line from last October’s low.
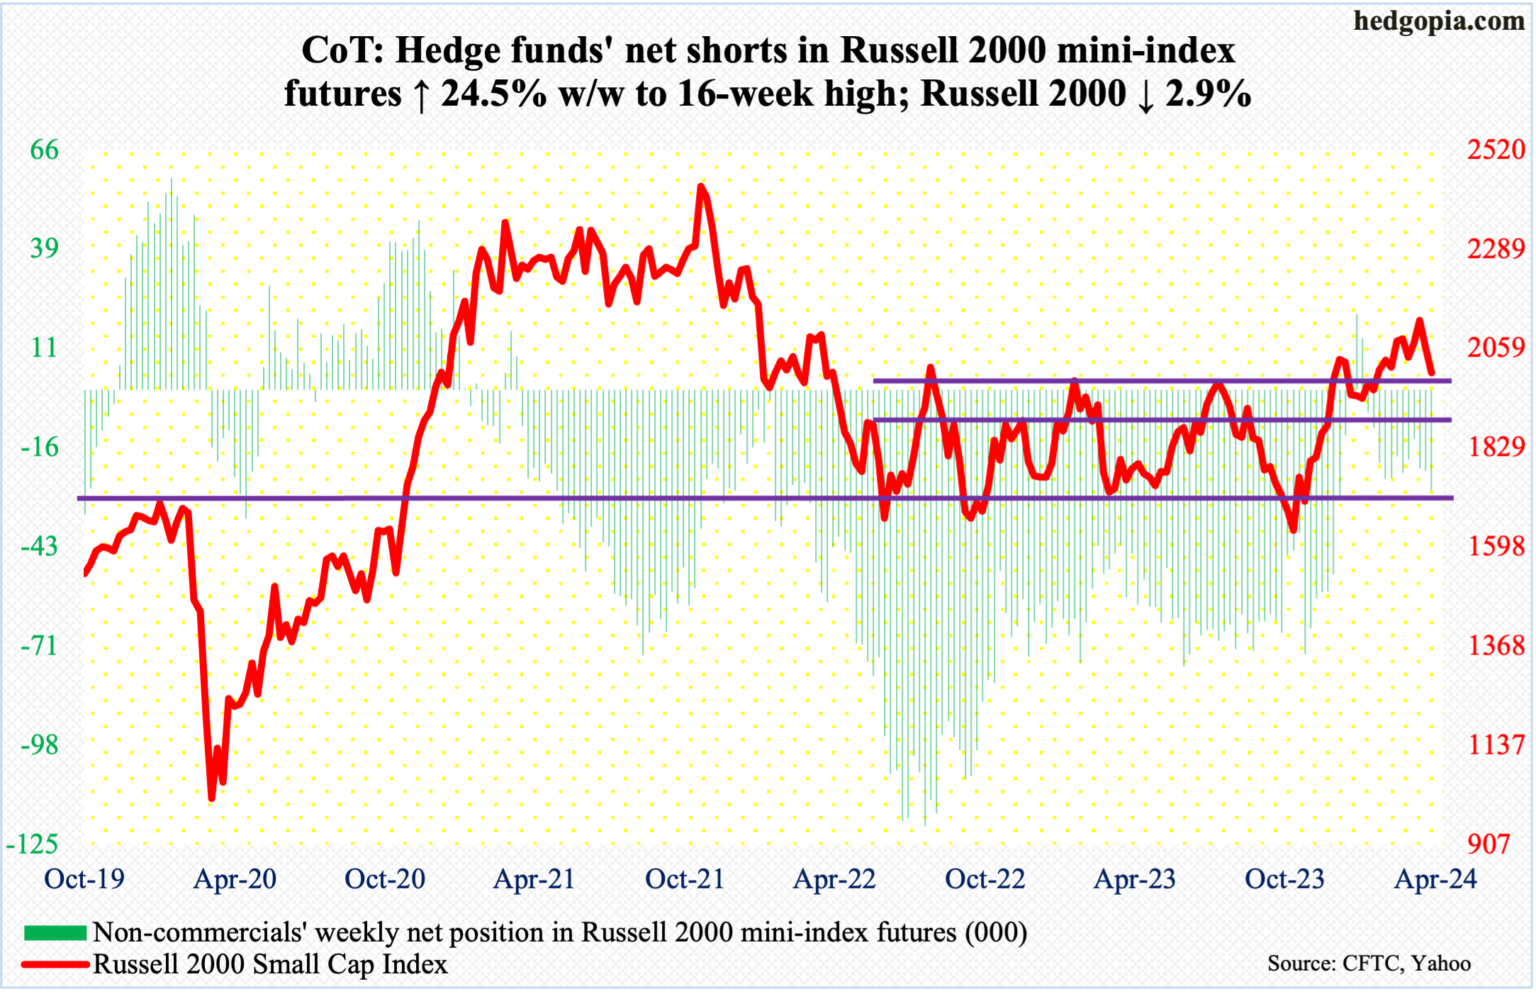
Russell 2000 mini-index: Currently net short 27.6k, up 5.4k.
Once again, small-cap bulls are being forced to defend 2000. The Russell 2000 declined 2.9 percent this week to 2003, having tagged 1995 intraday Friday. Inability to save 2000 will expose the index to breakout retest at 1900. On December 13th, it broke out of a 1700-1900 range in place since January 2022.
As things stand, bulls have their back against the wall, as for nearly a month through early this month several tries at 2100 were rejected. Horizontal resistance at 2100 goes back to January 2021. This level also represents a measured-move target of the 1700-1900 range breakout.
Much as the S&P 500 and the Nasdaq 100 did, the Russell 2000 has now compromised trendline support from last October’s low.
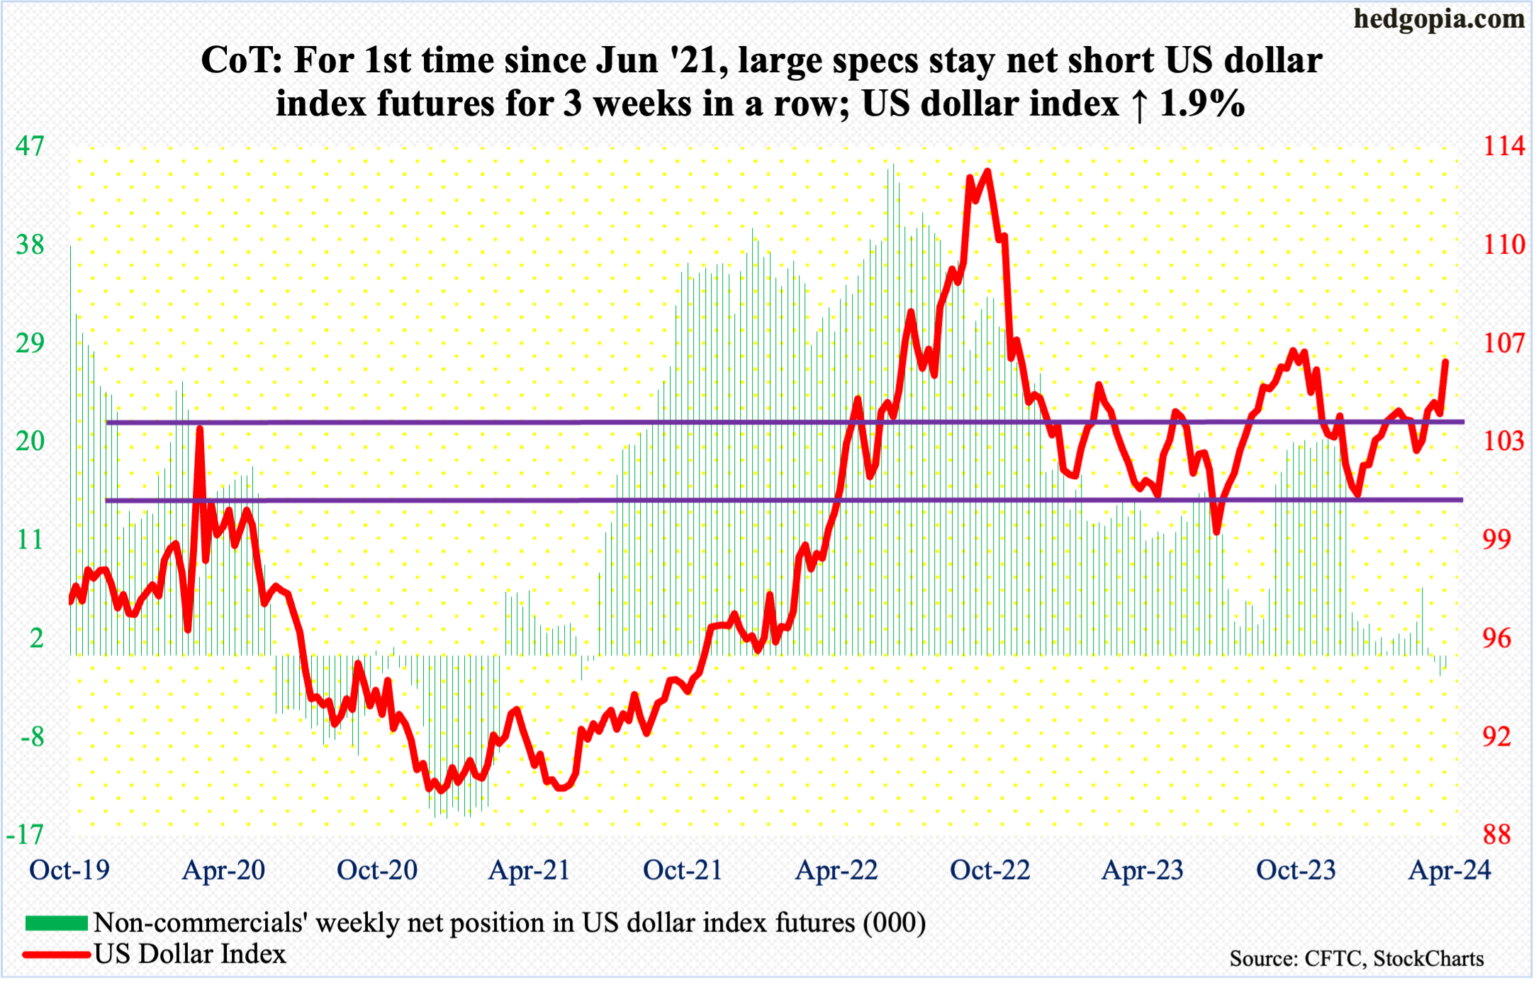
US Dollar Index: Currently net short 1.1k, down 754.
The US Dollar Index had a huge week, up 1.9 percent to 106.01. Resistance at 103-104 goes back to December 2016, and since bottoming at 102.30 on March 8th, it hesitated at the upper end for a few weeks. This week, the resistance was emphatically taken out.
Between early October and early November last year, sellers showed up at 107, which dollar bulls are probably eyeing for now.
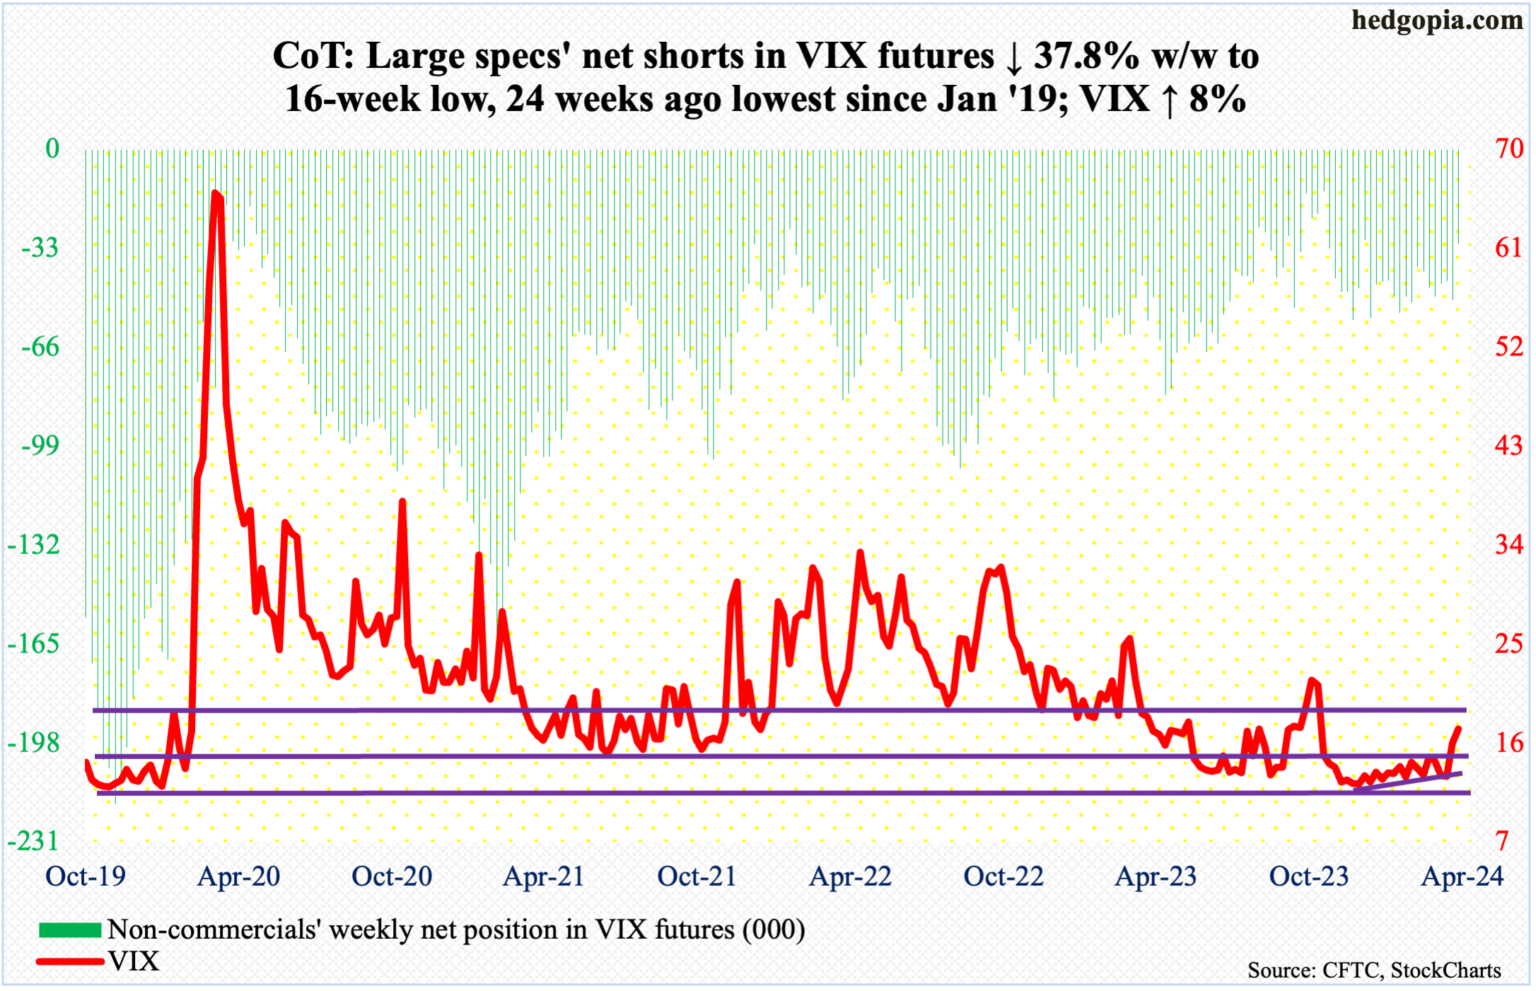
VIX: Currently net short 31.3k, down 19k.
VIX closed out the week at 17.31 but rose as high as 19.20 intraday Friday; this was the highest print since October 31st. Back then, after spiking to 23.08 on October 23rd – just before US stocks bottomed – the volatility index was on its way down.
Now, the trend is looking up, with both the 50- and 200-day beginning to turn up – although ever so slightly. If the weekly prevails, volatility likely continues to firm up. The only thing volatility bulls need to watch out for is if Friday’s action is part of a spike reversal. They definitely would not want to see a similar spike followed by a reversal next week.
Information posted to this board is not meant to suggest any specific action, but to point out the technical signs that can help our readers make their own specific decisions. Caveat emptor! • DiscoverGold
Register for free to join our community of investors and share your ideas. You will also get access to streaming quotes, interactive charts, trades, portfolio, live options flow and more tools.


 News
News  Market Data
  Discover