 News
News  Market Data
  Discover
Support: 888-992-3836
Copyright © 2023 InvestorsHub Inc.


Register for free to join our community of investors and share your ideas. You will also get access to streaming quotes, interactive charts, trades, portfolio, live options flow and more tools.
2400 would be just the beginning when its broken through.

NY Gold Futures »» Weekly Summary Analysis
By: Marty Armstrong | December 23, 2023
NY Gold Futures opened above the previous high and closed above it as well warning of a bullish posture right now. This market is above all our indicators at this time reflecting it is moving higher over recent activity. At this time, the market closed today at 20691. Caution is now required for this market is starting to suggest it may rally further on the MONTHLY level.
At the moment, this market has been rising for this month going into December reflecting that this has been only still, a bullish reactionary trend. As we stand right now, this market has made a new high exceeding the previous month's high reaching thus far 21523 while it has not broken last month's low so far of 19356. Nevertheless, this market is still trading above last month's close of 20572.
Up to now, we still have only a 1 month reaction rally from the low established during October. We must exceed the 3 month mark in order to imply that a trend is developing.
ECONOMIC CONFIDENCE MODEL CORRELATION
Here in NY Gold Futures, we do find that this particular market has correlated with our Economic Confidence Model in the past. The Last turning point on the ECM cycle low to line up with this market was 2022 and 2015. The Last turning point on the ECM cycle high to line up with this market was 2020 and 2011 and 1996.
MARKET OVERVIEW
NEAR-TERM OUTLOOK
The historical perspective in the NY Gold Futures included a rally from 2015 moving into a major high for 2023, the market has pulled back for the current year. The last Yearly Reversal to be elected was a Bullish at the close of 2022 which signaled the rally would continue into 2023.
This market remains in a positive position on the weekly to yearly levels of our indicating models. Pay attention to the Monthly level for any serious change in long-term trend ahead.
The perspective using the indicating ranges on the Daily level in the NY Gold Futures, this market remains in a bullish position at this time with the underlying support beginning at 20610.
On the weekly level, the last important high was established the week of December 4th at 21523, which was up 9 weeks from the low made back during the week of October 2nd. Afterwards, the market bounced for 9 weeks reaching a high during the week of December 4th at 20106. Since that high, we have been generally trading down to sideways for the past 2 weeks, which has been a significant move of 5.705% in a reactionary type decline. Nonetheless, the market still has not penetrated that previous low of 18235 as it has fallen back reaching only 4523 which still remains -75.1% above the former low.
When we look deeply into the underlying tone of this immediate market, we see it is currently still in a semi neutral posture despite declining from the previous high at 21523 made 2 weeks ago. Still, this market is within our trading envelope which spans between 17610 and 22050. The broader perspective, this current rally into the week of December 4th has exceeded the previous high of 20197 made back during the week of October 23rd. This immediate decline has thus far held the previous low formed at 18235 made the week of October 2nd. Only a break of that low would signal a technical reversal of fortune and of course we must watch the Bearish Reversals. Right now, the market is neutral on our weekly Momentum Models warning we have overhead resistance forming and support in the general vacinity of 20014. Additional support is to be found at 19356. Looking at this from a wider perspective, this market has been trading up for the past 7 weeks overall.
INTERMEDIATE-TERM OUTLOOK
YEARLY MOMENTUM MODEL INDICATOR
Our Momentum Models are declining at this time with the previous high made 2020 while the last low formed on 2023. However, this market has rallied in price with the last cyclical high formed on 2023 and thus we have a divergence warning that this market is starting to run out of strength on the upside.
Looking at the longer-term monthly level, we did see that the market made a high in May at 20854. After a six month rally from the previous low of 19360, it made last high in May. Since this last high, the market has corrected for six months. However, this market has held important support last month. So far here in December, this market has held above last month's low of 19356 reaching 19879.
This market is trading beneath that high of May which was 20854 by 0.78%. Critical support still underlies this market at 18107 and a break of that level on a monthly closing basis would warn of a further decline ahead becomes possible. Nevertheless, at this time, the market is still holding and is trading above last month's high.
 DiscoverGold
Gold Stocks’ Lost Year
By: Adam Hamilton | December 22, 2023
The gold miners’ stocks have suffered something of a lost year, with this small contrarian sector largely overlooked. Investor apathy remains high despite miners’ soaring earnings fueled by much-higher gold prices. But 2023’s unusually-subdued gold-stock price action was driven by several major anomalies that have run their courses. As markets normalize in 2024, gold miners have lots of mean-reversion rallying to do.
Christmas is a time of reflection, looking back on the challenges, blessings, and triumphs experienced over a long year. Like pretty much everyone, my family and I have had plenty of all three. 2023’s gold-stock performance is definitely in that challenges category. With this year winding down, the leading GDX gold-stock ETF has merely rallied 7.3% year-to-date. That’s really-poor performance compared to gold itself.
Despite spending the middle half of 2023 grinding sideways to lower, gold has enjoyed a solid year with 11.4% gains. Typically the major gold miners dominating GDX see their stock prices amplify material gold moves by 2x to 3x. So GDX should be up about 23% to 34% YTD, not just a third to fifth of that at terrible 0.6x upside leverage! To be worthwhile investments, gold miners need to outperform their metal.
They bear many additional risks beyond gold price trends, which traders need to be compensated for. Gold stocks’ vexing lagging is newer, they were quite strong in the first third of 2023. By mid-April, GDX had surged 25.0% YTD outpacing gold’s parallel 11.8% rally by a normal 2.1x. Those were parts of larger uplegs born in late September 2022, which clocked in at 63.9% and 26.3% gains respectively for 2.4x leverage.
Gold stocks really started decoupling from gold mid-year, and haven’t yet regained normal levels relative to the metal that drives their profits. Several anomalous market conditions contributed, including general stock markets’ artificial-intelligence bubble, elevated Fed-rate-hike fears, and a resulting monster bear rally in the US Dollar Index. All three weighed on gold demand, forcing the metal to consolidate for five months.
Gold has always been the leading alternative investment, the ultimate portfolio diversifier. Investors are most interested in prudently diversifying their stock-heavy portfolios with counter-moving gold when stock markets are struggling. But when they are soaring to lofty levels fueling universal euphoria, diversification is forgotten. The AI bubble mostly ballooned from early January to late July, with the S&P 500 soaring 20.5%!
Remember your first experience with ChatGPT earlier this year? The AI hype for these large-language models was extreme. My wow moment was asking ChatGPT to write a short story for my kids, specifying a genre, hero, and backdrop. The result was so impressive I printed it out that day and read it to them at dinner. Some of my and my wife’s friends started using ChatGPT for work, greatly improving their writing.
Gold didn’t slouch during that AI bubble, rallying 7.2% in that span. But man the gains in market darlings led by NVIDIA were astounding. From early January to mid-July, that stock skyrocketed 233%! Demand for its repurposed graphics-processing chips that also excel in AI applications was off the charts. Gold and its miners’ stocks are largely forgotten during stock-market bubbles, they can’t compete for excitement.
While AI is here to stay, the extreme hype surrounding it has passed. The bloom is off the rose on AI actually improving corporate earnings. While LLMs like ChatGPT can do impressive things, they are ultimately bullshitting machines. Computers string together pleasing grammatically-perfect prose, but have no idea what they are writing! They can’t think, and often give factually-untrue answers on specific questions.
These so-called “hallucinations” are rampant, greatly limiting the real-world utility of AI responses. For humans, intelligence requires long experience, wisdom, and discernment enabling us to understand crucial context and relevant relationships. AI chatbots just stitch together seemingly-related information from their vast databases that might not be at all. It’ll be years before AI substantially boosts corporate profits.
Like all stock-market bubbles, this year’s AI one faces a mean-reversion reckoning. In late July when the S&P 500 originally crested, all its elite companies averaged 30.5x trailing-twelve-month price-to-earnings ratios. Entering December, those were still running 28.3x which remains in formal bubble territory over 28x! These still-lofty stock markets need to seriously sell off in 2024 to normalize dangerous overvaluations.
NVIDIA’s epic 229% YTD run is one reason the S&P 500 just surged to new higher highs well above its late-July AI-bubble peak. But NVDA faces mounting headwinds as other chipmakers ramp up competing AI processors. This past summer, NVIDIA was selling its H100 GPU accelerators which only cost about $3k to manufacture for $25k to $30k each! Those shocking profit margins will collapse in 2024, hitting this stock.
And again stock-market weakness is great for gold demand, helping investors remember the wisdom of diversifying their stock-heavy portfolios. As goes gold, so go the gold stocks typically with that 2x to 3x leverage. As this chart shows, both gold and GDX crested this past spring right around when the AI exuberance was shooting into overdrive. That distraction helped drive healthy rebalancing corrections in both.
The AI bubble wasn’t the only anomalous market condition that retarded gold demand in 2023, keeping gold miners out of favor. Another summer one was soaring expectations for more Fed rate hikes both this year and next. Both stronger-than-expected key US economic data and top Fed officials’ forecasts for their federal-funds rate drove that. My essay last week on Fed dots spurring gold analyzed all that in depth.
Back in mid-July leading into that AI-bubble peak, GDX was still holding its own up 13.8% YTD. The major gold stocks were doing much better then than this week’s +7.3%. Then in late July, an unusual huge upside surprise in US GDP data really ramped Fed-rate-hike odds. That accelerated a healthy US-dollar bear rally to massive proportions, unleashing withering extreme gold-futures short selling in August.
Gold dropped 1.3% that month, fairly resilient with the US Dollar Index blasting 1.7% higher. But the incessant more-Fed-rate-hikes-looming talk really scared gold-stock traders, who hammered GDX down an ugly 6.8% that month! That extreme 5.1x downside leverage highlights the magnitude of gold stocks’ decoupling from their metal. Then those anomalous market conditions actually accelerated in September.
The USDX’s mighty bear rally soared another 2.5%, slamming gold down 4.8% which GDX amplified to an 8.1% monthly loss! Traders were worried about top Fed officials’ higher-rates-for-longer jawboning, which was solidified in late September’s FOMC meeting. There these policymakers boosted their year-end-2024 FFR projections by 50 basis points to 5.13%. That really deepened the gold and gold-stock selling...
* * *
Read Full Story »»»
DiscoverGold
Spot at exactly 2030 right now.
Ok. In fact epicenter of primary wave 3 going too moon. Already been written.
I will need to see a 5-wave move off the low to suggest that the c-wave in $GDX has begun. Thus far, this is only 3.
By: ElliottWaveTrader | December 19, 2023
• I will need to see a 5-wave move off the low to suggest that the c-wave in $GDX has begun. Thus far, this is only 3.

Read Full Story »»»
DiscoverGold
There is always that concern, but miners are in fact nowhere near run up like rest of market. Its gonna be run to safety, all the way down, from stocks, bonds, and crypto, into miners and metals.
Will the miners tank with most other equities during the next recession? Then the run-up?
Gold SWOT: Barrick Gold Ends up on Barron’s Favorite 10 Stocks for 2024
By: Frank Holmes | December 19, 2023
Strengths
• The best performing precious metal for the week was palladium, up 24.32%. Palladium headed for its biggest gain since March 2020 as the United Kingdom government targeted Russian metals — but not palladium — with new sanctions. The metal, mainly used in catalytic converters, surged as much as 12% on Thursday after the UK published measures that ban British citizens and entities from buying certain Russian metals. Palladium is still down 38% this year, with manufacturers using the cheaper platinum as a substitute.
• Gold headed for a weekly gain in a market dominated by the Federal Reserve’s strongest indications yet that it will pivot to easing monetary policy next year. The precious metal surged 2.4% on Wednesday when officials at the U.S. central bank indicated they expect to cut interest rates by 75 basis points next year, which would be positive for the non-interest-bearing metal. Economists at some of Wall Street’s biggest banks are now calling for the Fed to ease policy earlier and faster.

• Loncor Gold announced it has entered into an agreement for the sale of Loncor's Makapela property for CDN$13.5 million cash. The agreement calls for the sale price to be paid in a series of progress payments beginning with a deposit of $2 million. The balance of the progress payments, totaling $11.5 million, will be paid upon completion of the transfer of title to Makapela, which is expected to occur before the end of February 2024. Makapela was a noncore asset, and now Loncor is funded for 2024.
Weaknesses
• The worst performing precious metal for the week was gold, but still up 0.92%. Workers at a South African platinum mine returned to the surface after almost three days underground following what the company called an illegal sit-in. Employees at Wesizwe Platinum’s Bakubung operation northeast of Johannesburg resurfaced following discussions between management and union leadership, the company said, without elaborating on the content of the discussion.
• Petra Diamonds has entered into a non-binding term sheet on an exclusive basis with an interested party for the potential sale of its South African Koffiefontein Mine. There is the risk that the price may be less than expected as diamond prices and volumes are declining. The share price of Petra Diamonds is off slightly more than 40% year-to-date.
• The value of polished stone exports from India—a proxy for demand—was down 13% year-over-year, while volumes decreased by 7% YoY, implying aggregate prices remained increased by 2% month-over-month, but down by 6% year-over-year. The Indian diamond industry ended its voluntary suspension of rough diamond import this past Friday, as there as signs of stability emerging but need further confirmation on an improvement in market condition.
Opportunities
• According to Bank of America, gold remains a trade on rates. Thus, once the Fed announces a decisive end to the hiking cycle, expected in the second quarter 2024, new buyers should come into the market. If the Fed cuts earlier, gold could end the year at $2,400 per ounce versus spot around $1,980. The bank’s gold price model factors in changes in gold prices, rates and the U.S. dollar, not levels. The bottom line: rates and the dollar matter, with changes in direction more important than the actual levels. As such, Bank of America expects the next leg higher for the gold price will come when the Fed cuts rate, likely in 2024.
• Shares in Compania de Minas Buenaventura surged after Chilean copper producer Antofagasta unveiled a stake in the Peruvian miner, in an apparent move to diversify geographically away from Chile and add gold and silver exposure. Peru’s top publicly traded precious metals producer jumped as much as 27% in New York trading Friday. Antofagasta, the London-listed company controlled by Chile’s richest family, said it acquired a 19% stake and entered into discussions with Buenaventura to develop “a framework of collaboration,” including joining its board. “Our investment demonstrates the significant potential we see in Buenaventura’s asset portfolio,” Chairman Jean-Paul Luksic said in a statement.
• Cited on Barron’s favorite 10 stocks for 2024 is Barrick Gold. Gold mining stocks haven't been able to keep up with gold prices, but 2024 may be the year that changes for Barrick. Gold miners are thought of as leveraged plays on the metal, yet Barrick shares are up just 3% this year while gold is up more than 10% to $2,036 an ounce. The company has some of the world's best mines in spots like Nevada and the Dominican Republic, and it's the top gold producer in Africa. It aims to boost its gold and to a lesser extent copper by 30% by the end of the decade. It has the industry's most effective leader in CEO Mark Bristow, a hands-on manager who visits each major mine at least three times a year. He also has a knack for handling delicate relations with host countries in the developing world. "Barrick probably has the best management in the mining business, an excellent balance sheet with virtually no net debt, and a well-covered 2.3% dividend yield," says independent analyst Keith Trauner. The stock trades for about 16 times next year's projected earnings.
Threats
• Platinum group metals (PGM) prices have been under pressure, partially because palladium and platinum are key in auto catalysts, so the two metals are heavily exposed to cars with a combustion engine; under the technology status quo, palladium is one of the first commodities impacted by the energy transition. Anglo American notes that "The (platinum-group metals) basket price is now firmly into the cost curve, with sector returns at the lowest point seen in the last 30 years.” It remains to be seen how long these prices persist and its effect on several producers.
• Although gold finished the week up, profit taking at the end of the week on Friday trimmed the gains for the week as the Fed’s John Williams says talks of a rate cut in March are premature, tempering some of the enthusiasm the market has priced in. This lifted the dollar about 60 bp higher for the day but the 10-year yield displayed only a muted lift higher. Not a clear signal for the next direction in gold.
• Russian gold miners Highland Gold Mining, GV Gold, Trans-Siberian Gold and Kamchatka Gold were sanctioned by the U.S. government. The U.S. didn’t give any reason for the sanctions against the mining companies in an accompanying press release, but in February warned that any company or individual operating in the Russian metals and mining sector could be subject to sanctions.
Read Full Story »»»
DiscoverGold
Just saw it. Base looks more like 2030, futures still running the show.
Gold CoT: Peek Into Future Through Futures, How Hedge Funds Are Positioned
By: Hedgopia | December 16, 2023
• Following futures positions of non-commercials are as of December 12, 2023.
Gold: Currently net long 188.2k, down 15.3k.

Gold bugs rallied the metal 1.1 percent this week to $2,036/ounce but remain on the defensive after last week’s potentially important reversal.
Last week, no sooner did gold break out of $2,080s than it quickly met with a nasty reversal. This level has a lot of memory attached to it. In August 2020, gold posted a new all-time high of $2,089 and retreated. The same thing happened in March last year when it printed $2,079 and in May this year when $2,085 was tagged.
Bulls’ inability to recapture momentum soon will open the door to a test of the 50- and 200-day at $1,985 and $1,965 respectively.
The risk is if non-commercials, who are decently long, decide to cut down their net longs.
Read Full Story »»»
DiscoverGold
NY Gold Futures »» Weekly Summary Analysis
By: Marty Armstrong | December 16, 2023
At this time, the NY Gold Futures closed today at 20357. Caution is now required for this market is starting to suggest it may rally further on the MONTHLY level. Immediately, this market has been rising for this month going into December reflecting that this has been only still, a bullish reactionary trend. As we stand right now, this market has made a new high exceeding the previous month's high reaching thus far 21523 while it has not broken last month's low so far of 19356. Nevertheless, this market is currently trading below last month's close of 20572.
Up to now, we still have only a 1 month reaction rally from the low established during October. We must exceed the 3 month mark in order to imply that a trend is developing.
ECONOMIC CONFIDENCE MODEL CORRELATION
Here in NY Gold Futures, we do find that this particular market has correlated with our Economic Confidence Model in the past. The Last turning point on the ECM cycle low to line up with this market was 2022 and 2015. The Last turning point on the ECM cycle high to line up with this market was 2020 and 2011 and 1996.
MARKET OVERVIEW
NEAR-TERM OUTLOOK
The historical perspective in the NY Gold Futures included a rally from 2015 moving into a major high for 2023, the market has pulled back for the current year. The last Yearly Reversal to be elected was a Bullish at the close of 2022 which signaled the rally would continue into 2023.
This market remains in a positive position on the weekly to yearly levels of our indicating models. Pay attention to the Monthly level for any serious change in long-term trend ahead.
Solely focusing on only the indicating ranges on the Daily level in the NY Gold Futures, this market remains moderately bullish currently with underlying support beginning at 20316 and overhead resistance forming above at 20504. The market is trading closer to the support level at this time.
On the weekly level, the last important high was established the week of December 4th at 21523, which was up 9 weeks from the low made back during the week of October 2nd. Afterwards, the market bounced for 9 weeks reaching a high during the week of December 4th at 20106. Since that high, we have been generally trading down for the past week, which has been a significant move of 7.638% in a reactionary type decline. Nonetheless, the market still has not penetrated that previous low of 18235 as it has fallen back reaching only 4523 which still remains -75.1% above the former low.
When we look deeply into the underlying tone of this immediate market, we see it is currently still in a semi neutral posture despite declining from the previous high at 21523 made 1 week ago. Still, this market is within our trading envelope which spans between 17526 and 21944. Immediately, this decline from the last high established the week of December 4th has been important Before, this recent rally exceeded the previous high of 20197 made back during the week of October 23rd. That high was likewise part of a bullish trend making higher highs over the week of September 18th. This immediate decline has thus far held the previous low formed at 18235 made the week of October 2nd. Only a break of that low would signal a technical reversal of fortune and of course we must watch the Bearish Reversals.
Right now, the market is above momentum on our weekly models hinting this is still bullish for now as well as trend, long-term trend, and cyclical strength. From a pointed viewpoint, this market has been trading down for the past week.
INTERMEDIATE-TERM OUTLOOK
YEARLY MOMENTUM MODEL INDICATOR
Our Momentum Models are declining at this time with the previous high made 2020 while the last low formed on 2023. However, this market has rallied in price with the last cyclical high formed on 2023 and thus we have a divergence warning that this market is starting to run out of strength on the upside.
Looking at the longer-term monthly level, we did see that the market made a high in May at 20854. After a six month rally from the previous low of 19360, it made last high in May. Since this last high, the market has corrected for six months. However, this market has held important support last month. So far here in December, this market has held above last month's low of 19356 reaching 19879.
This market is trading beneath that high of May which was 20854 by more than 2 percent. Critical support still underlies this market at 18107 and a break of that level on a monthly closing basis would warn of a further decline ahead becomes possible. Nevertheless, at this time, the market is still holding and is trading above last month's high.
DiscoverGold
Spot Gold needs to fill 2015 area, befor any advance in bull.
Triple opex today. It’s a big deal for all markets next year.
GDX - Friendly reminder that when pullbacks happen, sometimes it's as easy as watching the 50-day moving average. Gold miners quickly reversing back up to November swing high!
By: David Keller | December 14, 2023
• Friendly reminder that when pullbacks happen, sometimes it's as easy as watching the 50-day moving average. Gold miners quickly reversing back up to November swing high!

Read Full Story »»»
DiscoverGold
$GDX 2nd best day of the year.. it needed it
By: Mike Zaccardi | December 13, 2023
• $GDX 2nd best day of the year.. it needed it.

Read Full Story »»»
DiscoverGold
Gold Miners $GDX 1.88 million share at $30.70 #darkpool print. Also noticed they opened leaps in the $41 CALLS
By: FLOWrensics | December 13, 2023
• $GDX 1.88 million share #darkpool print at $30.70
Also noticed they opened leaps in the $41 CALLS
I entered a trade in $NEM out to April based on strong seasonality during 11/27 to 04/15 per @seasonaxapp
https://lddy.no/1iacz
Top holdings: $NEM 13.9% $ABX 8.8% $AEM $WPM $FNV $RGLD $AU $K


Read Full Story »»»
DiscoverGold
Gold CoT: Peek Into Future Through Futures, How Hedge Funds Are Positioned
By: Hedgopia | December 9, 2023
• Following futures positions of non-commercials are as of December 5, 2023.
Gold: Currently net long 203.5k, up 3.5k.

Gold bugs are probably not happy how the week evolved. The much-anticipated breakout at $2,080s did come about, but this was quickly followed by a nasty reversal.
The metal jumped 4.3 percent last week to $2,090 – a level of immense import. In August 2020, gold posted a new all-time high of $2,089 and retreated. The same thing happened in March last year when it printed $2,079 and in May this year when $2,085 was tagged.
Come Monday, gold began where it left off, rallying as high as $2,152 intraday, but only to then reverse to close at $2,042. That is a swing of $110 in a session! When it was all said and done, it finished the week at $2,015.
The reversal has potential to be a major one. For now, there was some buying interest Friday at lateral support of $2,010s, a breach – likely – of which will open the door to a test of the 50- and 200-day at $1,968 and $1,961 respectively.
In the meantime, non-commercials remain committed for now, with net longs highest since April last year. If gold fails to regain momentum soon, these traders can decide to move on.
Read Full Story »»»
DiscoverGold
NY Gold Futures »» Weekly Summary Analysis
By: Marty Armstrong | December 9, 2023
At this time, the NY Gold Futures closed today at 20145. Caution is now required for this market is starting to suggest it may rally further on the MONTHLY level. Presently, this market has been rising for this month going into December reflecting that this has been only still, a bullish reactionary trend. As we stand right now, this market has made a new high exceeding the previous month's high reaching thus far 21523 while it has not broken last month's low so far of 19356. Nevertheless, this market is currently trading below last month's close of 20572.
Up to now, we still have only a 1 month reaction rally from the low established during October. We must exceed the 3 month mark in order to imply that a trend is developing.
ECONOMIC CONFIDENCE MODEL CORRELATION
Here in NY Gold Futures, we do find that this particular market has correlated with our Economic Confidence Model in the past. The Last turning point on the ECM cycle low to line up with this market was 2022 and 2015. The Last turning point on the ECM cycle high to line up with this market was 2020 and 2011 and 1996.
MARKET OVERVIEW
NEAR-TERM OUTLOOK
The historical perspective in the NY Gold Futures included a rally from 2015 moving into a major high for 2023, the market has pulled back for the current year. The last Yearly Reversal to be elected was a Bullish at the close of 2022 which signaled the rally would continue into 2023.
This market remains in a positive position on the weekly to yearly levels of our indicating models. Pay attention to the Monthly level for any serious change in long-term trend ahead.
Looking at the indicating ranges on the Daily level in the NY Gold Futures, this market remains neutral with resistance standing at 20276 and support forming below at 20098. The market is trading closer to the support level at this time.
On the weekly level, the last important high was established the week of December 4th at 21523, which was up 9 weeks from the low made back during the week of October 2nd. So far, this week is trading within last week's range of 21523 to 20106. Nevertheless, the market is still trading downward more toward support than resistance. A closing beneath last week's low would be a technical signal for a correction to retest support.
When we look deeply into the underlying tone of this immediate market, we see it is currently still in a semi neutral posture despite declining from the previous high at 21523 made 0 week ago. Still, this market is within our trading envelope which spans between 18812 and 20520. This market has made a new historical high this past week reaching 21523. Here the market is trading weak gravitating more toward support than resistance. We have technical support lying at 20356 which we are currently trading below implying the market is very weak. This infers that this level will now be resistance. Our Major Channel Support lies at 18450 and a break of that level would be a bearish indication for this market.
Right now, the market is above momentum on our weekly models hinting this is still bullish for now. Looking at this from a wider perspective, this market has been trading up for the past 3 weeks overall.
INTERMEDIATE-TERM OUTLOOK
YEARLY MOMENTUM MODEL INDICATOR
Our Momentum Models are declining at this time with the previous high made 2020 while the last low formed on 2023. However, this market has rallied in price with the last cyclical high formed on 2023 and thus we have a divergence warning that this market is starting to run out of strength on the upside.
Looking at the longer-term monthly level, we did see that the market made a high in May at 20854. After a six month rally from the previous low of 19360, it made last high in May. Since this last high, the market has corrected for six months. However, this market has held important support last month. So far here in December, this market has held above last month's low of 19356 reaching 20106.
This market is trading beneath that high of May which was 20854 by more than 2 percent. Critical support still underlies this market at 18107 and a break of that level on a monthly closing basis would warn of a further decline ahead becomes possible. Nevertheless, at this time, the market is still holding and is trading above last month's high.
DiscoverGold
still manipulated to the gills. 2030 is max until its not.
$GDX Are Gold Miners about to get their second wind here?
By: TrendSpider | December 7, 2023
• $GDX Are Gold Miners about to get their second wind here?

Read Full Story »»»
DiscoverGold
Newmont $NEM Notable *SIZE* ~ 3.59 Million shares at $39.50 #darkpool activity ~ 18% of 30D Avg Vol
By: FLOWrensics | December 7, 2023
• $NEM Notable SIZE #darkpool activity ~ 3.59 mil shares at $39.50 ~ 18% of 30D Avg Vol
$NEM is 13.7% top holding of $GDX.

Read Full Story »»»
DiscoverGold
Gold is 100% manipulated right now. Couldn’t break away. I can see the manipulation signals all week so far, not a chance of going up right now, but at the same time, it looks solid above 2k.
$GDX *SIZE* ~ 7.07 million shares at $31.81 #darkpool activity ~ 29% of 30D Avg Vol
By: FLOWrensics | December 3, 2023
• $GDX SIZE #darkpool activity ~ 7.07 million shares at $31.81 ~ 29% of 30D Avg Vol
This is the largest size we have seen in the Gold Miners in the last 3 years
Top Holdings: $NEM $ABX $AEM $WPM $FNV $AU $RGLD $K


Read Full Story »»»
DiscoverGold
Gold CoT: Peek Into Future Through Futures, How Hedge Funds Are Positioned
By: Hedgopia | December 2, 2023
• Following futures positions of non-commercials are as of November 28, 2023.
Gold: Currently net long 200.1k, up 28.4k.

Gold rallied to both a closing and intraday high. The metal rallied 4.3 percent this week to close at $2,089.70, with an intraday high of $2,095.70. The yellow metal is on the verge of a massive breakout.
Although gold rose to a new record, it remains in the vicinity of a price point that has resisted prior advances. In August 2020, it posted a new all-time high of $2,089 and retreated. The same thing happened in March last year when it printed $2,079 and in May this year when $2,085 was tagged.
Non-commercials, whose holdings of net longs are the highest since April last year, act as if a breakout is just a matter of time, and they are probably right.
Read Full Story »»»
DiscoverGold
NY Gold Futures »» Weekly Summary Analysis
By: Marty Armstrong | December 2, 2023
At this time, the NY Gold Futures closed today at 20897. Caution is now required for this market is starting to suggest it may rally further on the MONTHLY level. Up to this moment in time, this market has been rising for this month going into December reflecting that this has been only still, a bullish reactionary trend. As we stand right now, this market has made a new high exceeding the previous month's high reaching thus far 20957 while it has not broken last month's low so far of 19356. Nevertheless, this market is still trading above last month's high of 20727.
Up to now, we still have only a 1 month reaction rally from the low established during October. We must exceed the 3 month mark in order to imply that a trend is developing.
ECONOMIC CONFIDENCE MODEL CORRELATION
Here in NY Gold Futures, we do find that this particular market has correlated with our Economic Confidence Model in the past. The Last turning point on the ECM cycle low to line up with this market was 2022 and 2015. The Last turning point on the ECM cycle high to line up with this market was 2020 and 2011 and 1996.
MARKET OVERVIEW
NEAR-TERM OUTLOOK
The historical perspective in the NY Gold Futures included a rally from 2015 moving into a major high for 2023, the market has pulled back for the current year. The last Yearly Reversal to be elected was a Bullish at the close of 2022 which signaled the rally would continue into 2023.
This market remains in a positive position on the weekly to yearly levels of our indicating models. Pay attention to the Monthly level for any serious change in long-term trend ahead.
From a perspective using the indicating ranges on the Daily level in the NY Gold Futures, this market remains in a bullish position at this time with the underlying support beginning at 20642.
On the weekly level, the last important high was established the week of November 27th at 20957, which was up 8 weeks from the low made back during the week of October 2nd. So far, this week is trading within last week's range of 20957 to 20014. Nevertheless, the market is still trading upward more toward resistance than support. A closing beneath last week's low would be a technical signal for a correction to retest support.
When we look deeply into the underlying tone of this immediate market, we see it is currently still in a semi neutral posture despite declining from the previous high at 20957 made 0 week ago. This market has made a new historical high this past week reaching 20957. Here the market is trading positive gravitating more toward resistance than support. We have technical support lying at 20229 which we are still currently trading above for now.
Right now, the market is above momentum on our weekly models hinting this is still bullish for now as well as trend, long-term trend, and cyclical strength. Looking at this from a wider perspective, this market has been trading up for the past 2 weeks overall.
INTERMEDIATE-TERM OUTLOOK
YEARLY MOMENTUM MODEL INDICATOR
Our Momentum Models are declining at this time with the previous high made 2020 while the last low formed on 2023. However, this market has rallied in price with the last cyclical high formed on 2023 and thus we have a divergence warning that this market is starting to run out of strength on the upside.
Looking at the longer-term monthly level, we did see that the market made a high in May at 20854. After a six month rally from the previous low of 19360, it made last high in May. Since this last high, the market has corrected for six months. However, this market has held important support last month. So far here in December, this market has held above last month's low of 19356 reaching 20526.
The market is trading some 0.20% percent above the last high 20854 from which we did originally obtain one sell signal from that event established during May. Long-Term critical support still underlies this market at 18107 and only a break of that level on a monthly closing basis would warn of a break of the current uptrend. At this time, the market is holding and is trading above last month's high as well.
DiscoverGold
Gold Mid-Tiers’ Q3’23 Fundamentals
By: Adam Hamilton | December 1, 2023
The mid-tier and junior gold miners recently finished reporting their latest quarterly results. These smaller producers are fundamentally-superior, in the sweet spot for upside potential in major gold uplegs. Indeed their Q3’23 operational and financial results proved spectacular, much better than their larger peers. The potent combination of lower mining costs and higher gold prices fueled huge profits growth for these companies.
The leading mid-tier-gold-stock benchmark is the GDXJ VanEck Junior Gold Miners ETF. With $4.4b in net assets mid-week, it remains the second-largest gold-stock ETF after its big brother GDX. That is dominated by far-larger major gold miners, although there is much overlap between these ETFs’ holdings. Still misleadingly named, GDXJ is overwhelmingly a mid-tier gold-stock ETF with little weighting allocated to juniors.
Gold-stock tiers are defined by miners’ annual production rates in ounces of gold. Small juniors have little sub-300k outputs, medium mid-tiers run 300k to 1,000k, large majors yield over 1,000k, and huge super-majors operate at vast scales exceeding 2,000k. Translated into quarterly terms, these thresholds shake out under 75k, 75k to 250k, 250k+, and 500k+. Only four of GDXJ’s 25 biggest holdings are true juniors!
Their Q3 production is highlighted in blue in the table below. Juniors not only mine less than 75k ounces per quarter, but their gold output generates over half their quarterly revenues. That excludes both primary silver miners producing byproduct gold, and royalty and streaming companies that purchase future gold output for big upfront payments used to finance mine builds. But mid-tiers often make better investments.
These gold miners dominating GDXJ offer a unique mix of sizable diversified production, excellent output-growth potential, and smaller market capitalizations ideal for outsized gains. Mid-tiers are less risky than juniors, while amplifying gold uplegs much more than majors. Our newsletter trading books are now filled with fundamentally-superior mid-tiers and juniors, smaller gold miners which we’ve long specialized in at Zeal.
While gains are mounting in these high-potential gold stocks, they remain really out of favor. GDXJ has had a wild ride over the past year or so. From late September 2022 to mid-April, GDXJ powered 66.9% higher in a strong upleg! But then the mid-tiers started grinding lower on balance with their metal, and GDXJ fell 29.3% into early October. That recent selloff rebalanced sentiment, eliminating most bullishness.
Since then GDXJ has started clawing back, up 24.1% at best as of late November. Gold-stock uplegs parallel and amplify gold’s, but often start out slower. Traders remain skeptical after major gold selloffs, not convinced of young uplegs’ staying power. But the longer and higher gold runs, the more speculators and investors grow bullish on its potential. So they increasingly flood into gold stocks as gold uplegs mature.
For 30 quarters in a row now, I’ve painstakingly analyzed the latest operational and financial results from GDXJ’s 25-largest component stocks. Mostly mid-tiers, they now account for 65.9% of this ETF’s total weighting. While digging through quarterlies is a ton of work, understanding smaller gold miners’ latest fundamentals really cuts through the obscuring sentiment fogs shrouding this sector. This research is essential.
This table summarizes the GDXJ top 25’s operational and financial highlights during Q3’23. These gold miners’ stock symbols aren’t all US listings, and are preceded by their rankings changes within GDXJ over this past year. The shuffling in their ETF weightings reflects shifting market caps, which reveal both outperformers and underperformers since Q3’22. Those symbols are followed by their recent GDXJ weightings.
Next comes these gold miners’ Q3’23 production in ounces, along with their year-over-year changes from the comparable Q3’22. Output is the lifeblood of this industry, with investors generally prizing production growth above everything else. After are the costs of wresting that gold from the bowels of the earth in per-ounce terms, both cash costs and all-in sustaining costs. The latter help illuminate miners’ profitability.
That’s followed by a bunch of hard accounting data reported to securities regulators, quarterly revenues, earnings, operating cash flows, and resulting cash treasuries. Blank data fields mean companies hadn’t disclosed that particular data as of mid-November. The annual changes aren’t included if they would be misleading, like comparing negative numbers or data shifting from positive to negative or vice-versa.
The mid-tier gold miners’ overall Q3’23 performance proved spectacular! These sweet-spot-for-upside smaller gold stocks grew their production while slashing mining costs. That along with surging prevailing gold prices fueled massive earnings jumps, both per ounce and absolutely. Last quarter was undoubtedly one of the best the mid-tier and junior gold stocks ever reported, which should really attract back investors.
Production growth trumps everything else as the primary mission for gold miners. Higher outputs boost operating cash flows which help fund mine expansions, builds, and purchases, fueling virtuous circles of growth. Mining more gold also raises profitability, lowering unit costs by spreading big fixed operational expenses across more ounces. The GDXJ-top-25 gold miners delivered again for the sixth quarter in a row!
Their collective production grew 2.5% YoY to 3,378k ounces last quarter. That easily bested the GDX-top-25 majors’ Q3 output, which shrunk slightly as I analyzed in another essay a couple weeks ago. The mid-tiers also outperformed world gold mines as a whole, including all that produce byproduct gold. The World Gold Council’s excellent Q3’23 Gold Demand Trends report pegged overall global output growth at 2.3%.
And interestingly the GDXJ top 25’s production is understated. Note in this table that two new explorers climbed into this ETF’s upper ranks over this past year, Australia’s De Grey Mining and Canada’s Filo Corp. Both are worthy additions, advancing great gold projects. De Grey’s has a massive 10.5m ounces of indicated and inferred resources, while Filo’s huge primary copper deposit contains 6.7m ounces of gold!
* * *
Read Full Story »»»
DiscoverGold
The Best Mining Stock to Own in December Newmont Corporation (NEM)
By: Schaeffer's Investment Research | December 1, 2023
• Plus, 24 stocks that tend to outperform this time of year
• The equity is underperforming this year
Precious metals producer Newmont Corporation (NYSE:NEM) is 0.4% higher at $40.37 this morning, looking to recover from two days of losses as gold miners felt the pressure of a rising dollar. The stock is down nearly 15% in 2023, and things looks bleak with a month to go before the start of the new year. However, history suggests that NEM could follow up its mid-November dip to annual lows below the $34 level to close out the year with a bang.

Per data from Schaeffer's Senior Quantitative Analyst Rocky White, Newmont stock is one of the best-performing stocks on the S&P 500 Index (SPX) in the month of December over the last decade. The shares averaged a December return of 3.4% over the last 10 years, finishing the month with a positive return seven times. This makes the equity is the only precious metal stock to make the list, too.
It's also worth noting Newmont stock's Schaeffer's Volatility Scorecard (SVS) ranks at a slightly elevated 77 out of 100. In other words, the equity tends to outperform options traders' volatility expectations.
Read Full Story »»»
DiscoverGold
This is even better. Buckle up buttercup. This guy knows his stuff, and it is nothing to do with cryptos certain demise in several areas, in fact u will see a stampede into real money like never ever before.
"I think the biggest problem, Neil, is we have the Three Stooges, you know, one in the presidency, one in the Treasury and one at the Fed," he continued when discussing his outlook on the country’s economic standing.
"America is broke right now," Kiyosaki told host Neil Cavuto.
https://www.foxbusiness.com/markets/us-in-serious-trouble-warns-financial-world-legend-who-predicted-lehman-collapse
Either planned or a kinda Dr Strangelove? FED'S POWELL: PREMATURE TO SPECULATE ON WHEN POLICY MAY EASE
*POWELL: FED PREPARED TO TIGHTEN MORE IF IT BECOMES APPROPRIATE
*POWELL: FOMC MOVING CAREFULLY AS RISKS BECOMING MORE BALANCED
*POWELL: FED POLICY RATE IS 'WELL INTO RESTRICTIVE TERRITORY”
I’m thinking gold hits 38k by end of next misstep year.
The 3-year range rank spread between gold miners and gold recently fell to -60%, a phenomenon observed in less than 1% of cases since 1969.
By: Dean Christians | November 30, 2023
• The 3-year range rank spread between gold miners and gold recently fell to -60%, a phenomenon observed in less than 1% of cases since 1969.

Read Full Story »»»
DiscoverGold
I happen to agree. A bull super cycle in miners is coming.
The Ord Oracle: GDX Update
By: Markets & Mayhem | November 30, 2023
SPX Monitoring Purposes; Long SPX 10/27/23 at 4117.37. Gain Since 12/20/22: Over 26%. Monitoring Purposes GOLD: Long GDX on 10/9/20 at 40.78.
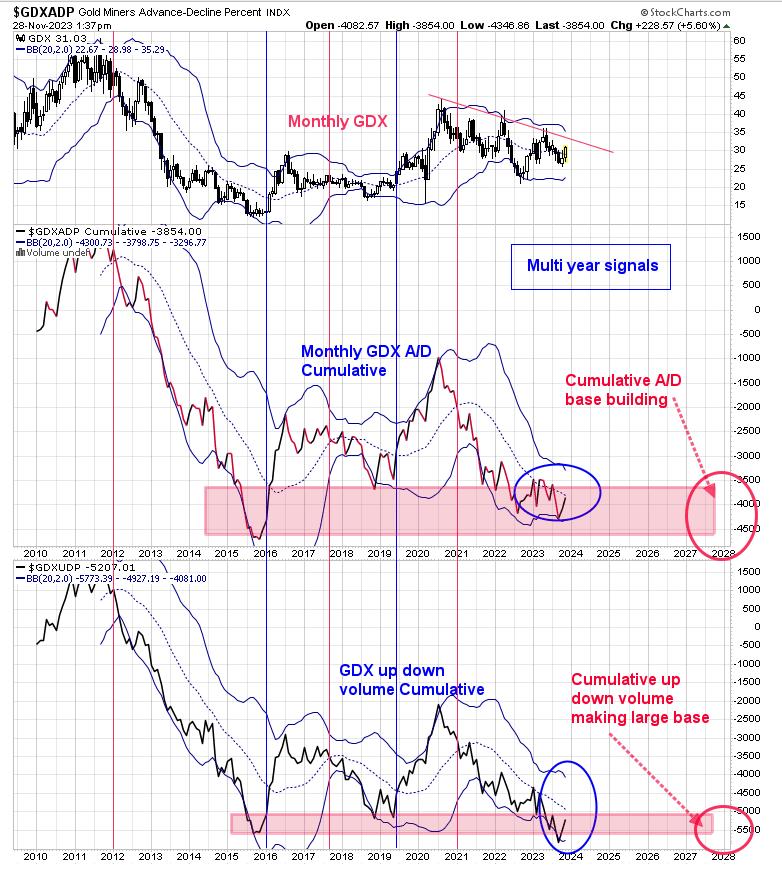
There is a very good likelihood of a multi-year signal triggering for GDX in the coming months.
The above chart is on the monthly time frame. The bottom window is the GDX Cumulative Up Down Volume percent, and the next higher window is the GDX Cumulative Advance/Decline percent. These signals generate after a bottom is in, but, once they are triggered, the signal can last many months or years. Bullish signals are generated when both indicators close above mid-Bollinger bands (noted with blue lines) and bearish signals when both indicators close below mid-Bollinger bands (noted with red lines).
Both monthly indicators reached near the 2016 low (noted with pink shaded areas), noting an oversold market. The last sell signal came in early 2021 (nearly 3 years ago), and is now nearing a bullish crossover of the mid-Bollinger band, which may take another month of two. We do have evidence that a worthwhile low has formed already and a bullish mid-Bollinger band crossing of both indicators above will signal that a multi-month, if not a multi year, rally is coming.
Tim Ord,
Editor
Read Full Story »»»
DiscoverGold
2040 spot has to fill before moving up. It’s fighting it. Do it now or pain later.
$GDX Gold Miners ETF breaking the neckline today, back above its 200 SMA for the first time since August!
By: TrendSpider | November 28, 2023
• $GDX Gold Miners ETF breaking the neckline today, back above its 200 SMA for the first time since August!

Read Full Story »»»
DiscoverGold
$GDX breaking out
By: Mike Zaccardi | November 28, 2023
• $GDX breaking out
https://tradingview.com/chart/GDX/efON052s-GDX-Bullish-Inverse-Head-and-Shoulders-Bottom-In-Play/

Read Full Story »»»
DiscoverGold
$GDX Opening Put Sweeper in to the 12/01 $30 Puts
By: FLOWrensics | November 27, 2023
• $GDX Opening PUT SWEEPER in to the 12/01 $30 PUTS.

Read Full Story »»»
DiscoverGold
Gold Stocks’ Winter Rally 8
By: Adam Hamilton | November 25, 2023
Gold stocks have mostly ground lower to sideways since spring, leaving this contrarian sector really out of favor again. Yet both the metal and its miners’ stocks are early on in their strongest seasonal rallies of the year. From late October to late February, gold tends to enjoy excellent gains which the gold stocks leverage. Given 2023’s great winter-rally setup, gold’s bullish seasonals should prove potent tailwinds ahead.
Seasonality is the tendency for prices to exhibit recurring patterns at certain times during the calendar year. While seasonality doesn’t drive price action, it quantifies annually-repeating behaviors driven by sentiment, technicals, and fundamentals. We humans are creatures of habit and herd, which naturally colors our trading decisions. The calendar year’s passage affects the timing and intensity of buying and selling.
Gold stocks display strong seasonality because their price action amplifies that of their dominant primary driver, gold. Gold’s seasonality generally isn’t driven by supply fluctuations like grown commodities see, as its mined supply remains relatively steady year-round. Instead gold’s major seasonality is demand-driven, with global investment demand varying considerably depending on the time in the calendar year.
This gold seasonality is fueled by well-known income-cycle and cultural drivers of outsized gold demand from around the world. And the biggest seasonal surge of all is just getting underway heading into winter. As the Indian-wedding-season gold-jewelry buying that normally drives this metal’s big autumn rally winds down, the Western holiday season ramps up. The holiday spirit puts everyone in the mood to spend money.
Men splurge on vast amounts of gold jewelry for Christmas gifts for their wives, girlfriends, and daughters. The holidays are also a major engagement season, with Christmas Eve and New Year’s Eve being two of the biggest proposal nights of the year. Something like a third to half of the entire annual sales of many jewelry retailers come in November and December! And jewelry historically dominates overall gold demand.
The World Gold Council closely tracks global gold supply and demand, publishing the latest data each quarter. During the last five calendar years, jewelry demand averaged 42.7% of overall total world gold demand. That is much larger than investment demand, which averaged 26.6% during that same 2018-to-2022 span. Year-to-date in 2023 at the end of Q3, jewelry demand is tracking at a similar 42.9% of the total.
The usual frenzied Western jewelry buying heading into Christmas shifts to pure investment demand after year-end. That’s when Western investors figure out how much surplus income they earned during the prior year after bonuses and taxes. Some of this is plowed into gold in January, driving it higher. Finally gold’s big winter rally climaxes in late February on major Chinese New Year gold buying flaring up in Asia.
So during its bull-market years, gold has usually tended to enjoy powerful winter rallies driven by these sequential episodes of outsized demand. Naturally the gold stocks follow gold higher, amplifying its gains due to their excellent profits leverage to the gold price. Today gold stocks are now once again early on in gold’s strongest seasonal rally of the year, driven by this annually-recurring robust winter gold demand.
Since it is gold’s own demand-driven seasonality that fuels gold stocks’ seasonality, that’s logically the best place to start to understand what’s likely coming. This old research thread focuses on modern bull-market seasonality, as bull and bear price action are quite different. Gold enjoyed a mighty 638.2% bull run from April 2001 to August 2011, fueling gold stocks skyrocketing 1,664.4% per their leading index then!
Following that secular juggernaut, gold consolidated high then started correcting into 2012. But the yellow metal didn’t enter formal bear territory down 20%+ until April 2013. That beast mauled gold on and off over several years, so 2013 to 2015 are excluded from these seasonal averages. Gold finally regained bull status powering 20%+ higher in March 2016, then its gains grew to a modest 96.2% by August 2020.
Another high consolidation emerged after that, where gold avoided relapsing into a new bear despite a serious correction. Later the yellow metal started powering higher again, coming within 0.5% of a new nominal record in early March 2022 after Russia invaded Ukraine. So 2016 to 2021 definitely proved bull years too, with 2022 really looking like one early on. Then Fed officials panicked, unleashing market chaos.
Inflation was raging out of control thanks to their extreme money printing. In just 25.5 months following the March 2020 pandemic-lockdown stock panic, the Fed ballooned its balance sheet an absurd 115.6%! That effectively more than doubled the US monetary base in just a couple years, injecting $4,807b of new dollars to start chasing and bidding up the prices on goods and services. That fueled an inflation super-spike.
With big inflation running rampant, Fed officials frantically executed the most-extreme tightening cycle in this central bank’s history. They hiked their federal-funds rate an astounding 450 basis points in just 10.6 months, while also selling monetized bonds through quantitative tightening! That ignited a huge parabolic spike in the US dollar, unleashing massive gold-futures selling slamming gold 20.9% lower into early September.
That was technically a new bear market, albeit barely and driven by an extraordinary anomaly that was unsustainable. Indeed gold soon rebounded sharply, exiting 2022 with a trivial 0.3% full-year loss. Gold kept on powering higher, reentering bull territory up 20.2% in early February 2023! So I’m also classifying 2022 as a bull year for seasonality research. Gold’s modern bull years include 2001 to 2012 and 2016 to 2023.
Prevailing gold prices varied radically across these secular spans, running just $257 when gold’s mighty 2000s bull was born to August 2020’s latest record high of $2,062. That vast range of gold levels spread over all those long years has to first be rendered in like-percentage terms in order to make them perfectly comparable with each other. Then they can be averaged together to distill out gold’s bull-market seasonality.
That’s accomplished by individually indexing each calendar year’s gold price action to its final close of the preceding year, which is recast at 100. Then all gold price action of the following year is calculated off that common indexed baseline, normalizing all years. So gold trading at 110 simply means it has rallied 10% off the prior year’s close. Gold’s previous seasonality before 2022 was added is shown in light blue.
During fully 19 of the last 22 years, gold has averaged excellent 13.8% annual gains! This great recent-decade track record should leave gold widely respected as an essential portfolio diversifier. All investors should deploy some small fraction of their financial assets into gold, like the traditional 5% to 10% which was considered prudent for centuries. Gold allocations stabilize returns, while protecting against market shocks...
Read Full Story »»»
DiscoverGold
NY Gold Futures »» Weekly Summary Analysis
By: Marty Armstrong | November 25, 2023
NY Gold Futures closed today at 20030 and is trading up about 9.68% for the year from last year's settlement of 18262. Caution is now required for this market is starting to suggest it will decline further on the MONTHLY level. This price action here in November is suggesting that this has been a bear market trend on the monthly level.
ECONOMIC CONFIDENCE MODEL CORRELATION
Here in NY Gold Futures, we do find that this particular market has correlated with our Economic Confidence Model in the past. The Last turning point on the ECM cycle low to line up with this market was 2022 and 2015. The Last turning point on the ECM cycle high to line up with this market was 2020 and 2011 and 1996.
MARKET OVERVIEW
NEAR-TERM OUTLOOK
The historical perspective in the NY Gold Futures included a rally from 2015 moving into a major high for 2020, from which the market has been in a bearish trend since then moving into the low in 2022 forming a reactionary trend of 2 years bottoming at 16183. Nevertheless, we have not elected any Yearly Bearish Reversal to date from the turning point of 2020, which tends to warn that the 2020 high could still be challenged until we elect a Yearly Bearish Reversal. Notwithstanding, 2022 was, in fact, an outside reversal to the downside closing lower than the previous year. Nevertheless, we have not elected any Yearly Bullish Reversal to date from the turning point of 2020 from this 2020 reaction low.
Curiously, the market has been only consolidating since that 2022 low and has been unable to exceed the high of that year while holding the low. The last Yearly Reversal to be elected was a Bullish at the close of 2022.
This market remains in a positive position on the weekly to yearly levels of our indicating models. Nevertheless, it closed last year on the weak side down from 2021. Pay attention to the Monthly level for any serious change in long-term trend ahead.
From a perspective using the indicating ranges on the Daily level in the NY Gold Futures, this market remains moderately bullish currently with underlying support beginning at 19964 and overhead resistance forming above at 20098. The market is trading closer to the support level at this time.
On the weekly level, the last important high was established the week of October 23rd at 20197, which was up 3 weeks from the low made back during the week of October 2nd. We have been generally trading up for the past week from the low of the week of November 13th, which has been a move of 3.833%. When we look deeply into the underlying tone of this immediate market, we see it is currently still in a semi neutral posture despite declining from the previous high at 20197 made 4 weeks ago. Still, this market is within our trading envelope which spans between 18669 and 20365.
INTERMEDIATE-TERM OUTLOOK
YEARLY MOMENTUM MODEL INDICATOR
Our Momentum Models are declining at this time with the previous high made 2020 while the last low formed on 2022. However, this market has rallied in price with the last cyclical high formed on 2020 and thus we have a divergence warning that this market is starting to run out of strength on the upside.
After closing above last year's low of 16733 when it was an outside reversal to the downside yet it did close lower. This immediate year, the market did open higher, thus far, but this market has rallied exceeding last year's high. and remains below last year's high of 20788. This market is still above the normal trading yearly envelope where the top remains at 17906. The last Breakout Mode indicator took place in during 2003. The last Crash Mode indicator took place in during 2014.
Looking at the longer-term monthly level, we did see that the market made a high in May at 20854. After a six month rally from the previous low of 19360, it made last high in May. Since this last high, the market has corrected for six months. However, this market has held important support last month. So far here in November, this market has held above last month's low of 18235 reaching 19356.
This market is trading beneath that high of May which was 20854 by more than 2 percent. Critical support still underlies this market at 18107 and a break of that level on a monthly closing basis would warn of a further decline ahead becomes possible. Nevertheless, at this time, the market is still weak.
DiscoverGold
turkey day rally, it usually ends the last hour with an indicator or 2 of how the rest of the year will go
get ready for next thanksgiving, gold could hit 5 figures by then. Every where i pull data or look at fundamentals, it should be multiples of where it is now
The Ord Oracle: GDX Update
By: Tim Ord | November 22, 2023
SPX Monitoring Purposes: Long SPX 10/27/23 at 4117.37. Gain since 12/20/22: Over 26%. Monitoring Purposes GOLD: Long GDX on 10/9/20 at 40.78.

Last Thursday's report said, "above is the Bullish percent index for the Gold Miners index. The bullish percent index measures the percent on stocks that are on point and figure buy signals. For a valid bullish signal, the Bullish Percent index would need to rise. Since the beginning of October, the bullish percent index has been rising from 10% to the current reading of 25%, which in turn shows this market is getting stronger as more stocks trigger buy signals. GDX has not traded above its previous high of the 30.00 range yet, whereas the bullish percent index has made higher highs, suggesting GDX's next test of 30.00 will be exceeded." The bullish percent index now stands at 32.14% and GDX still hasn't broken 30.00.
Read Full Story »»»
DiscoverGold
$GDX above 30 gets interesting. Lower yields ahead?
By: Mike Zaccardi | November 21, 2023
• $GDX above 30 gets interesting. Lower yields ahead?

Read Full Story »»»
DiscoverGold
Jack Chan: Gold Price Exclusive Update
By: Jack Chan | November 19, 2023

Our proprietary cycle indicator is UP.
To public readers of our updates, our cycle indicator is one of the most effective timing tool for traders and investors. It is not perfect, because periodically the market can be more volatile and can result in short term whipsaws. But overall, the cycle indicator provides us with a clear direction how we should be speculating.
Investors
Accumulate positions during an up cycle and hold for the long term.
Traders
Enter the market at cycle bottoms and exit at cycle tops for short term profits.
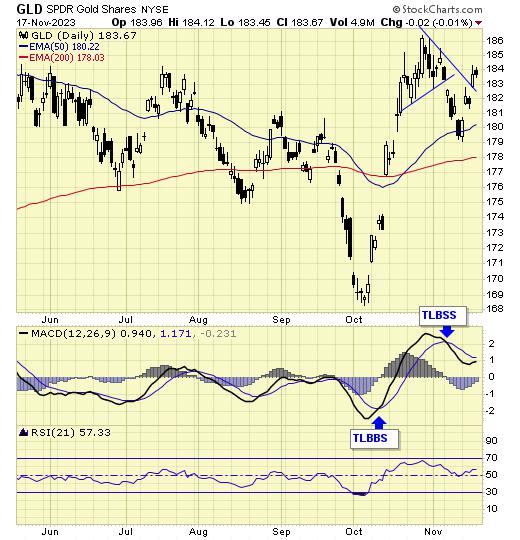
GLD is on short term sell signal.
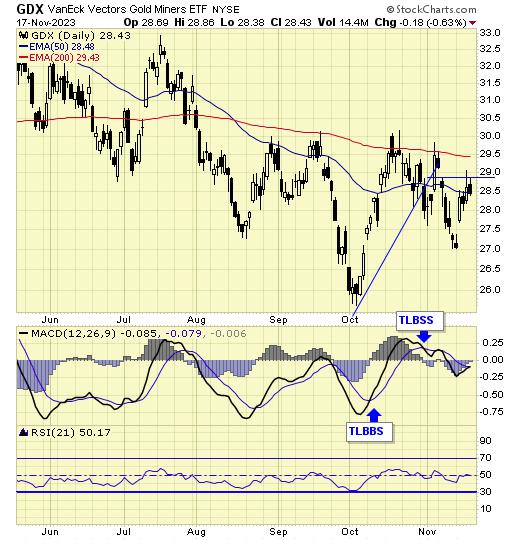
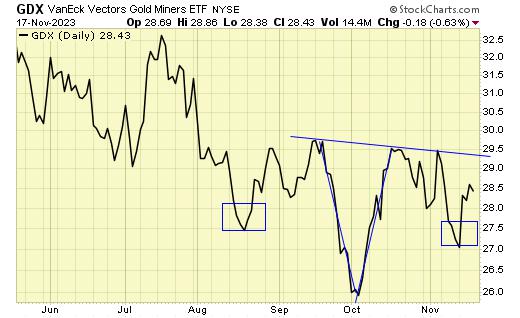
GDX is on short term sell signal.
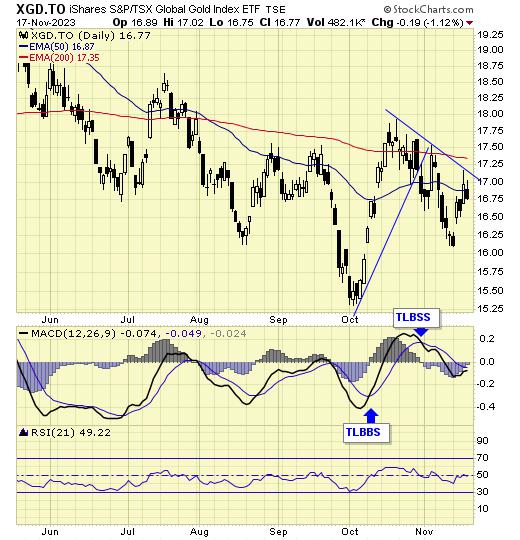
XGD.to is on short term sell signal.
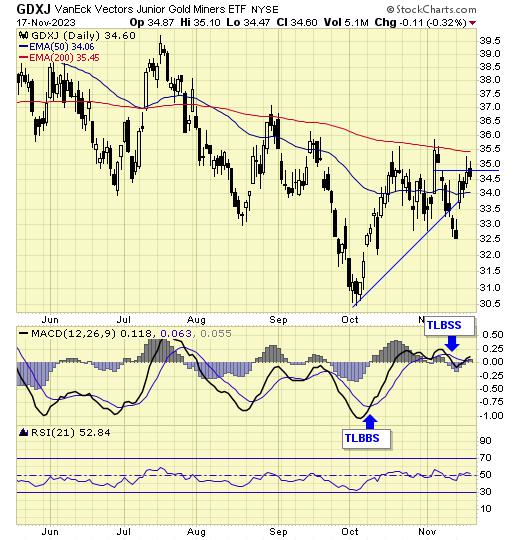
GDXJ is on short term sell signal.
Analysis
Expect higher gold prices overall.
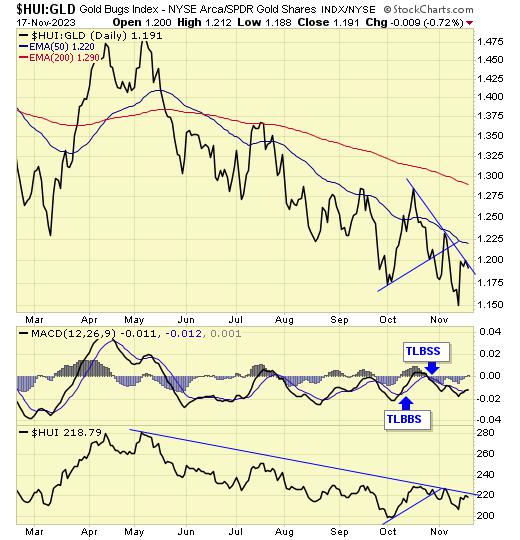
Our ratio is on a sell signal.
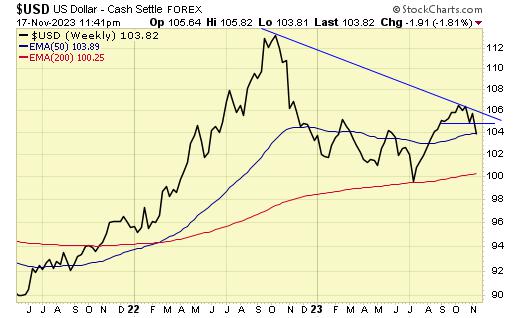
Trend is now DOWN for USD.

Trend is UP for gold stocks.

Trend is UP for gold.
A bottoming pattern in progress.
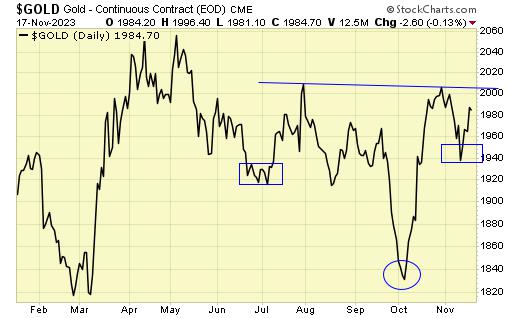
Gold is also in the process of a bottoming pattern.
Summary
Gold sector cycle is up.
Trend is now up for gold and gold stocks, and down for USD.
$$$ We are partially invested.
Read Full Story »»»
DiscoverGold
Gold Miners’ Q3’23 Fundamentals
By: Adam Hamilton | November 17, 2023
The major gold miners just finished reporting fantastic Q3 results. A potent combination of higher gold prices and lower mining costs fueled skyrocketing profits, some of gold stocks’ biggest earnings growth ever! These larger miners were generally able to overcome depletion, leaving their collective output stable. Posting such blowout numbers should help attract institutional investors back to this battered sector.
The GDX VanEck Gold Miners ETF remains this sector’s dominant benchmark. Birthed way back in May 2006, GDX has parlayed its first-mover advantage into an insurmountable lead. Its $11.9b of net assets mid-week dwarfed the next-largest 1x-long major-gold-miners ETF by over 31x! GDX is undisputedly the trading vehicle of choice in this sector, with the world’s biggest gold miners commanding most of its weighting.
Gold-stock tiers are defined by miners’ annual production rates in ounces of gold. Small juniors have little sub-300k outputs, medium mid-tiers run 300k to 1,000k, large majors yield over 1,000k, and huge super-majors operate at vast scales exceeding 2,000k. Translated into quarterly terms, these thresholds shake out under 75k, 75k to 250k, 250k+, and 500k+. Those two largest categories account for over 53% of GDX.
The major gold stocks are languishing really out of favor today, with GDX down 1.7% YTD despite gold rallying 7.5%. Normally the GDX gold stocks leverage material gold moves by 2x to 3x. This past spring, a good GDX upleg soared 63.9% higher amplifying gold’s parallel 26.3% one by 2.4x! This sector hasn’t been devoid of excitement this year, so this festering bearish sentiment looks anomalous and unsustainable.
For 30 quarters in a row now, I’ve painstakingly analyzed the latest operational and financial results from GDX’s 25-largest component stocks. Mostly super-majors, majors, and larger mid-tiers, they dominate this ETF at 87.2% of its total weighting! While digging through quarterlies is a ton of work, understanding the gold miners’ latest fundamentals really cuts through the obscuring sentiment fogs shrouding this sector.
This table summarizes the operational and financial highlights from the GDX top 25 during Q3’23. These gold miners’ stock symbols aren’t all US listings, and are preceded by their rankings changes within GDX over this past year. The shuffling in their ETF weightings reflects shifting market caps, which reveal both outperformers and underperformers since Q3’22. Those symbols are followed by their current GDX weightings.
Next comes these gold miners’ Q3’23 production in ounces, along with their year-over-year changes from the comparable Q3’22. Output is the lifeblood of this industry, with investors generally prizing production growth above everything else. After are the costs of wresting that gold from the bowels of the earth in per-ounce terms, both cash costs and all-in sustaining costs. The latter help illuminate miners’ profitability.
That’s followed by a bunch of hard accounting data reported to securities regulators, quarterly revenues, earnings, operating cash flows, and resulting cash treasuries. Blank data fields mean companies hadn’t disclosed that particular data as of the middle of this week. The annual changes aren’t included if they would be misleading, like comparing negative numbers or data shifting from positive to negative or vice-versa.
Before this latest earnings season got underway, in mid-October I penned an essay on likely gold miners’ fat profits. My thesis then was “much-higher prevailing gold prices and forecast lower costs ought to make for some of this sector’s best earnings growth ever.” That all proved true, making for a fantastic quarter for the major gold miners! This is one of their best in the 7.3 years I’ve been advancing this research.
Production growth trumps everything else as the primary mission for gold miners. Higher outputs boost operating cash flows which help fund mine expansions, builds, and purchases, fueling virtuous circles of growth. Mining more gold also boosts profitability, lowering unit costs by spreading big fixed operational expenses across more ounces. Yet the GDX top 25’s collective output in Q3 fell 6.3% YoY to 8,073k ounces.
For years the world’s largest gold miners have struggled to overcome depletion, which I’ve analyzed in depth in many of this series’ essays. The super-majors and larger majors operate at such vast scales it is really difficult for them to grow their outputs. That’s one reason I’ve long preferred trading smaller mid-tier and junior gold miners. They’ve proven much more able to consistently grow their production from littler bases.
But the GDX top 25’s lower aggregate output in Q3 is distorted by two unusual things. In order to write these weekly web essays early Thursdays, my data and charts have to be finalized by late Wednesdays. One of the world’s biggest gold miners, South Africa’s Gold Fields, dragged its feet in reporting even Q3 operational results. They finally came in overnight leading into Thursday, after my spreadsheets were finished.
Super-major GFI produced 542k ounces of gold last quarter, which boosts the actual GDX-top-25 total to 8,615k. That’s dead-flat compared to the comparable Q3’22’s 8,617k! So the world’s biggest gold miners were able to overcome depletion in Q3’23. And that’s despite king-of-the-hill Newmont really struggling, with Q3 production plunging a whopping 13.2% YoY to 1,290k ounces. That dragged the overall total to flat...
* * *
Read Full Story »»»
DiscoverGold
Gold CoT: Peek Into Future Through Futures, How Hedge Funds Are Positioned
By: Hedgopia | November 18, 2023
• Following futures positions of non-commercials are as of November 14, 2023.
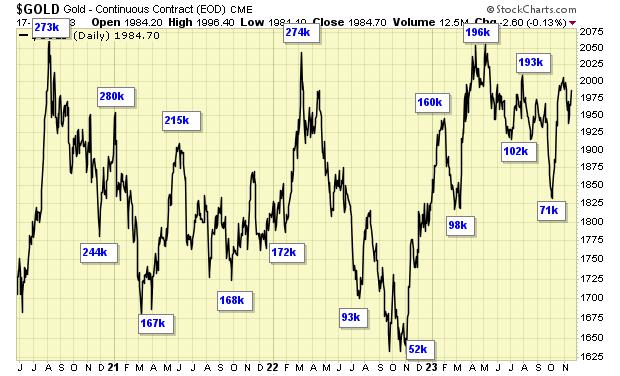
Gold: Currently net long 155.4k, down 10.8k.

Gold bugs defended the 50-day ($1,941) last Friday as well as in the first two sessions this week, leading to reclaiming of the 200-day ($1,949) by Tuesday. In the right circumstances for the bulls, a golden cross is just a matter of time.
For continued momentum, a break above $2,000 is required. This week, gold rallied 2.4 percent to $1,985/ounce. Before this, for four weeks in a row, the metal rallied past $2,000 intraweek but failed to close above.
Non-commercials are acting as if a breakout is just a matter of time. A break will open the door toward $2,080s where the metal has failed several times – in August 2020 when it reached an all-time high of $2,089, in March last year when it printed $2,079 and in May this year when $2,085 was tagged.
Read Full Story »»»
DiscoverGold
NY Gold Futures »» Weekly Summary Analysis
By: Marty Armstrong | November 18, 2023
NY Gold Futures closed today at 19847 and is trading up about 8.67% for the year from last year's settlement of 18262. Caution is now required for this market is starting to suggest it will decline further on the MONTHLY level. As of now, this market is currently trading below last month's close and it had been weak for the past 6 months and if the market continues to remain beneath the previous month's close of 19943, then it will be in a weak position just yet. This price action here in November is suggesting that this has been a bear market trend on the monthly level.
ECONOMIC CONFIDENCE MODEL CORRELATION
Here in NY Gold Futures, we do find that this particular market has correlated with our Economic Confidence Model in the past. The Last turning point on the ECM cycle low to line up with this market was 2022 and 2015. The Last turning point on the ECM cycle high to line up with this market was 2020 and 2011 and 1996.
MARKET OVERVIEW
NEAR-TERM OUTLOOK
The historical perspective in the NY Gold Futures included a rally from 2015 moving into a major high for 2020, from which the market has been in a bearish trend since then moving into the low in 2022 forming a reactionary trend of 2 years bottoming at 16183. Even so, we have not elected any Yearly Bearish Reversal to date from the turning point of 2020, which tends to warn that the 2020 high could still be challenged until we elect a Yearly Bearish Reversal. Notwithstanding, 2022 was, in fact, an outside reversal to the downside closing lower than the previous year. Distinctly, we have elected four Bullish Reversals to date. .
Curiously, the market has been only consolidating since that 2022 low and has been unable to exceed the high of that year while holding the low. The last Yearly Reversal to be elected was a Bullish at the close of 2022.
This market remains in a positive position on the weekly to yearly levels of our indicating models. Nevertheless, it closed last year on the weak side down from 2021. Pay attention to the Monthly level for any serious change in long-term trend ahead.
The perspective using the indicating ranges on the Daily level in the NY Gold Futures, this market remains moderately bullish currently with underlying support beginning at 19753 and overhead resistance forming above at 19874. The market is trading closer to the resistance level at this time.
On the weekly level, the last important high was established the week of October 23rd at 20197, which was up 3 weeks from the low made back during the week of October 2nd. We have seen the market drop sharply for the past week penetrating the previous week's low and yet it recovered to close above the previous week's close of 19377. We are still trading neutral on the Weekly Momentum Indicators and this is a warning that initial support has been breached. This strongly implies we should pay close attention now to the Weekly Bearish Reversals. If we begin to elect Weekly Bearish Reversals, then we are dealing with a more sustainable near-term correction. When we look deeply into the underlying tone of this immediate market, we see it is currently still in a semi neutral posture despite declining from the previous high at 20197 made 3 weeks ago. Still, this market is within our trading envelope which spans between 17373 and 21563.
INTERMEDIATE-TERM OUTLOOK
YEARLY MOMENTUM MODEL INDICATOR
Our Momentum Models are declining at this time with the previous high made 2020 while the last low formed on 2022. However, this market has rallied in price with the last cyclical high formed on 2020 and thus we have a divergence warning that this market is starting to run out of strength on the upside.
After closing above last year's low of 16733 when it was an outside reversal to the downside yet it did close lower. This immediate year, the market did open higher, thus far, but this market has rallied exceeding last year's high. and remains below last year's high of 20788. This market is still above the normal trading yearly envelope where the top remains at 17906. The last Breakout Mode indicator took place in during 2003. The last Crash Mode indicator took place in during 2014.
Looking at the longer-term monthly level, we did see that the market made a high in May at 20854. After a six month rally from the previous low of 19360, it made last high in May. Since this last high, the market has corrected for six months. However, this market has held important support last month. So far here in November, this market has held above last month's low of 18235 reaching 19356.
This market is trading beneath that high of May which was 20854 by more than 2 percent. Critical support still underlies this market at 18107 and a break of that level on a monthly closing basis would warn of a further decline ahead becomes possible. Nevertheless, at this time, the market is still weak.
DiscoverGold |
Followers
|
149
|
Posters
|
|
|
Posts (Today)
|
0
|
Posts (Total)
|
5566
|
|
Created
|
06/29/08
|
Type
|
Free
|
| Moderators DiscoverGold trunkmonk | |||

http://www.vaneck.com/index.cfm?cat=3192&tkr=GDX&LN=3-02
The Gold Miners ETF seeks to replicate as closely as possible, before fees and expenses, the price and yield performance of the NYSE Arca Gold Miners Index. The Index provides exposure to publicly traded companies worldwide involved primarily in the mining for gold, representing a diversified blend of small-, mid- and large-capitalization stocks. As such, the Fund is subject to the risks of investing in this sector.
| ||||||||||||||||||||||||||||||||||||||||||||||||||||||||||||||||||||||||||||||||||||||||||||||||||||||
| DAILY |
| WEEKLY |
| Volume | |
| Day Range: | |
| Bid Price | |
| Ask Price | |
| Last Trade Time: |


