


| Followers | 686 |
| Posts | 142524 |
| Boards Moderated | 35 |
| Alias Born | 03/10/2004 |
Thursday, November 30, 2023 9:05:36 AM
By: Markets & Mayhem | November 30, 2023
SPX Monitoring Purposes; Long SPX 10/27/23 at 4117.37. Gain Since 12/20/22: Over 26%. Monitoring Purposes GOLD: Long GDX on 10/9/20 at 40.78.
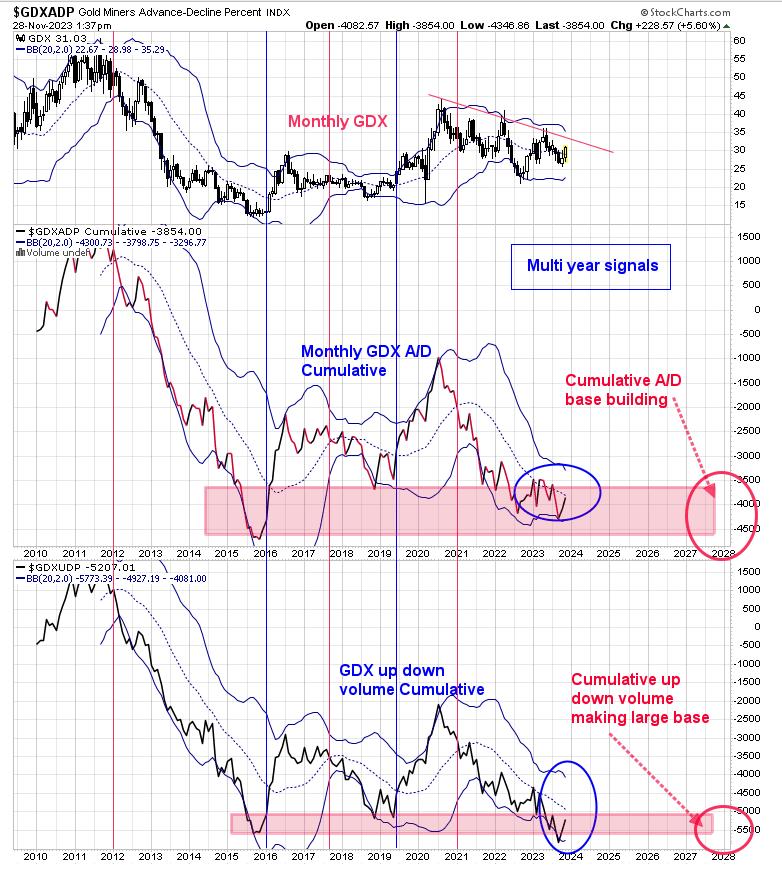
There is a very good likelihood of a multi-year signal triggering for GDX in the coming months.
The above chart is on the monthly time frame. The bottom window is the GDX Cumulative Up Down Volume percent, and the next higher window is the GDX Cumulative Advance/Decline percent. These signals generate after a bottom is in, but, once they are triggered, the signal can last many months or years. Bullish signals are generated when both indicators close above mid-Bollinger bands (noted with blue lines) and bearish signals when both indicators close below mid-Bollinger bands (noted with red lines).
Both monthly indicators reached near the 2016 low (noted with pink shaded areas), noting an oversold market. The last sell signal came in early 2021 (nearly 3 years ago), and is now nearing a bullish crossover of the mid-Bollinger band, which may take another month of two. We do have evidence that a worthwhile low has formed already and a bullish mid-Bollinger band crossing of both indicators above will signal that a multi-month, if not a multi year, rally is coming.
Tim Ord,
Editor
Read Full Story »»»
 DiscoverGold
Information posted to this board is not meant to suggest any specific action, but to point out the technical signs that can help our readers make their own specific decisions. Caveat emptor!
• DiscoverGold
Recent GDX News
- YieldMax GDXY Name Change • GlobeNewswire Inc. • 01/25/2024 04:22:00 PM
- Surging S&P 500 Breadth • ValueWalk • 07/19/2023 03:16:37 PM
- S&P 500 Corrects In Breadth • ValueWalk • 07/18/2023 03:08:49 PM
- If The USDX Fell So Much, Why Didn’t Gold Truly Soar? • ValueWalk • 07/17/2023 05:16:20 PM
- USD’s Decline That’s… Bearish For Gold?! • ValueWalk • 07/12/2023 02:38:08 PM
- S&P 500 Late Day Reversal Worry • ValueWalk • 07/10/2023 03:17:34 PM
- Massive Gaming Celebrates Global Launch of House of Blackjack with USDC Earning Race • ValueWalk • 07/10/2023 02:44:17 PM
Panther Minerals Inc. Launches Investor Connect AI Chatbot for Enhanced Investor Engagement and Lead Generation • PURR • Jul 9, 2024 9:00 AM
Glidelogic Corp. Becomes TikTok Shop Partner, Opening a New Chapter in E-commerce Services • GDLG • Jul 5, 2024 7:09 AM
Freedom Holdings Corporate Update; Announces Management Has Signed Letter of Intent • FHLD • Jul 3, 2024 9:00 AM
EWRC's 21 Moves Gaming Studios Moves to SONY Pictures Studios and Green Lights Development of a Third Upcoming Game • EWRC • Jul 2, 2024 8:00 AM
BNCM and DELEX Healthcare Group Announce Strategic Merger to Drive Expansion and Growth • BNCM • Jul 2, 2024 7:19 AM
NUBURU Announces Upcoming TV Interview Featuring CEO Brian Knaley on Fox Business, Bloomberg TV, and Newsmax TV as Sponsored Programming • BURU • Jul 1, 2024 1:57 PM

