 News
News  Market Data
  Discover
Support: 888-992-3836
Copyright © 2023 InvestorsHub Inc.


Register for free to join our community of investors and share your ideas. You will also get access to streaming quotes, interactive charts, trades, portfolio, live options flow and more tools.
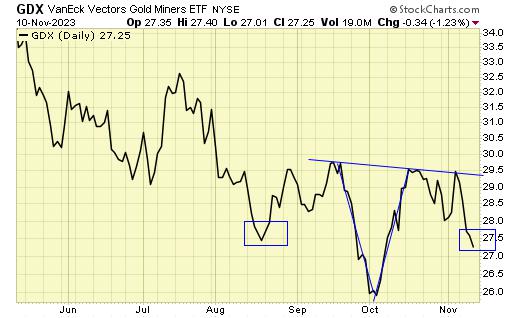
GDX let's see how fast this reverse HnS fails..
By: Mike Zaccardi | November 14, 2023
• $GDX let's see how fast this reverse HnS fails..

Read Full Story »»»
 DiscoverGold
Jack have proprietary indicator for the Feds economy just went off the rails? anyone following debt and interest rates knew this was coming. He has way outdone the damage that was done in the 90s by Greenspan and company, then later Alen says he didnt have the indicators available to see the mistakes he made. Mr riddle just drifted to the background and did books and speeches along with other morons like Paulson. Tbill sales, way to many repos, way too high interest rates, way to much in the wrong direction, will leave billions in its wake in the next 2 years. cryptocretans like Saylor are back pumping their garbage house of cards crypto and BTC. Blackrock and CME gonna provide the greatest transfer of wealth know to man, then fed will save the day with fedcoin, most likely loosly based on gold. he will have to, otherwise BRICS will replace US system. only way out for US is WWIII or gold backed fiat, real money will save the day, not crypto, which will be shut down to protect fedcoin, from what i know.
Debt is now getting racked up at 20B/day, yes per day. idiots and greed caused it, nothing else.
Jack Chan: Gold Price Exclusive Update
By: Jack Chan | November 11, 2023
Our proprietary cycle indicator is UP.
To public readers of our updates, our cycle indicator is one of the most effective timing tool for traders and investors. It is not perfect, because periodically the market can be more volatile and can result in short term whipsaws. But overall, the cycle indicator provides us with a clear direction how we should be speculating.
Investors
Accumulate positions during an up cycle and hold for the long term.
Traders
Enter the market at cycle bottoms and exit at cycle tops for short term profits.
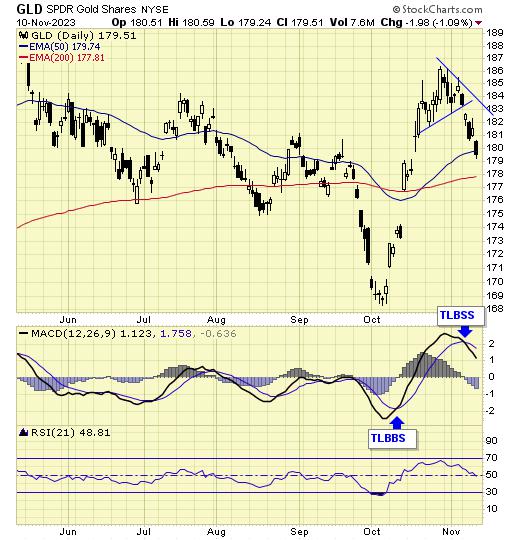
GLD is on short term sell signal.
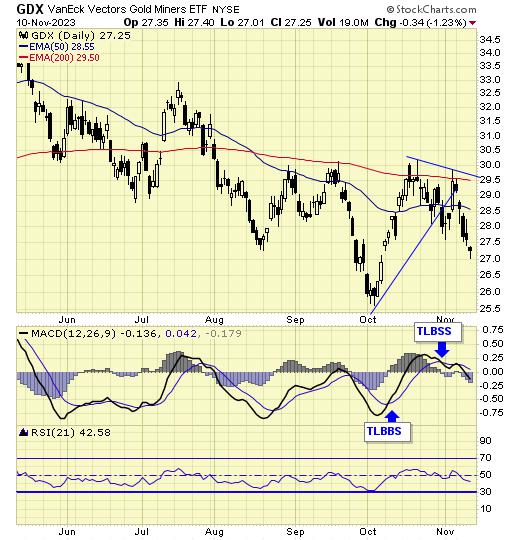
GDX is on short term sell signal.
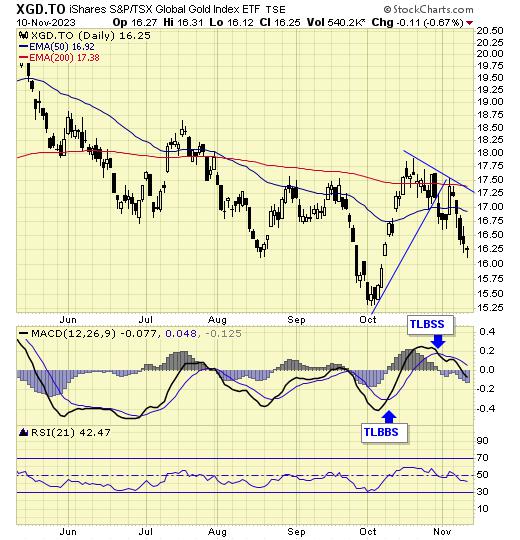
XGD.to is on short term sell signal.
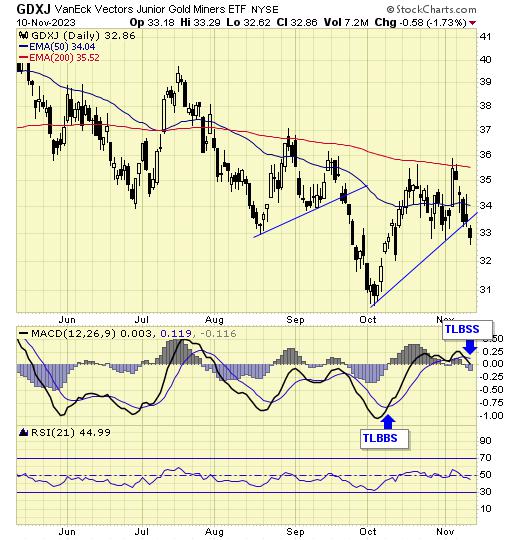
GDXJ is on short term sell signal.
Analysis
Expect higher gold prices overall.
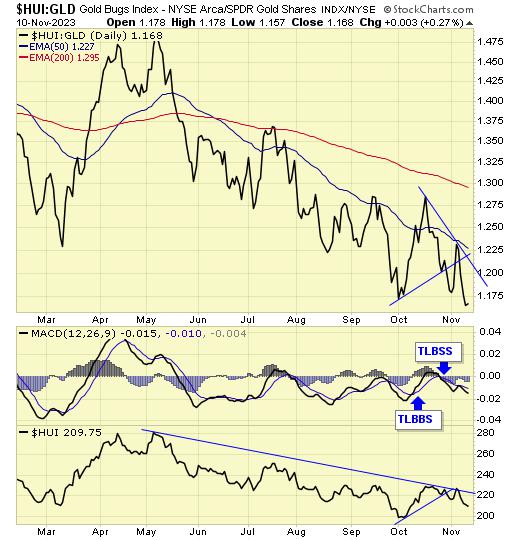
Our ratio is on a sell signal.
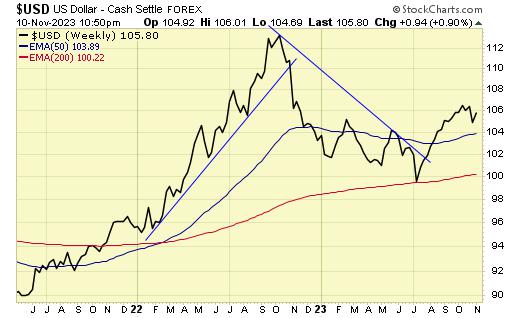
Trend is UP for USD.
Trend is UP for gold stocks.
Trend is UP for gold.
A bottoming pattern in progress.
Gold is also in the process of a bottoming pattern.
Summary
Gold sector cycle is up.
Trend is now up for gold and gold stocks.
$$$ We are partially invested.
Read Full Story »»»
DiscoverGold
$GDX - Closed the week below the 10 week MA and the TSI had a bearish crossover. The bounce out of the October low is over and it's headed lower into the next 23 week cycle low that is due on the week of January 22-26
By: CyclesFan | November 11, 2023
• $GDX - Closed the week below the 10 week MA and the TSI had a bearish crossover. The bounce out of the October low is over and it's headed lower into the next 23 week cycle low that is due on the week of January 22-26. A retest of the September 2022 low can't be ruled out.

Read Full Story »»»
DiscoverGold
NY Gold Futures »» Weekly Summary Analysis
By: Marty Armstrong | November 11, 2023
NY Gold Futures closed today at 19377 and is trading up about 6.10% for the year from last year's settlement of 18262. Caution is now required for this market is starting to suggest it will decline further on the MONTHLY level. At present, this market is currently trading below last month's close and it had been weak for the past 6 months and if the market continues to remain beneath the previous month's close of 19943, then it will be in a weak position just yet. This price action here in November is suggesting that this has been a bear market trend on the monthly level.
ECONOMIC CONFIDENCE MODEL CORRELATION
Here in NY Gold Futures, we do find that this particular market has correlated with our Economic Confidence Model in the past. The Last turning point on the ECM cycle low to line up with this market was 2022 and 2015. The Last turning point on the ECM cycle high to line up with this market was 2020 and 2011 and 1996.
MARKET OVERVIEW
NEAR-TERM OUTLOOK
The historical perspective in the NY Gold Futures included a rally from 1999 moving into a major high for 2020, from which the market has been in a bearish trend since then moving into the low in 2022 forming a reactionary trend of 2 years bottoming at 16183. Distinctly, we have not elected any Yearly Bearish Reversal to date from the turning point of 2020, which tends to warn that the 2020 high could still be challenged until we elect a Yearly Bearish Reversal. Notwithstanding, 2022 was, in fact, an outside reversal to the downside closing lower than the previous year. Distinctly, we have elected all four intermediate Yearly Bullish Reversals to date from the turning point of 2022 from this 2022 reaction low.
Curiously, the market has been only consolidating since that 2022 low and has been unable to exceed the high of that year while holding the low. The last Yearly Reversal to be elected was a Bullish at the close of 2022.
This market remains in a positive position on the weekly to yearly levels of our indicating models. Nevertheless, it closed last year on the weak side down from 2021. Pay attention to the Monthly level for any serious change in long-term trend ahead.
Focusing on our perspective using the indicating ranges on the Daily level in the NY Gold Futures, this market remains moderately bearish position at this time with the overhead resistance beginning at 19628 and support forming below at 18435. The market is trading closer to the resistance level at this time.
On the weekly level, the last important high was established the week of October 23rd at 20197, which was up 3 weeks from the low made back during the week of October 2nd. We have seen the market drop sharply for the past week penetrating the previous week's low and it closed beneath that low which was 19782. This was a very bearish technical indicator warning that we have a shift in the immediate trend. We are still trading neutral on the Weekly Momentum Indicators and this is a warning that initial support has been breached. This strongly implies we should pay close attention now to the Weekly Bearish Reversals. If we begin to elect Weekly Bearish Reversals, then we are dealing with a more sustainable near-term correction. When we look deeply into the underlying tone of this immediate market, we see it is currently still in a semi neutral posture despite declining from the previous high at 20197 made 2 weeks ago. Still, this market is within our trading envelope which spans between 17327 and 21505.
INTERMEDIATE-TERM OUTLOOK
YEARLY MOMENTUM MODEL INDICATOR
Our Momentum Models are declining at this time with the previous high made 2020 while the last low formed on 2022. However, this market has rallied in price with the last cyclical high formed on 2020 and thus we have a divergence warning that this market is starting to run out of strength on the upside.
After closing above last year's low of 16733 when it was an outside reversal to the downside yet it did close lower. This immediate year, the market did open higher, thus far, but this market has rallied exceeding last year's high. and remains below last year's high of 20788. This market is still above the normal trading yearly envelope where the top remains at 17906. The last Breakout Mode indicator took place in during 2003.
Looking at the longer-term monthly level, we did see that the market made a high in May at 20854. After a six month rally from the previous low of 19360, it made last high in May. Since this last high, the market has corrected for six months. However, this market has held important support last month. So far here in November, this market has held above last month's low of 18235 reaching 19369.
This market is trading below that high of May which was 20854 by more than 5 percent. Critical support still underlies this market at 18107 and a break of that level on a monthly closing basis would warn of a further decline ahead becomes possible.
DiscoverGold Load below 1935 spot. Signals say it ain’t goin up yet.
China continues to dominate the gold market with a 12-month buying spree, adding 23 tonnes in October $GDX
History shows Physical Silver offers a hedge against inflation and economic weakness $GDX
Jack Chan: Gold Price Exclusive Update
By: Jack Chan | November 4, 2023

Our proprietary cycle indicator is UP.
To public readers of our updates, our cycle indicator is one of the most effective timing tool for traders and investors. It is not perfect, because periodically the market can be more volatile and can result in short term whipsaws. But overall, the cycle indicator provides us with a clear direction how we should be speculating.
Investors
Accumulate positions during an up cycle and hold for the long term.
Traders
Enter the market at cycle bottoms and exit at cycle tops for short term profits.

GLD is on short term buy signal.

GDX is on short term sell signal.

XGD.to is on short term sell signal.

GDXJ is on short term buy signal.
Analysis

Expect higher gold prices overall.

Our ratio is on a sell signal.

Trend is UP for USD.

Trend is UP for gold stocks.

Trend is UP for gold.

A bottoming pattern in progress.

GDX is testing resistance.

In recent years, gold stocks have a tendency to bottom in the summer/fall time frame.
So far so good.
Summary
Gold sector cycle is up.
Trend is now up for gold and gold stocks.
$$$ We are partially invested.
Read Full Story »»»
DiscoverGold
Gold Stocks Lagging
By: Adam Hamilton | November 3, 2023
The gold miners’ stocks are lagging gold’s strong young upleg, their gains falling behind. Their striking performance gap is undermining gold-stock sentiment, leaving traders even warier of this sector. While definitely vexing, this anomaly has only arisen over the past couple weeks. Gold stocks’ precedent during past major gold uplegs implies this will unwind soon, with miners surging fast to catch up with their metal.
Gold has been blasting higher on balance for a month now, confirming a new major upleg is underway. While the sparking catalyst was certainly geopolitical, gold’s upside since has been fueled by the normal sequential buying pattern driving all major uplegs. That’s stage-one gold-futures short-covering buying, then larger stage-two gold-futures long buying, then ultimately vast stage-three investment buying returning.
These growing capital-inflow stages are telescoping, ignited by preceding stages. Those drive gold high enough for long enough to convince more traders to return, and their buying accelerates gold uplegs. Gold’s sharp spike gains so far have mostly been driven by gold-futures short covering, but long buying has just started ramping up. I wrote a whole essay last week analyzing gold’s new major upleg in depth.
The gold miners’ stocks amplify gold’s gains due to their inherent profits leverage. Their mining costs are largely fixed, so higher gold prices directly translate into higher earnings. This sector’s benchmark is the GDX gold-stock ETF, which includes the world’s biggest gold miners. While their Q3 earnings season is underway, it won’t be finished until mid-November. So Q2’23 results are still the most current we have now.
The top 25 GDX gold miners averaged all-in sustaining costs of $1,380 per ounce in Q2. At $1,820 gold in early October as the last correction bottomed, that yields $440 in unit profits. But at late October’s $2,005, those soar 42.0% to $625 per ounce! That is 4.1x gold’s 10.2% gains at best so far in this young upleg. Higher gold prices drive fatter mining profits, so gold stocks are bid higher reflecting better fundamentals.
Despite this current real-world example, GDX’s major gold stocks tend to amplify material gold moves by 2x to 3x. I’ve done extensive research on gold-stock performance for decades, and that range is where it usually shakes out. Gold’s last major upleg peaked up 26.3% in early May, and GDX powered up 63.2% in that exact 7.2-month span. That made for 2.4x upside leverage, right in line with historical precedent.
Candidly if gold stocks can’t significantly leverage gold, they aren’t worth owning! Gold mining adds all kinds of risks on top of the underlying commodity’s price trends. Those run the gamut from geological to operational to geopolitical. So much can go wrong in gold mining, and traders need to be compensated for those additional risks. If gold stocks only pace and match gold’s gains, sticking to gold is way safer for traders.
GDX’s upside leverage to gold was normal in the first couple weeks of this new upleg. Starting just before the Islamic Resistance Movement invaded Israel to slaughter and kidnap Jews, gold blasted 5.6% higher over eight trading days. GDX shot up 12.2% in that span, for 2.2x leverage. But the major gold stocks had bottomed one day before gold. Include that, and GDX’s nine-trading-day surge grows to 14.0% for 2.5x.
That’s perfectly normal, especially early in uplegs. Naturally herd sentiment keeps improving the longer they run, with greed mounting as gains grow. So gold-stock outperformance tends to peak later in major gold uplegs when universal bullishness reigns. The major gold miners are more likely to double gold’s gains early on while bearishness and skepticism linger, then gradually improve to triple later on as traders believe.
Yet from mid-October to gold’s latest interim high of $2,005 last Friday, gold stocks looked terrible. The yellow metal surged another 4.3% in that span as Israel prepared to invade Gaza to root out the Hamas terrorists and rescue their hostages. Yet unbelievably GDX slumped 1.1% in that span, leaving miserable -0.3x leverage in its wake! Traders would’ve been far better off in gold over those next eight trading days.
That underperformance was so bad that it crushed GDX’s leverage ratio for this entire young gold upleg. Again gold was up 10.2% at best so far over several weeks, but GDX’s gains even starting at its day-earlier low were only 12.7%. That 1.2x leverage has been way too low, making gold stocks not worth owning in that span. Their young parallel upleg with gold has proven very underwhelming technically too.
When gold started mean reverting sharply higher on that massive terrorist attack, GDX quickly recovered to regain its uptrend’s lower support. But major gold stocks slumped since, failing at that key technical line. GDX remains well under its important 200-day moving average, while gold has blasted way above its own. At best recently GDX recovered to just 0.966x its 200dma, while gold shot up to 1.038x its 200dma.
There’s nothing good to say about this latest very-disappointing gold-stock action. With the miners failing to mirror and amplify the metal’s gains, bearish sentiment has soared. Incredibly the gold-stock apathy and skepticism today may rival that of early October before gold surged! Traders are now faced with two pressing questions, why is this happening and how long is it likely to last? I’ve sure been wrestling with them.
Surprisingly the root cause of gold stocks’ underperformance may be the nature of gold’s young upleg. Normally major gold uplegs are birthed out of major lows by some market-based catalyst, like surprises in major US economic data that are Fed-dovish. Examples are cooler-than-expected headline inflation or worse-than-expected US jobs growth, leaving the Fed less likely to hike rates which drives US dollar selling...
Read Full Story »»»
DiscoverGold
Gold CoT: Peek Into Future Through Futures, How Hedge Funds Are Positioned
By: Hedgopia | November 4, 2023
• Following futures positions of non-commercials are as of October 31, 2023.
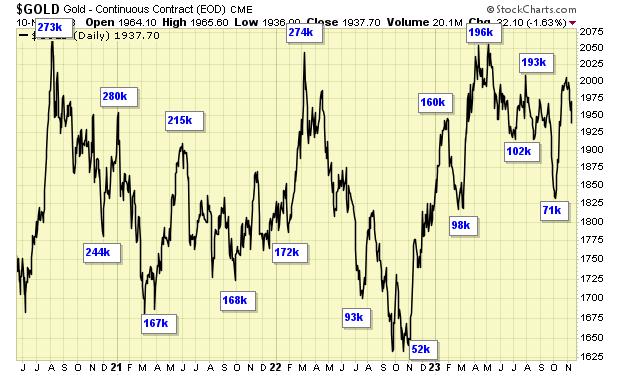
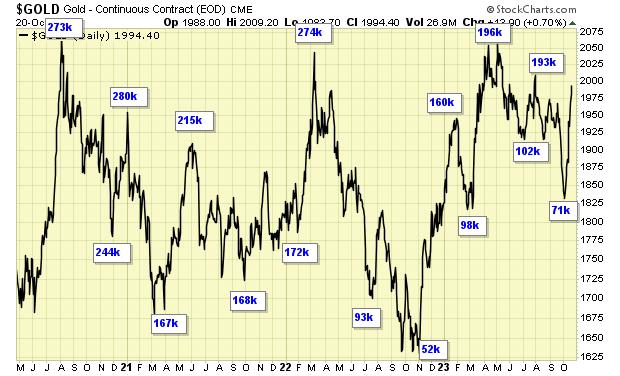
Gold: Currently net long 163.4k, up 14k.

For the third week in a row, gold rallied past $2,000 intraweek, but failed to close above. This week, it opened Monday with a high of $2,018, but finished the week at $1,999. This was preceded by highs of $2,019 and $2,009 in the prior two weeks.
A break above $2,000 would have helped build on the metal’s recent momentum. Before the latest hesitancy around $2,000, gold just about went parabolic after bottoming at $1,824 early last month.
The yellow metal has failed at $2,080s at least twice since August 2020 when it reached an all-time high of $2,089, with a print of $2,079 in March last year and $2,085 in May this year. For another attack on this roadblock, gold bugs probably need to regroup at a lower price point.
Read Full Story »»»
DiscoverGold
NY Gold Futures »» Weekly Summary Analysis
By: Marty Armstrong | November 4, 2023
This market made a new high today after the past 2 trading days. The market opened lower and closed higher. The immediate trading pattern in this market has exceeded the previous session's high intraday reaching 20119. Therefore, this market has rallied over the past 20 trading sessionsNevertheless, this market remains well above all seven of our intial support levels. Nonetheless, the market remains neutral on our system indicators.
This market has not closed above the previous cyclical high of 20197. Obviously, it is pushing against this resistance level.
ECONOMIC CONFIDENCE MODEL CORRELATION
Here in NY Gold Futures, we do find that this particular market has correlated with our Economic Confidence Model in the past. The Last turning point on the ECM cycle low to line up with this market was 2022 and 2015. The Last turning point on the ECM cycle high to line up with this market was 2020 and 2011 and 1996.
MARKET OVERVIEW
NEAR-TERM OUTLOOK
The historical perspective in the NY Gold Futures included a rally from 1999 moving into a major high for 2020, from which the market has been in a bearish trend since then moving into the low in 2022 forming a reactionary trend of 2 years bottoming at 16183. Distinctly, we have not elected any Yearly Bearish Reversal to date from the turning point of 2020, which tends to warn that the 2020 high could still be challenged until we elect a Yearly Bearish Reversal. Notwithstanding, 2022 was, in fact, an outside reversal to the downside closing lower than the previous year. Distinctly, we have elected all four intermediate Yearly Bullish Reversals to date from the turning point of 2022 from this 2022 reaction low.
Curiously, the market has been only consolidating since that 2022 low and has been unable to exceed the high of that year while holding the low. The last Yearly Reversal to be elected was a Bullish at the close of 2022.
This market remains in a positive position on the weekly to yearly levels of our indicating models. Nevertheless, it closed last year on the weak side down from 2021. Pay attention to the Monthly level for any serious change in long-term trend ahead.
Looking at the indicating ranges on the Daily level in the NY Gold Futures, this market remains moderately bullish currently with underlying support beginning at 19874 and overhead resistance forming above at 20177. The market is trading closer to the support level at this time.
On the weekly level, the last important high was established the week of October 23rd at 20197, which was up 3 weeks from the low made back during the week of October 2nd. Afterwards, the market bounced for 3 weeks reaching a high during the week of October 23rd at 19646. Since that high, we have been generally trading down to sideways for the past week, which has been a reasonable move of 2.054% in a reactionary type decline. Nonetheless, the market still has not penetrated that previous low of 18235 as it has fallen back reaching only 2660 which still remains -85.4% above the former low.
When we look deeply into the underlying tone of this immediate market, we see it is currently still in a semi neutral posture despite declining from the previous high at 20197 made 1 week ago. Still, this market is within our trading envelope which spans between 17333 and 21513. The broader perspective, this current rally into the week of October 23rd has exceeded the previous high of 19689 made back during the week of September 18th. This immediate decline has thus far held the previous low formed at 18235 made the week of October 2nd. Only a break of that low would signal a technical reversal of fortune and of course we must watch the Bearish Reversals.
Right now, the market is above momentum on our weekly models hinting this is still bullish for now as well as trend. From a pointed viewpoint, this market has been trading down for the past week.
INTERMEDIATE-TERM OUTLOOK
YEARLY MOMENTUM MODEL INDICATOR
Our Momentum Models are declining at this time with the previous high made 2020 while the last low formed on 2022. However, this market has rallied in price with the last cyclical high formed on 2020 and thus we have a divergence warning that this market is starting to run out of strength on the upside.
After closing above last year's low of 16733 when it was an outside reversal to the downside yet it did close lower. This immediate year, the market did open higher, thus far, but this market has rallied exceeding last year's high. and remains below last year's high of 20788. This market is still above the normal trading yearly envelope where the top remains at 17906. The last Breakout Mode indicator took place in during 2003.
Looking at the longer-term monthly level, we did see that the market made a high in May at 20854. After a six month rally from the previous low of 19360, it made last high in May. Since this last high, the market has corrected for six months. However, this market has held important support last month. So far here in November, this market has held above last month's low of 18235 reaching 19782.
This market is trading beneath that high of May which was 20854 by more than 2 percent. Critical support still underlies this market at 18107 and a break of that level on a monthly closing basis would warn of a further decline ahead becomes possible.
DiscoverGold It’s bad and in fact will get much much worse.
2. Atrocious job composition. Not only was the quantity of jobs poor, the quality (or composition) was absolutely atrocious: of the 150K jobs added in October, 51K, or more than a third was government workers (which as everyone knows aren't real employees as they don't produce anything of value but instead are a tax on the private sector); a
Will Gold Mining Stocks Look Past Q3?
By: Gary Tanashian | October 30, 2023
Gold mining stock charts have not yet confirmed a sustainable rally, and Q3 fundamentals may be a headwind
We have used this daily chart of the gold stock ETF, GDX in written and video updates to keep NFTRH subscribers apprised of the progress of the bounce from the early October low (after previously using the chart to manage the long correction that began with the May double top).
Let’s update the daily technical situation by noting that the GDX rally has halted where it should have halted, as we’ve expected resistance at or below the 200 day moving average (30.49) and/or clear visual resistance at 30. The pullback is in progress and has done a good thing by filling the upper gap as it grinds and tests the 50 day moving average. All normal.
Also normal would be a further drop to fill the lower gap and test the 26.60 area to either confirm that the October 2nd breakdown was a false one (bear trap) or a scout for perhaps one final drop to make a bottom. Technically, it was a violation of the March low, which implies bearish, but that is exactly why it could have been a bear trap. False breakdowns are a ‘thing’ in TA.
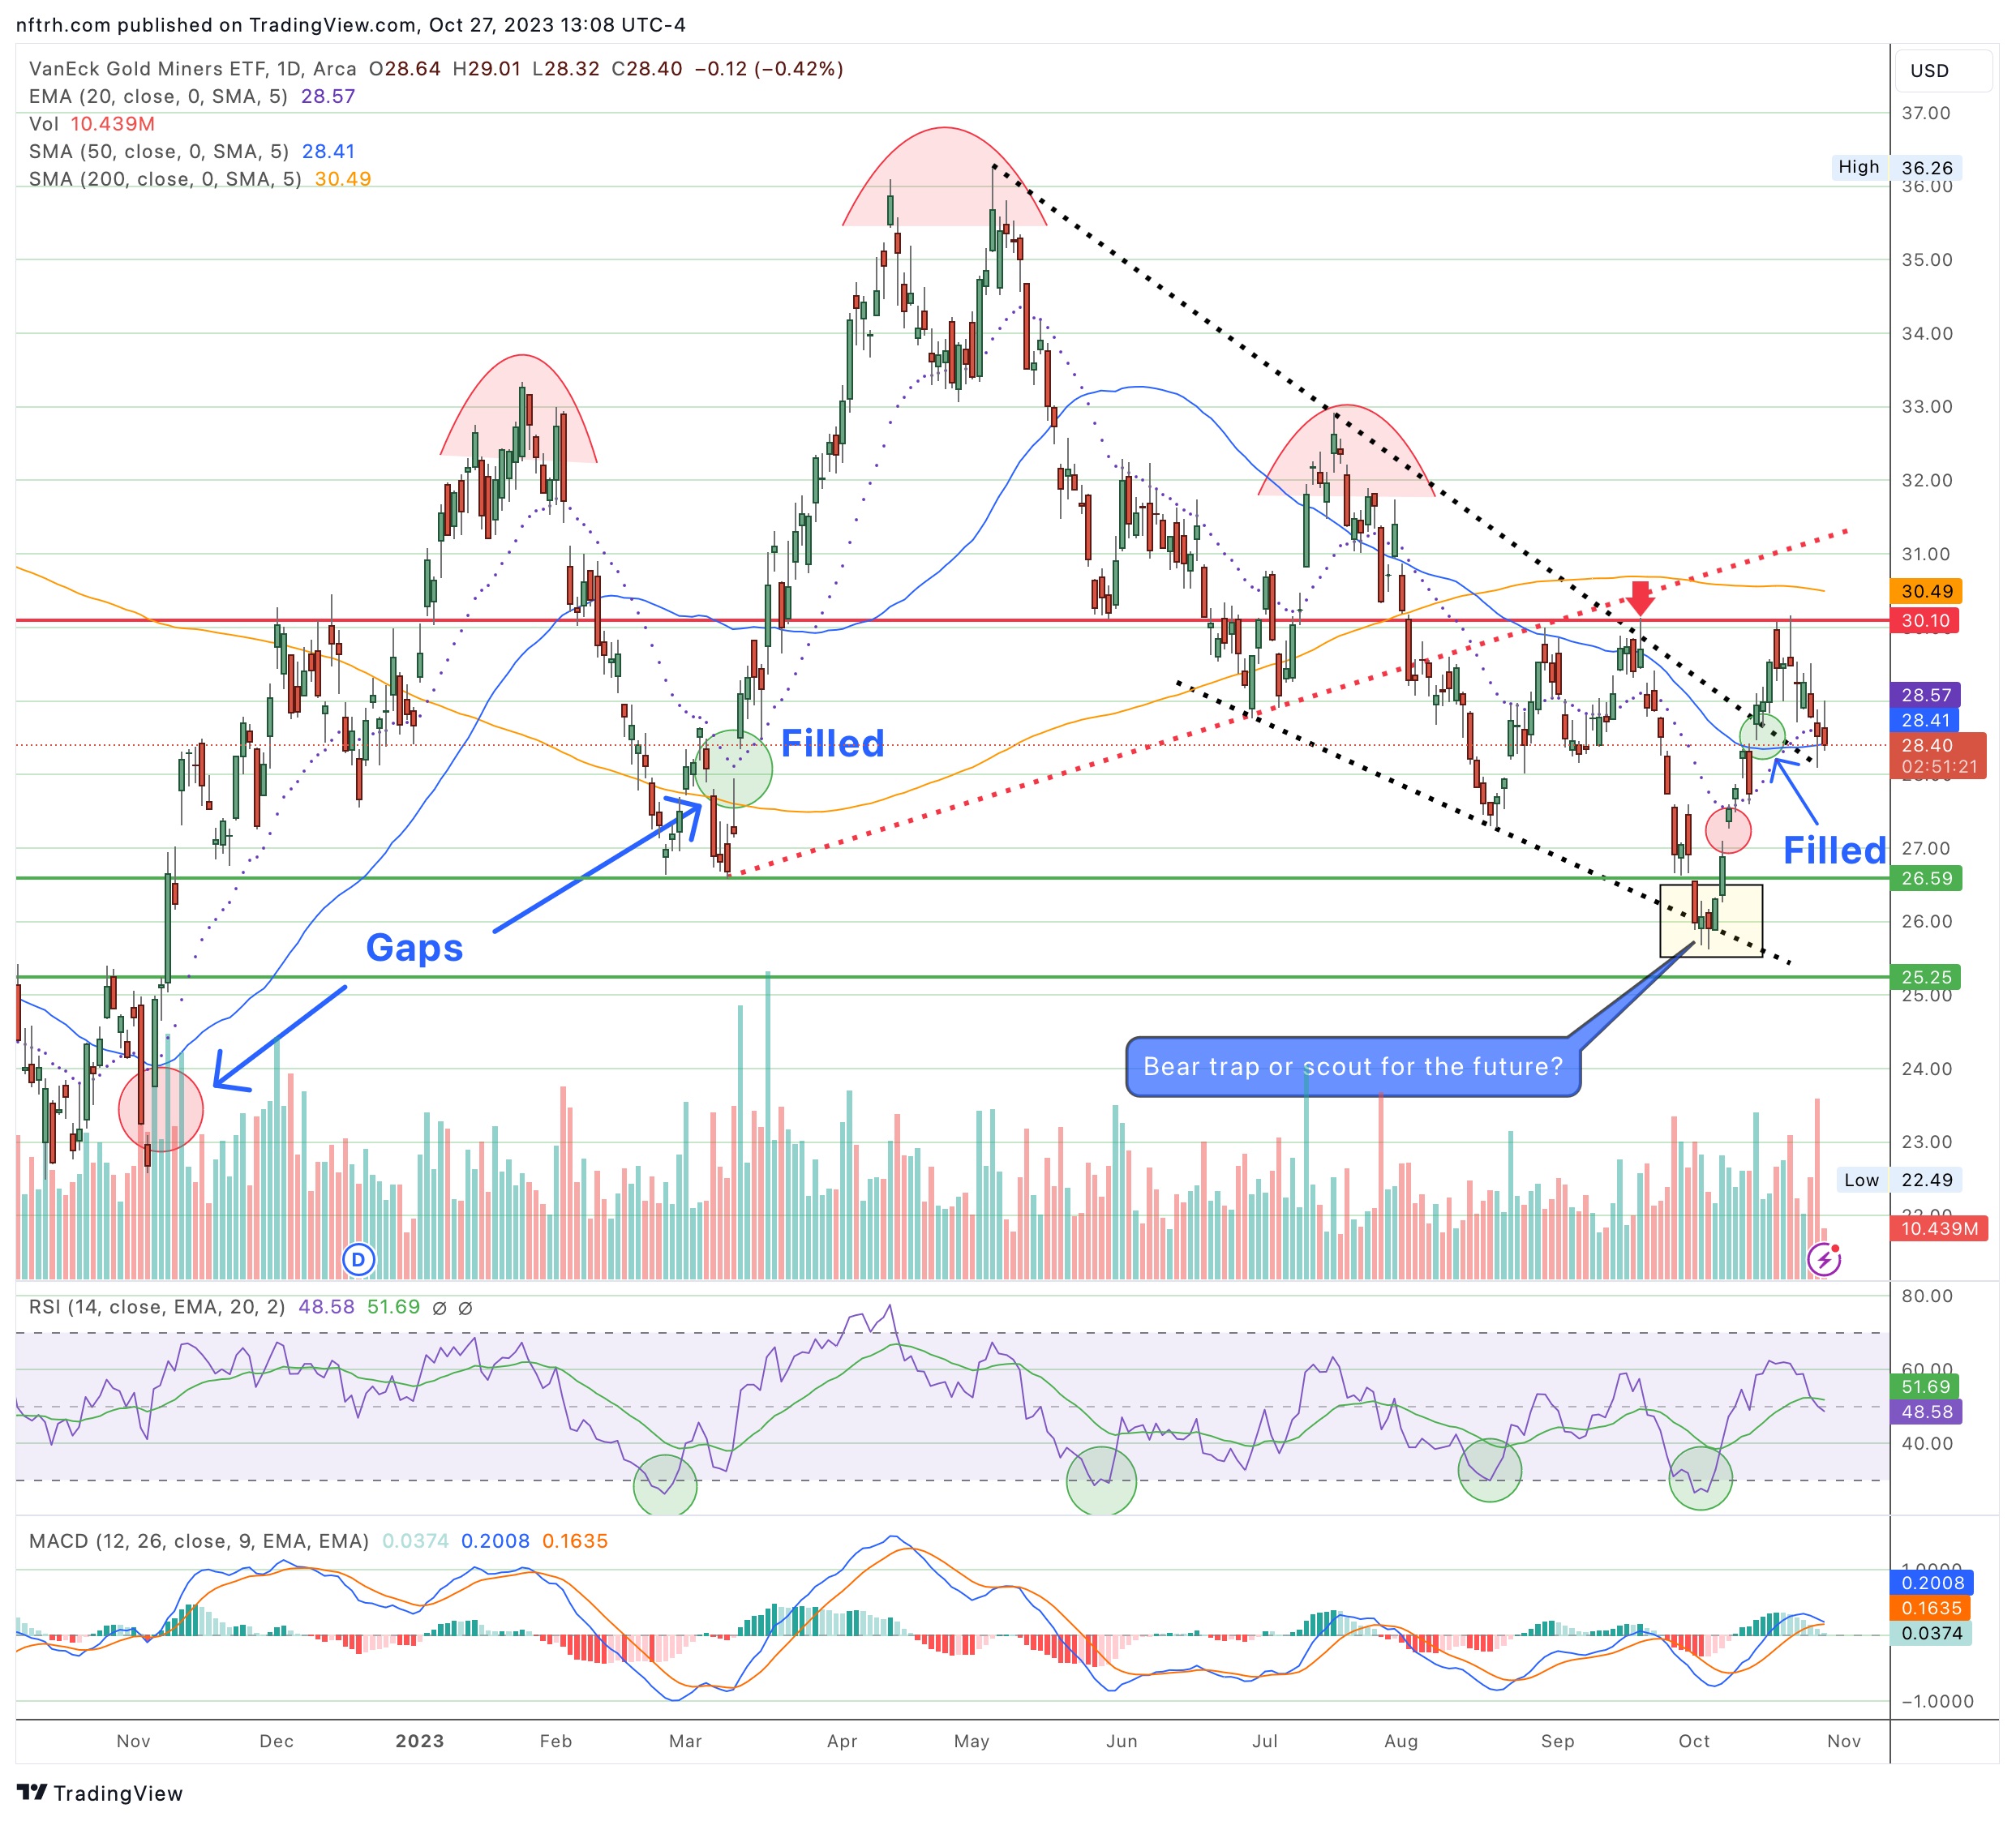
The sentiment and oversold conditions at the early October low were powerful enough to spring a strong rebound or even to end the bear phase in force since May. The break above the top of the falling wedge on the chart above was a positive, as a falling wedge in this case is a massive bull flag. However, I regard falling and rising wedges among the less reliable patterns in TA. So there’s your caveat.
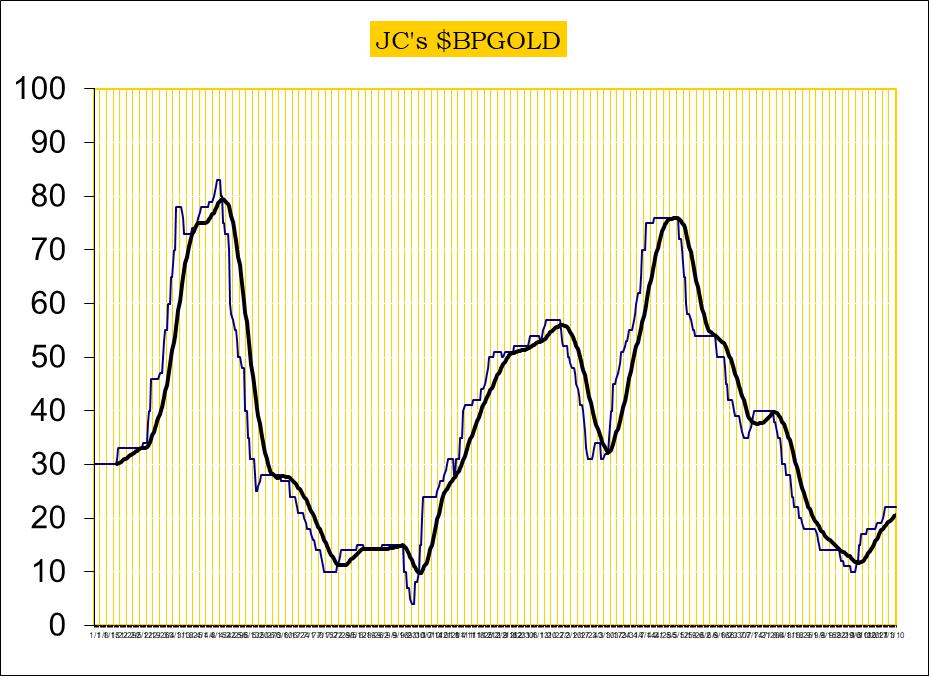
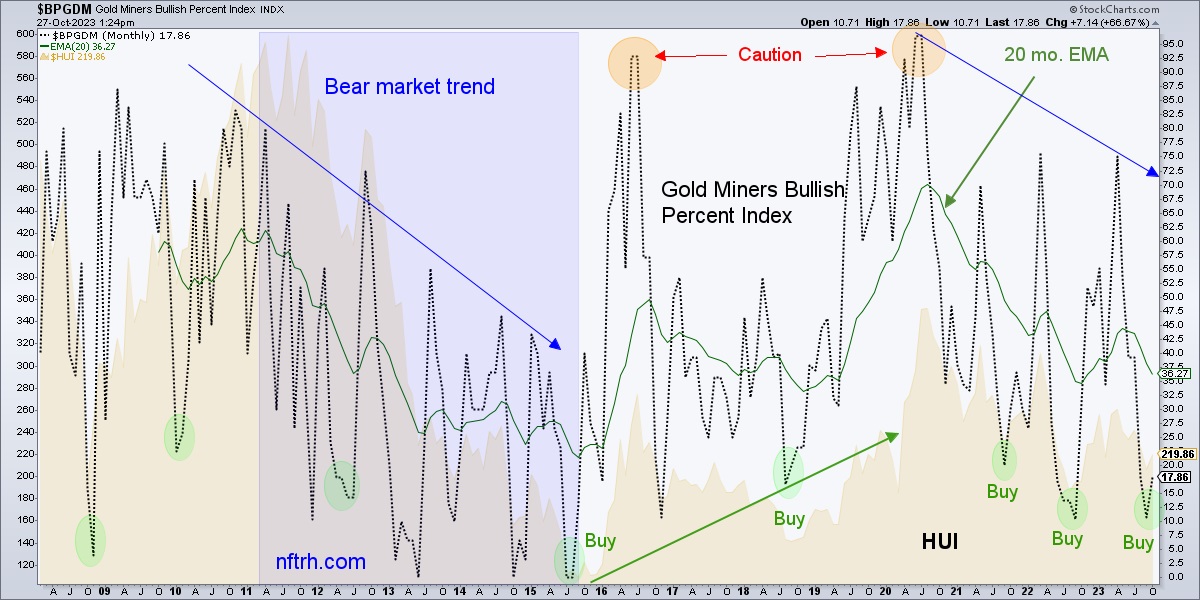
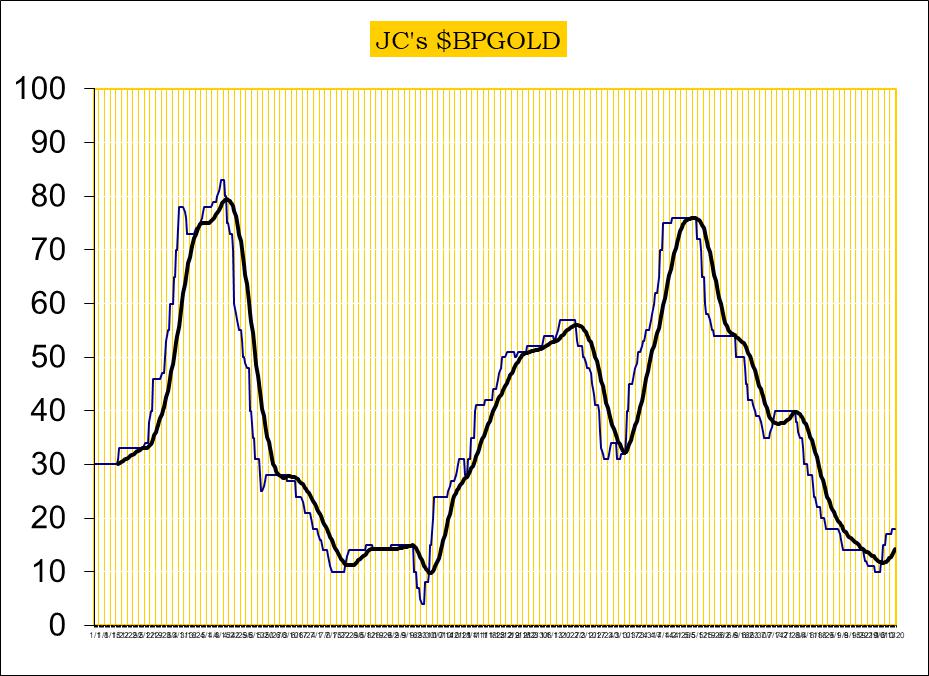
On the plus side, the Gold Miners Bullish Percent Index shows a still deeply oversold condition. When the BPGDM 20 month EMA hits lows as it did a few weeks ago it tends to spring back much harder than it has currently. This implies that there is more fuel to the rally from this perspective.
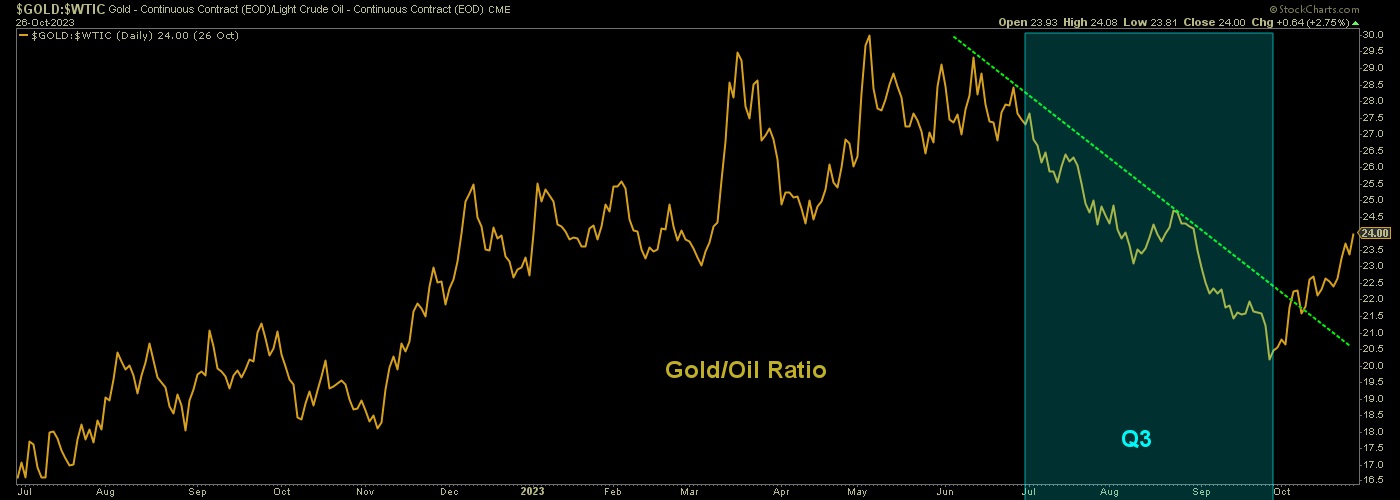
There are a couple concerning signals in play that will remain proprietary to NFTRH for review this weekend. But here is one that conventional gold mining analysts should be considering. We first noted this in NFTRH a few weeks ago. The Gold/Oil ratio (GOR) was negative for the entirety of the Q3 period that is about to be reported this earnings season. Crude Oil/Energy is a large factor in mining costs and the miners’ product under-performed in Q3. The questions now are…
• To what degree does the ratio impact the miners’ bottom lines and has the impact been factored?
• Will the market be smart enough to look ahead, rather than react to what is already behind?
If the market is looking ahead it sees the GOR breaking the downtrend and turning up. The GOR is not nearly a comprehensive fundamental indicator for gold mining stocks. But it is a very primary one, and if this breakout continues mining operational fundamentals will improve nicely.
Bottom Line
As the technical situation stalls where it is supposed to stall, a still deeply depressed sector is not carrying much froth, which is contrary positive. The short-term technical situation is stalled after all, not broken.
However, the sector has been fairly ‘anti-USD’ and painted more often than not with the brush that paints commodities. Again, we are managing signals in play that are concerning for the anti-USD/inflation trades. But for the purposes of this article, note that the techncials are at a decision point while the fundamentals (including and beyond the GOR) make moves to improve. When viewing the macro funda, there is a whole range of items that need to be considered and factored, which we do in weekly reports and NFTRH+ updates.
That said, watch this earnings season closely. If the sector bulls (first objective: take out the SMA 200 on GDX) it could be looking ahead to the improving macro I see for 2024, and if it puts on a final decline – and the fundamentals continue to improve – we’ll have a table pounder of a buying opportunity. That opportunity would come at the expense of those who’ve been guided by, and acted upon improper fundamental analysis not only since 2020, but on the long inflationary phase from 2003 to 2023.
To the surprise of most, the gold mining sector will become something special only when the Inflation > Disinflation/Goldilocks progression we are currently experiencing morphs to a deflation scare. And if the Fed’s hands are still tied and it cannot or will not effectively commit inflationary bailouts of bubble assets once again, so much the better for the long-term health of the gold mining sector.
Read Full Story »»»
DiscoverGold
Is everybody ready????
GDX 1.34 million share #darkpool print at $29.15
By: FLOWrensics | October 30, 2023
• $GDX 1.34 million share #darkpool print at $29.15
Top Holdings: $NEM $ABX $FNV $AEM $WPM.

Read Full Story »»»
DiscoverGold
Gold CoT: Peek Into Future Through Futures, How Hedge Funds Are Positioned
By: Hedgopia | October 28, 2023
• Following futures positions of non-commercials are as of October 24, 2023.
Gold: Currently net long 149.4k, up 36.6k.

Gold tried to build on the recent momentum when it rallied 2.7 percent last week and 5.2 percent the week before, but scraped by a 0.2-percent gain this week to $1,998.50/ounce. In fact, Friday’s intraday high of $2,019 would have easily surpassed last week’s high, closing above the psychologically important $2k, but gold bugs could not quite pull it off.
The daily is now beginning to get stretched. The yellow metal has failed at $2,080s at least twice since August 2020 when it reached an all-time high of $2,089, with a print of $2,079 in March last year and $2,085 in May this year. Looks like the bulls will have to regroup at a lower level so they can launch another attack at that resistance.
Read Full Story »»»
DiscoverGold
Gold’s New Major Upleg
By: Adam Hamilton | October 28, 2023
A new major upleg is underway in gold, which should easily achieve new all-time-record highs. That will greatly boost investor interest and capital inflows into this leading alternative asset. Despite gold’s sharp V-bounce, speculators’ gold-futures positioning remains really bullish. Their huge normalization buying still coming ought to drive gold high enough for long enough to attain records and attract back investors.
In just the last several weeks, gold has exploded 8.8% higher to $1,980 as of Wednesday! That blistering mean-reversion rebound followed a violent breakdown. Gold had been near $1,931 leading into the late-September FOMC meeting. While top Fed officials didn’t hike rates again, they did slash their year-end-2024 rate-cut forecast in half to 50 basis points. That hawkish surprise unleashed big US-dollar buying.
Over the next couple weeks the benchmark US Dollar Index surged 1.8% higher, extending its massive bear rally since mid-July to 7.3%. Gold wilted as the dollar surged, plunging 5.3% in that span. The gold-futures speculators who dominate gold’s short-term price action look to the dollar for their primary trading cues. Gold dropped as low as $1,820 in early October, knifing below an important technical milestone.
Like all secular bull markets, gold’s meander through upleg-correction cycles. Its last upleg powered a big 26.3% higher over 7.2 months into early May. Uplegs crest because herd greed grows excessive and sucks in all available near-term buyers. Subsequent selloffs are necessary to rebalance sentiment and technicals. They are classified as either pullbacks or corrections, with the dividing threshold running 10%.
Before late September’s hawkish 2024 dots, gold’s total selloff was 7.9% at worst. That was still pullback-grade, meaning gold’s upleg was technically intact. But as that post-hawkish-surprise selloff mounted, gold edged into formal 10%+ correction territory as October dawned. A few days later, gold’s total selloff extended to 11.3% as that recent nadir was hit. Gold rolling over into a correction reset its upleg cycle.
That’s a big deal technically. Since pullbacks are mid-upleg rebalancings within still-running uplegs, they don’t reset potential upleg gains. At that 26.3% in early May, gold’s latest upleg was already quite large. It could’ve grown bigger still, as a pair of monster gold uplegs crested up 42.7% and 40.0% in 2020! This latest upleg challenging those mighty 40%ish gains was probably its best-case upside scenario.
And that would’ve been awesome had that gold upleg not been prematurely truncated by the Fed. A 40% upleg off late September 2022’s deep stock-panic-grade $1,623 low would’ve catapulted gold back up near $2,275. That would’ve been way into nominal-record-high territory, way exceeding gold’s August 2020 all-time closing peak of $2,062. Besting that would’ve required a marginally-bigger 27.0% total upleg.
But this latest hawkish-Fed-induced gold correction formally slayed that last upleg, so a new one was just born a few weeks ago. And that started from a much-higher base of $1,820. From there gold would only need to rally a modest 13.3% to achieve new record closes, which is just a small upleg by gold standards. And as of midweek, gold’s sharp mean-reversion bounce has already covered fully 2/3rds of that ground!
New nominal record closes are merely 4.1% higher from here, which is within spitting distance. Since its latest bottoming, gold has enjoyed big daily rallies of 1.8%, 3.2%, 1.4%, and 1.3%. A few more up days like these will start writing gold into the record book. That will change everything for gold psychologically, starting to attract in legions of new investors. They love chasing winners with strong upside momentum.
As an alternative asset, gold usually flies under the radars of most investors. But bullish financial-media coverage of gold will explode as it challenges and hits new record closes. That will quickly spread awareness of gold’s young upleg, and increasingly stoke widespread greed. The resulting big investment capital inflows will become self-feeding. The more investors buy, the higher gold rallies, the more they want to buy.
That has great potential to ultimately grow this new major upleg into a monster rivaling 2020’s 40%+ ones. Gold hasn’t enjoyed strong investment demand since then, with gold investors largely missing in action in recent years. A 40% upleg from gold’s recent lows would leave it way up near $2,550! The long string of new record highs between $2,062 and there would fuel great investor enthusiasm for reallocating into gold.
Today’s young gold upleg has very-high odds of growing into major status over 20% gains because of how gold uplegs are fueled. They are driven by three distinct sequential stages of buying. The first is gold-futures short-covering buying, the second gold-futures long buying, and the third investment buying. These are telescoping, growing increasingly larger and requiring the prior stage’s gold gains to ignite them.
Despite gold’s scorching V-bounce in recent weeks, the stage-one gold-futures short covering isn’t even expended yet. And the much-bigger stage-two gold-futures long buying has barely even started! Later the enormous stage-three investment buying will ignite off super-low base levels, portending massive gold upside. This chart reveals how both types of speculators’ gold-futures buying have stacked up in this upleg.
Gold is superimposed over total spec longs and shorts published in the weekly Commitments of Traders reports. This data current to Tuesday closes isn’t released until late Friday afternoons. So the latest CoT data available when this essay was published was as of October 17th. Gold closed at $1,922 that day, and has blasted much higher to $1,980 since. So specs have done more buying than this chart shows.
With investors mostly abandoning gold in recent years, spec gold-futures trading has driven all its uplegs and corrections. All are noted here, along with the changes in spec longs and shorts that fueled them. In gold’s last powerful 26.3% upleg into early May, specs added 54.9k long contracts while buying to cover another 87.3k short ones. That added up to gold-equivalent buying of 442.2 metric tons, which is quite large.
And the main reason gold fell 11.3% in that new correction since into early October was specs dumped 36.3k longs while adding 69.3k shorts. That combined for a hefty 328.5t of gold-equivalent selling! So it is no wonder gold plunged into that recent violent breakdown, specs were selling gold futures like crazy. Due to the extreme leverage inherent in that realm, gold-futures trading has an outsized price impact on gold.
This week each contract controlling 100 ounces of gold only required traders to maintain low $7,800 cash margins in their accounts. Yet at midweek gold prices near $1,980, each contract had a notional value way up at $197,980. That enables extreme maximum leverage up to 25.4x, which makes each dollar traded in gold futures 25x more potent in bullying around gold prices than a dollar invested outright!
* * *
Read Full Story »»»
DiscoverGold
Why Gold & Silver Could Do a "Moonshot" Soon...
By: Clive Maund | October 28, 2023
In yesterday’s article THE STATE OF THE WORLD we looked at the complex geopolitics of the world as it spirals into World War 3. This was necessary as we have to take these trends into consideration when attempting to determine the outlook for Precious Metals’ prices, as well as other commodities, in particular oil and gas. With respect to the Mid-East, the Arab (Muslim) world is boiling mad at what Israel is doing to the Palestinians and not just the Arab world. Israel’s brutal and relentless bombardent of Gaza increasingly looks like it is being done in an effort to “stir the pot” and provoke other regional powers like Iran to take drastic action, which would provide the excuse for the US to attack Iran probably involving extensive bombing and possibly even nukes which is something they have been aspiring to do for decades. This they see as a means to pave the way for the creation of a greater Israel, once the Arab world has been beaten into submission and subjugated (as they see it) and would also enable them to forcefully acquire Iran’s oil and other assets. The problem for them, although they seem blissfully unaware of it, is that the Arab world is not as weak and divided as they think it is, especially not after what they have done to the Palestinians, and furthermore they have some very powerful potential allies in the form of China, Russia and Turkey. So this is an incredibly incendiary situation that could quickly devolve into a massive regional war that would have serious global implications and if it does both gold and oil will do a moonshot and this could be a lot closer than most people think.
Now we will proceed to look at a range of most interesting gold and silver charts and by the time we are done looking at them I am confident you will understand clearly why these metals look set to go much much higher, probably in short order.
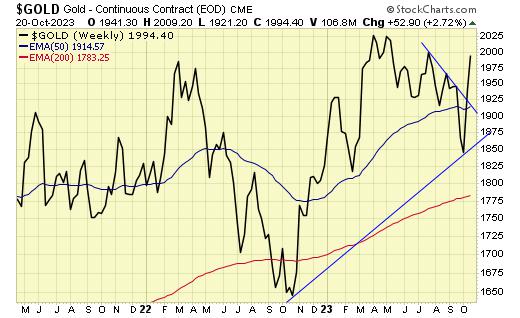
We will start with a quick look at the 10-year gold chart to remind ourselves of the importance of the clear line of strong resistance which has capped the price below about $2100 since mid-2020. Even without an awareness of what is going on in the Mid-East, and soon Taiwan, we can say with confidence that a break clear above $2100 will probably lead to a major advance, but it is also easy to comprehend that taking account of the latest developments including the threatening complete meltdown of the debt market, a break above this resistance could lead to an advance of stunning magnitude.

Moving on, the long-term gold chart going way back to 1980 shows us that although gold has risen above its 2011 highs that marked the end of the 2000’s bullmarket, it is not by much and if we factor in inflation during the intervening years, we appreciate that in real terms it has not yet exceeded its 2011 highs and is probably still somewhat below them. Another interesting point to observe on this chart is that the great 2000’s bullmarket took the form of an orderly steep uptrend, albeit that we saw something of a parabolic blowoff move towards the end.

Now we are going to look at a range of most interesting ratio charts for both gold and silver that turn up some highly illuminating insights.
Beginning with the chart for gold relative to the S&P500 index going way back to 1980 we see that despite gold’s big 2000’s bullmarket it has only modestly outperformed stocks during the period from 2000 to the present. In contrast by the end of the 1970’s – early 1980’s at the end of the strongly inflationary 1970’s the gold to stockmarket ratio was vastly higher. So now, if we reflect on the enormous money creation that occurred in recent years that is now culminating in a vertical spike, which must lead to not just inflation that we already have but to hyperinflation, it is clear that if this ratio only moves part of the way towards the levels it attained in the late 70’s we are looking at a massive increase in the gold price (and / or a massive drop in stock prices) especially as gold and the PM sector have greatly underperformed the stockmarket since gold’s 2011 peak.

Gold’s woeful underperformance relative to stocks since 2011 is made more abundantly clear on the 15-year chart for gold relative to the S&P500 index. Yet despite the ratio making a new low at the end of 2021 it looks like it has been basing since about 2018, implying that outperformance by gold is a growing probability.

Turning now to silver, we know that it has underperformed gold significantly since 2011 which is a bullish sign because when investors favor gold over silver it means that they are more interested in safety than speculative gain so it is a sign of the sort of pessimism that classically accompanies market bottoms. Looking at the long-term chart for silver going way back to 1980 it is remarkable to observe that it is still below the level it was at in 1980 and this is in nominal terms. If we factor inflation in during all the intervening years it is obvious that silver is now very cheap in real terms. On this chart we can also define the broad uptrend of the 2000’s that paralleled gold’s uptrend and we can also see how, disregarding the “head fake” freak Covid crash drop in the Spring of 2020, it then broke out of a large Double Bottom to complete the 1st upleg of the major new bullmarket before pausing ever since to consolidate.

On the 15-year chart for silver relative to the stockmarket (S&P500 index) we can see that silver has been a rotten investment compared to stocks since its 2011 peak with silver having been in a bearmarket until 2020 and the ratio having stayed in a bearmarket until now. That said, however, it certainly looks like the ratio is basing at a low level here. This is the sort of chart that would impel any true contrarían investor to switch out of the stockmarket and into silver. The S&P500 index, shown at the bottom of this chart, looks like it is close to breaking down following a long parabolic blowoff move, and if it does it could crash. However, on this occasion it doesn’t now look likely that gold and silver will be taken down with it. This is because a stockmarket crash will be accompanied by, and perhaps preceded by, a meltdown in the debt market so that Treasuries offer no safe haven as in the past, which is perhaps not so surprising given that the US government is demonstrably bankrupt and running on fumes emanating from the Fed.

We will end with a ratio chart that is viewed as providing compelling evidence that the Precious Metals sector is grossly undervalued with much more upside potential than downside potential and that is the long-term silver over gold ratio chart. This chart is very easy to interpret and use. As a general rule, when the ratio is at a high level it means that there is strong speculative interest in the sector which is a sign of a top and we certainly saw that in 1980 when the ratio was at a wild extreme and again in 2011 to a lesser extent. When the ratio is at a low level it means that speculative interest is at a low level which is a sign of a bottom and this we saw in 2003 before the 2000’s sector bullmarket really got underway and again in 2008 following the steep drop induced by the broad 2008 market crash and then briefly at the time of the Covid crash in the Spring of 2020 when for a brief while you literally couldn’t give oil away. Note that, as mentioned above, a stockmarket crash is not expected to cause the Precious Metals to drop hard as in 2008 apart from perhaps a short-lived knee-jerk reaction, because this time the debt market looks set to drop hard too, and it will probably be a debt market meldown that triggers a stockmarket crash.

The conclusion therefore is that the outlook could scarcely be better for the Precious Metals sector.
Read Full Story »»»
DiscoverGold
Jack Chan: Gold Price Exclusive Update
By: Jack Chan | October 28, 2023

Our proprietary cycle indicator is UP.
To public readers of our updates, our cycle indicator is one of the most effective timing tool for traders and investors. It is not perfect, because periodically the market can be more volatile and can result in short term whipsaws. But overall, the cycle indicator provides us with a clear direction how we should be speculating.
Investors
Accumulate positions during an up cycle and hold for the long term.
Traders
Enter the market at cycle bottoms and exit at cycle tops for short term profits.

GLD is on short term buy signal.

GDX is on short term buy signal.

XGD.to is on short term buy signal.

GDXJ is on short term buy signal.
Analysis

Expect higher gold prices overall.

Our ratio is on a buy signal.

Trend is UP for USD.

Trend is UP for gold stocks.

Trend is UP for gold.

A bottoming pattern in progress.

In recent years, gold stocks have a tendency to bottom in the summer/fall time frame.
So far so good.
Summary
Gold sector cycle is up.
Trend is now up for gold and gold stocks.
$$$ We are partially invested.
Read Full Story »»»
DiscoverGold
NY Gold Futures »» Weekly Summary Analysis
By: Marty Armstrong | October 28, 2023
This market made a new high today after the past 3 trading days. The market opened lower and closed higher. The immediate trading pattern in this market has exceeded the previous session's high intraday reaching 20197. Therefore, this market has rallied over the past 15 trading sessions and there is a potential to move up for another 2 daysNevertheless, this market remains well above all seven of our intial support levels. Meanwhile, this market's closing at this time has been the highest during this 15 day rally. This certainly warns that we can still see higher highs ahead from here. It will take a closing below 19864 to signal a decline is unfolding. Nonetheless, the market remains neutral on our system indicators yet the immediate indicator is positive right now.
ECONOMIC CONFIDENCE MODEL CORRELATION
Here in NY Gold Futures, we do find that this particular market has correlated with our Economic Confidence Model in the past. The Last turning point on the ECM cycle low to line up with this market was 2022 and 2015. The Last turning point on the ECM cycle high to line up with this market was 2020 and 2011 and 1996.
MARKET OVERVIEW
NEAR-TERM OUTLOOK
The historical perspective in the NY Gold Futures included a rally from 1999 moving into a major high for 2020, from which the market has been in a bearish trend since then moving into the low in 2022 forming a reactionary trend of 2 years bottoming at 16183. On the other hand, we have not elected any Yearly Bearish Reversal to date from the turning point of 2020, which tends to warn that the 2020 high could still be challenged until we elect a Yearly Bearish Reversal. Notwithstanding, 2022 was, in fact, an outside reversal to the downside closing lower than the previous year. On the other hand, we have elected all four intermediate Yearly Bullish Reversals to date from the turning point of 2022 from this 2022 reaction low.
Curiously, the market has been only consolidating since that 2022 low and has been unable to exceed the high of that year while holding the low. The last Yearly Reversal to be elected was a Bullish at the close of 2022.
This market remains in a positive position on the weekly to yearly levels of our indicating models. Nevertheless, it closed last year on the weak side down from 2021. Pay attention to the Monthly level for any serious change in long-term trend ahead.
From a perspective using the indicating ranges on the Daily level in the NY Gold Futures, this market remains moderately bullish currently with underlying support beginning at 19920 and overhead resistance forming above at 20092. The market is trading closer to the support level at this time.
On the weekly level, the last important high was established the week of October 23rd at 20197, which was up 3 weeks from the low made back during the week of October 2nd. So far, this week is trading within last week's range of 20197 to 19646. Nevertheless, the market is still trading upward more toward resistance than support. A closing beneath last week's low would be a technical signal for a correction to retest support.
When we look deeply into the underlying tone of this immediate market, we see it is cautiously starting to strengthen since the previous low at 18235 made 3 weeks. The broader perspective, this current rally into the week of October 23rd reaching 20197 has exceeded the previous high of 19689 made back during the week of September 18th.
Right now, the market is above momentum on our weekly models hinting this is still bullish for now as well as trend. Looking at this from a wider perspective, this market has been trading up for the past 3 weeks overall.
INTERMEDIATE-TERM OUTLOOK
YEARLY MOMENTUM MODEL INDICATOR
Our Momentum Models are declining at this time with the previous high made 2020 while the last low formed on 2022. However, this market has rallied in price with the last cyclical high formed on 2020 and thus we have a divergence warning that this market is starting to run out of strength on the upside.
After closing above last year's low of 16733 when it was an outside reversal to the downside yet it did close lower. This immediate year, the market did open higher, thus far, but this market has rallied exceeding last year's high. and remains below last year's high of 20788. This market is still above the normal trading yearly envelope where the top remains at 17906. The last Breakout Mode indicator took place in during 2003.
Looking at the longer-term monthly level, we did see that the market made a high in May at 20854. After a six month rally from the previous low of 19360, it made last high in May. Since this last high, the market has corrected for six months. However, this market has held important support last month. So far here in October, this market has fallen to a new low reaching 18235.
This market is trading beneath that high of May which was 20854 by more than 2 percent. Critical support still underlies this market at 18107 and a break of that level on a monthly closing basis would warn of a further decline ahead becomes possible. Nevertheless, at this time, the market is still weak trading beneath last month's low.
DiscoverGold Looking again, this super sized cup and handle should lead to 2680. which im sure miners can dig it.

If only miners would follow, my physical would be complemented with the breakout that should be occurring in metals.

Miners not going up in unison with gold. Actually way behind.
Gold Miners Junior (GDXJ) Should At least See 3 Waves Rally
By: EWFHendra | October 25, 2023
The VanEck Vectors Junior Gold Miners ETF (GDXJ) is an exchange-traded fund that provides exposure to the stocks of small to mid-sized companies involved in the exploration and production of gold and other precious metals. The ETF looks to have ended expanded flat correction and now it should see at least 3 waves rally if not a new bullish cycle. Below we will take a look at the Elliott Wave outlook for the ETF.
GDXJ Daily Elliott Wave View
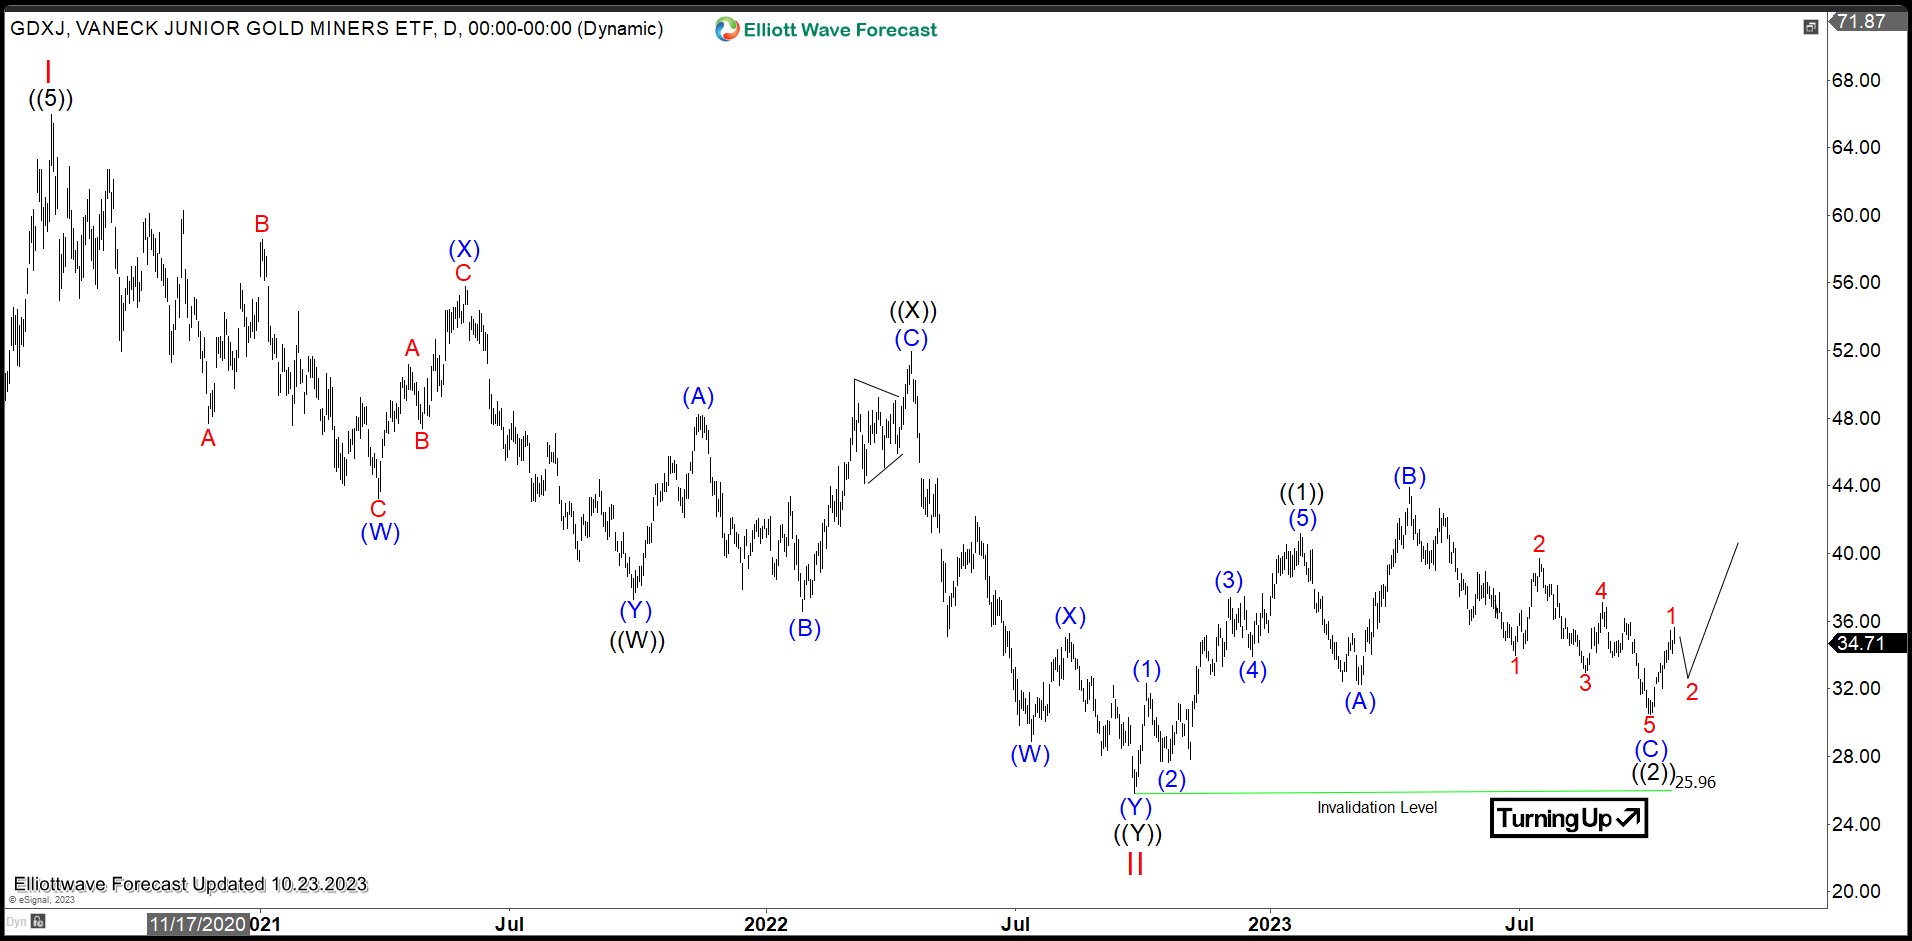
Daily Elliott Wave Chart of GDXJ above shows the ETF ended wave II at 25.96. Up from there, wave ((1)) ended at 41.16 and wave ((2)) ended at 30.46. The ETF has resumed higher in wave ((3)). As far as pivot at 25.96 low stays intact, expect the ETF to extend higher.
GDXJ 4 Hour Elliott Wave View
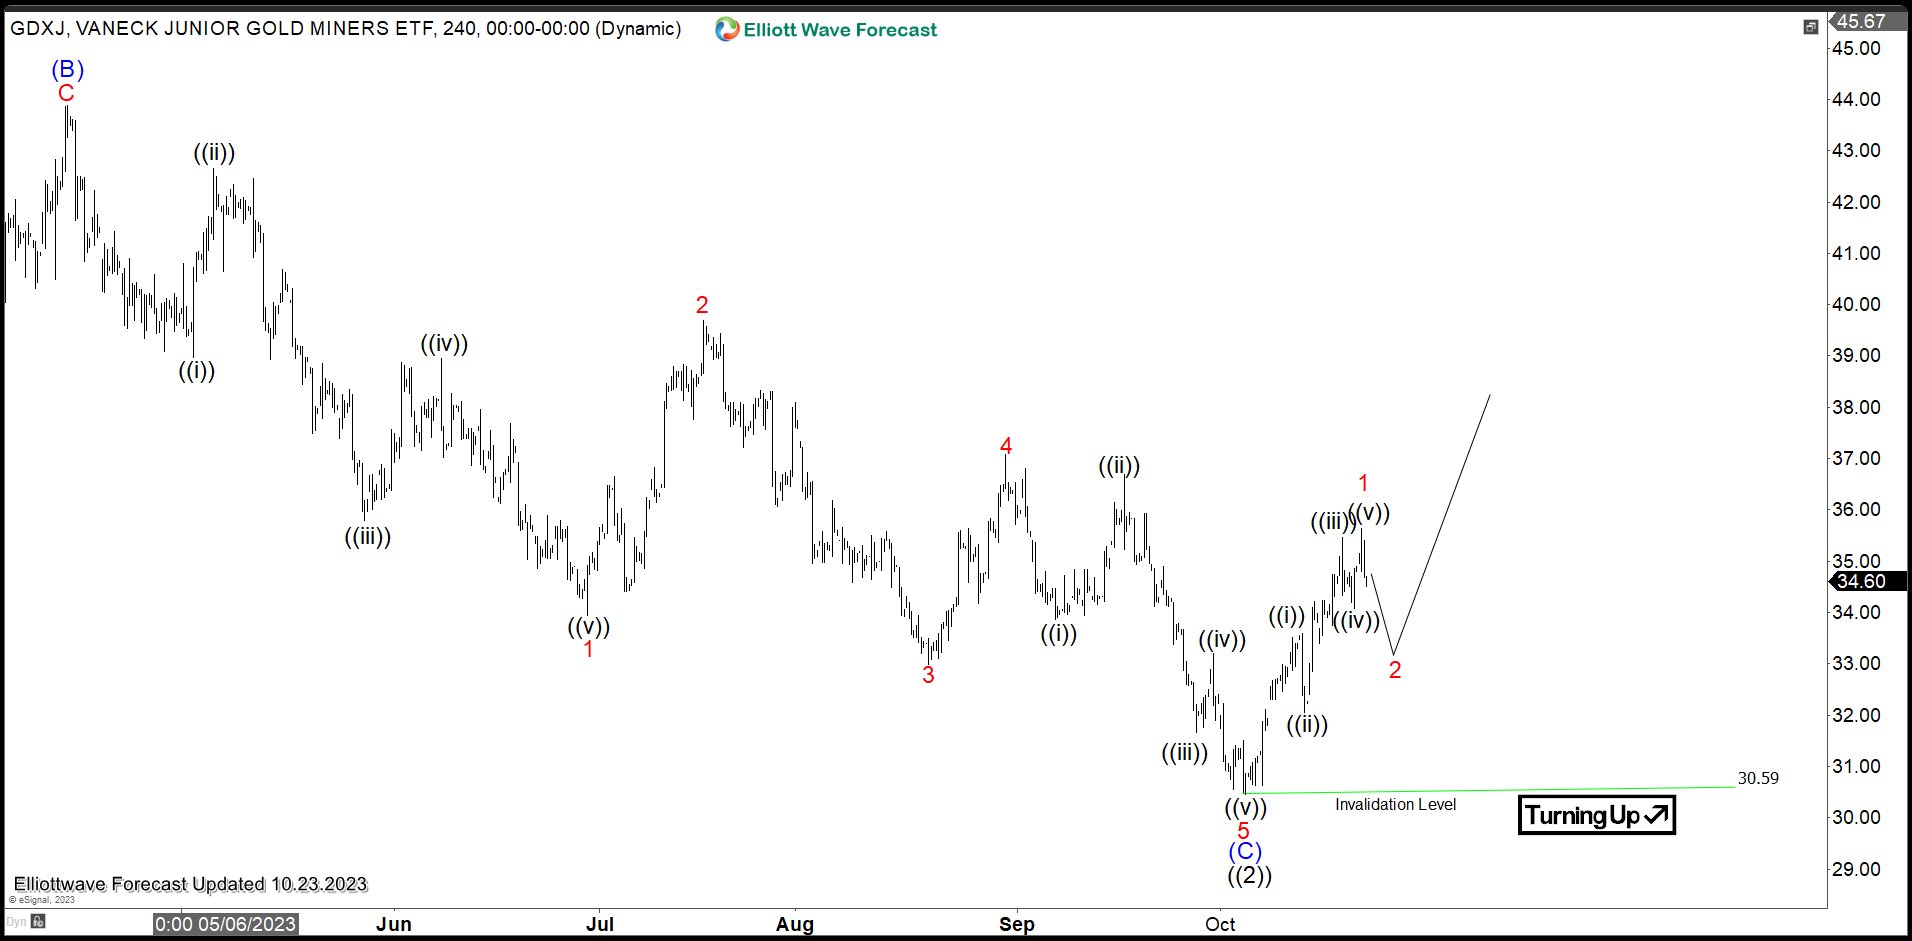
4 Hour Elliott Wave Chart of GDXJ above shows that the ETF ended wave ((2)) pullback at 30.59 as an expanded Flat structure. Up from there, wave 1 ended at 35.63. Pullback in wave 2 is in progress to correct cycle from 10.5.2023 low before the ETF resumes higher again. Near term, as far as pivot at 30.59 low stays intact, expect pullback to find support in 3, 7, or 11 swing for further upside.
Read Full Story »»»
DiscoverGold
The Fed has been doing that to the economy for years, yet they keep drinking the tainted brew. It’s gonna be huge.
https://www.foxbusiness.com/lifestyle/video-man-urinating-vat-tsingtao-beer-ingredients-prompts-investigation
The Ord Oracle: GDX Update
By: Tim Ord | October 24, 2023
SPX Monitoring purposes: Sold SPX Oct. 18, 2023, at 4314.60 gain 0.35%; Long SPX Sept. 28, 2023 at 4299.70. Gain since Dec 20, 2022 = 16.30%. Monitoring purposes GOLD: Long GDX on Oct. 9, 2020, at 40.78.

The top window in the above chart is the weekly GDX graph. The next lower window is the weekly cumulative GDX Up-Down Volume Percent, and the next lower window is the weekly cumulative GDX Advance-Decline Volume Percent. This chart goes back nearly two years. We added the Bollinger Bands to the bottom two indicators. Bullish and bearish signals are triggered for GDX when either or both indicators close above (bullish) or below (bearish) their mid-Bollinger bands. The red dotted lines on the chart above are when a bearish signal is triggered, and the dotted blue lines are when a bullish signal is triggered. Last week, both indicators closed above their mid-Bollinger bands, triggering a buy signal. The signal usually lasts two to six months.
Tim Ord,
Editor
Read Full Story »»»
DiscoverGold
Gold CoT: Peek Into Future Through Futures, How Hedge Funds Are Positioned
By: Hedgopia | October 21, 2023
• Following futures positions of non-commercials are as of October 17, 2023.
Gold: Currently net long 112.7k, up 41.3k.

After reaching a 49-week low last week, non-commercials’ net longs in gold futures rose by a decent amount this week. The metal has rallied strongly since ticking $1,824 on the 6th this month. On Friday, gold tagged $2,009, closing the session/week at $1,994/ounce.
On the back of geopolitical tensions in the Middle East, gold witnessed a couple of strong weeks – up 2.7 percent this week and 5.2 percent last week. With this, the yellow metal has broken out of a falling trendline from May 4th when it touched $2,085, before turning back lower. This is an important level, as this was the third time since August 2020 – the other being March last year – gold has failed at $2,080s. Gold bugs have another opportunity to go and hammer on this.
Read Full Story »»»
DiscoverGold
Jack Chan: Gold Price Exclusive Update
By: Jack Chan | October 21, 2023
Our proprietary cycle indicator is UP.
To public readers of our updates, our cycle indicator is one of the most effective timing tool for traders and investors. It is not perfect, because periodically the market can be more volatile and can result in short term whipsaws. But overall, the cycle indicator provides us with a clear direction how we should be speculating.
Investors
Accumulate positions during an up cycle and hold for the long term.
Traders
Enter the market at cycle bottoms and exit at cycle tops for short term profits.
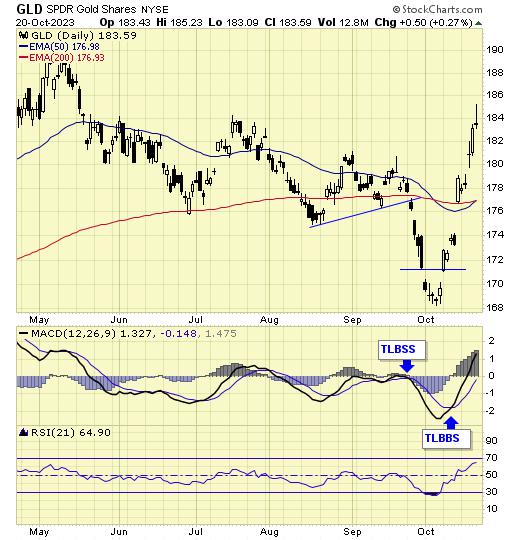
GLD is on short term buy signal.
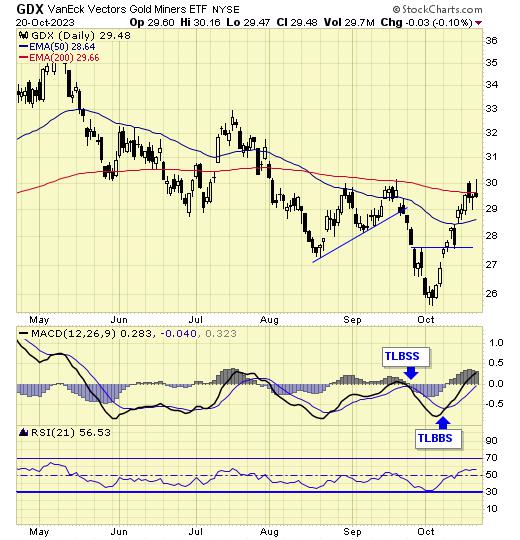
GDX is on short term buy signal.
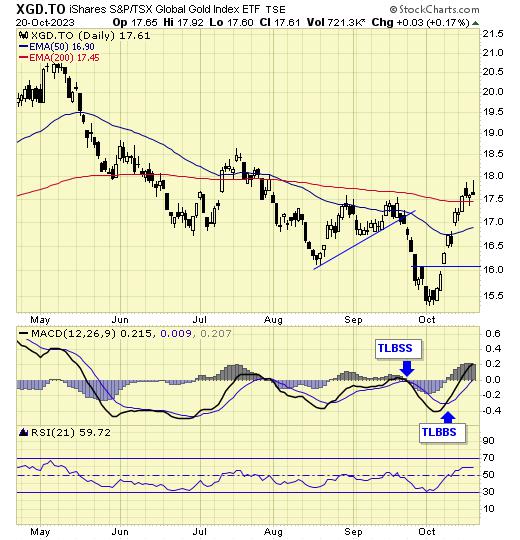
XGD.to is on short term buy signal.
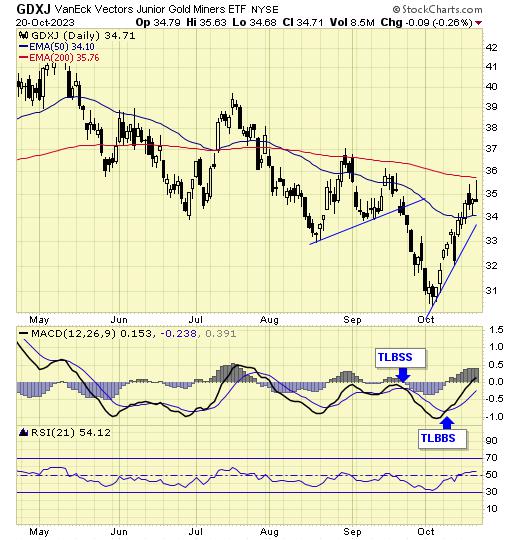
GDXJ is on short term buy signal.
Analysis
Expect higher gold prices overall.
Our ratio is on a buy signal.
Trend is UP for USD.
Trend is UP for gold stocks.
Trend is UP for gold.
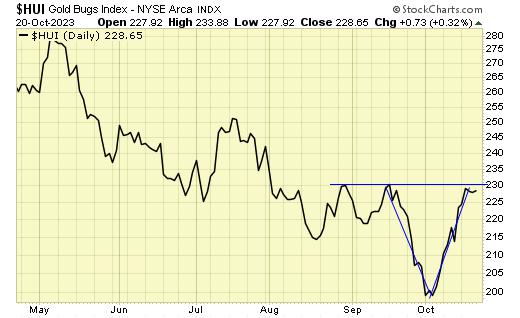
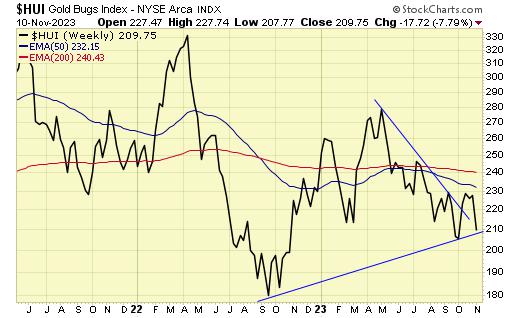
$HUI is at resistance with a V bottom.
In recent years, gold stocks have a tendency to bottom in the summer/fall time frame.
So far so good.
Summary
Gold sector cycle is up.
Trend is now up for gold and gold stocks.
$$$ We are partially invested.
Read Full Story »»»
DiscoverGold
Getting the oh so close, very close.
https://www.foxbusiness.com/economy/us-budget-gap-soars-1point7-trillion-largest-outside-covid-era
Gold Miners’ Fat Profits
By: Adam Hamilton | October 21, 2023
The major gold miners’ soon-to-be-reported Q3 profits are poised to skyrocket. Gold stocks’ imminent earnings season detailing last quarter has high potential to achieve record profits growth for this sector. Much-higher prevailing gold prices coupled with lower production costs should fuel a massive jump in miners’ profitability. Far-better fundamentals ought to greatly improve gold-stock sentiment, attracting traders.
Gold stocks are ultimately leveraged plays on gold, slaved to its fortunes. Speculators and investors alike only get interested in deploying capital in this high-potential sector when gold is rallying on balance. Although this immutable link is mostly psychological, it has strong fundamental underpinnings. Generally the higher gold prices, the fatter the profits gold miners earn. This dynamic is largely driven by mining costs.
While gold prices are volatile, unit mining costs are relatively stable. They usually don’t change much from quarter to quarter. Gold mines’ operating costs are largely fixed during pre-construction planning stages, when engineers design throughputs for plants processing gold-bearing ores. Their nameplate capacities rarely change, requiring similar levels of infrastructure, equipment, and employees to keep operating.
While mine expansions boosting output can really affect production costs, they’re fairly rare for individual gold mines. After long decades painstakingly analyzing this contrarian sector, I’d guess gold mines may average one expansion over their decade-or-so average lifespans. So for the most part excluding some smaller variable expenses, producing gold costs about the same regardless of where it happens to be trading.
We’ve amassed lots of hard data over the years proving this. For the past 29 quarters in a row, I’ve dug into the latest results from each of the top 25 GDX gold miners. These include the world’s largest, which utterly dominate this flagship sector ETF. After every earnings season, I feed the key quarterly results reported by all these elite miners into a giant spreadsheet. That important data illuminates fundamental trends.
The gold miners will publish their latest quarterly reports between late October to mid-November, detailing how they fared in Q3’23. I can’t wait to explore that new data, and will write another essay analyzing it soon after this earnings season ends. But many years of hard-won experience from digesting quarterlies and collating results has given me great insights in anticipating sector earnings before they are reported.
Quarterly-average gold prices less the GDX top 25’s average all-in sustaining costs are a fantastic proxy for sector unit profits. The former are no mystery, set in stone on each quarter’s final close. In Q3’23, gold averaged $1,926 on close. That soared a massive 11.6% higher from Q3’22’s depressed average of $1,727. Remember what was happening in markets during that brutal comparable quarter about a year ago.
With inflation raging out of control, panicking Fed officials were frantically hiking rates by epic amounts. That included four monster 75-basis-point federal-funds-rate hikes in a row in the middle of 2022! That extreme Fed hawkishness along with higher yields launched the benchmark US Dollar Index parabolic. It skyrocketed 16.7% in just 6.0 months into late September 2022, hitting an extreme 20.4-year secular high!
Gold price action is dominated by gold-futures speculators, who punch way above their weights in bullying around gold due to the extreme leverage inherent in its futures. These guys can’t afford to be wrong for long, or they face ruin. They closely watch the US dollar’s fortunes for their primary gold-futures-trading cues, doing the opposite. So gold prices collapsed a miserable 20.9% in 6.6 months into September 2022!
That huge gold selloff that narrowly and briefly edged into new-bear territory crushed Q3’22’s average price. Though an unsustainable anomaly that soon had to mean revert sharply higher as I wrote at the time, that makes for impressive Q3’23 comps. Gold’s subsequent rebound upleg blasted 26.3% higher into early May 2023! Gold has mostly consolidated higher since, greatly boosting last quarter’s average price.
The yellow metal hasn’t seen bigger year-over-year quarterly-average-price gains since Q1’21, fully ten quarters ago. And they merely boosted gold to a much-lower average of $1,793. This latest Q3’23’s $1,926 is actually the second highest on record, only behind Q2’23’s $1,978! No matter what happened to gold majors’ mining costs, these much-higher prevailing gold prices alone will really boost profitability.
The GDX top 25’s average all-in sustaining costs are way harder to divine leading into earnings season. But the gold miners themselves offer plenty of clues for those willing to dig. A year ago in Q3’22, the GDX top 25’s AISCs averaged a record-high $1,391 per ounce! The $1,727 average gold prices less those lofty AISCs yielded sector implied unit profits of $335 per ounce, the worst seen in at least 29 quarters!
That makes for a low comparable-quarter base from which last quarter’s gold-mining earnings can soar. In the latest-reported Q2’23, the GDX top 25’s AISCs weren’t much better way up at $1,380 per ounce. But like usual that was skewed high by a couple serious outliers from usual-suspect very-high-cost miners. Without them, the rest of these gold majors averaged $1,299 AISCs. Those should come in lower in Q3’23.
These companies themselves generally predicted lower AISCs in 2023’s second half, mostly driven by higher production. Gold-mining unit costs tend to be inversely proportional to gold-output levels. The richer the ores fed into fixed-capacity mills, the more ounces recovered to spread mining’s big fixed costs across. Better ore grades forecast in Q3 mining plans, along with some mine expansions, should boost production.
A great example of this came from mighty Newmont, the world’s largest gold miner and GDX’s biggest component. Thanks to gold production collapsing 17.1% YoY in Q2’23, NEM’s AISCs that quarter soared 22.8% YoY to an ugly $1,472 per ounce! That was the worst Newmont ever reported by far, dragging up the entire GDX top 25’s average. And this super-major wasn’t even one of those two very-high-cost outliers.
Yet Newmont’s Q2’23 quarterly report explaining all this still predicted far-better H2’23 results. Although its AISCs were way too high at $1,376 and $1,472 in H1’23’s two quarters, NEM still affirmed it was “On track to achieve full-year guidance ... with Gold AISC between $1,150 and $1,250 per ounce”. Since those averaged $1,424 in H1’23, pulling down full-year-2023’s to even $1,250 requires far-lower H2’23 costs.
We are talking NEM having to average just $1,075 per ounce through Q3 and Q4! That seems like a tall order, as this colossal gold miner hasn’t reported lower AISCs since Q4’21. But even if this company has to raise this year’s AISC guidance range, costs are still likely to be considerably lower. Plenty of other major gold miners joined Newmont in forecasting lower H2’23 AISCs right in their latest-reported Q2’23 results.
We could do similar math for all the GDX top 25 reaffirming full-year cost guidances. But conservatively their average AISCs ought to retreat at least 5% YoY from Q3’22’s record high. That yields a $1,322 target, or just $1,177 if that handful of serious outliers are excluded. It wouldn’t surprise me if the entire GDX top 25’s average warts and all comes in around $1,250 in Q3, which would be a six-quarter low.
But even if we use that conservative $1,322 AISC target, the gold miners are soon going to report fat profits last quarter. Q3’23’s high $1,926 prevailing gold prices less $1,322 AISCs yields implied unit profits of $604 per ounce. That would skyrocket a whopping 80.3% YoY above Q3’22’s depressed $335! That would prove the strongest major-gold-miner earnings growth seen in at least the last 29 quarters.
The previous record in this long research thread was a 66.2% YoY jump in Q2’20 to $730 per ounce. If my more-optimistic $1,250 average AISCs is correct, Q3’23’s GDX-top-25 average unit profits will more than double rocketing 101.7% YoY to $676! No matter how this upcoming Q3 earnings season plays out, the major gold miners are going to report massive earnings growth to fat profits. Key investors will take notice.
Individual investors mostly ape herd sentiment, crowding into gold stocks to chase their upside when they are already surging with gold. But professional investors, particularly fund managers controlling large amounts of capital, do endless research to temper their own greed and fear. If interested in this sector, they do the necessary analytical work on gold miners’ quarterlies to understand their fundamental trends.
I’ve heard from plenty of professional investors over the years on my quarterly gold-stock-fundamentals essays. Some can’t believe I’m freely sharing this valuable analytical work to help sell newsletters. If the GDX top 25’s average unit earnings merely best Q2’23’s $598 per ounce, that will make for the fourth consecutive quarter of improving profits. That should help attract in bigger-than-usual professional buying.
That won’t just come in the leading ETFs like GDX, but individual gold stocks. If Newmont or any other gold miner reports Q3’23 results way better than either expectations, the prior Q2’23, or the year-ago Q3’22, institutional investors should flock into those gold stocks. Their likely-sharp gains will amplify GDX’s upside, hastening the herd shift back to bullish psychology which will greatly increase buying.
Gold stocks have been battered technically in recent months, as this chart shows. That sure slammed sentiment, leaving this small contrarian sector really out of favor. If you need to get up to speed on why gold and gold stocks were pounded lower, my last couple weeks’ essays analyzed each causal chain in depth. But as I predicted, both the metal and its miners’ stocks have quickly recovered from their parallel breakdowns.

Gold was slammed by heavy gold-futures short selling to a violent breakdown into early October, as the USDX surged again on hawkish jawboning from top Fed officials. But that left speculators’ gold-futures positioning excessively-bearish, their capital firepower available for selling exhausted. That guaranteed big proportional mean-reversion buying was imminent, portending a sharp gold bounce back into its uptrend...
* * *
Read Full Story »»»
DiscoverGold
NY Gold Futures »» Weekly Summary Analysis
By: Marty Armstrong | October 21, 2023
NY Gold Futures closed today at 19944 and is trading up about 9.21% for the year from last year's settlement of 18262. Presently, this market has been declining for 5 months. This price action here in October is suggesting that this has been a bear market trend on the monthly level. As we stand right now, this market has made an outside reversal exceeding the previous month's high reaching thus far 20092 and it has broken last month's low falling to 18235 while it is still trading above last month's high of 19802.
ECONOMIC CONFIDENCE MODEL CORRELATION
Here in NY Gold Futures, we do find that this particular market has correlated with our Economic Confidence Model in the past. The Last turning point on the ECM cycle low to line up with this market was 2022 and 2015. The Last turning point on the ECM cycle high to line up with this market was 2020 and 2011 and 1996.
MARKET OVERVIEW
NEAR-TERM OUTLOOK
The historical perspective in the NY Gold Futures included a rally from 1999 moving into a major high for 2020, from which the market has been in a bearish trend since then moving into the low in 2022 forming a reactionary trend of 2 years bottoming at 16183. Distinctly, we have not elected any Yearly Bearish Reversal to date from the turning point of 2020, which tends to warn that the 2020 high could still be challenged until we elect a Yearly Bearish Reversal. Notwithstanding, 2022 was, in fact, an outside reversal to the downside closing lower than the previous year. Distinctly, we have elected all four intermediate Yearly Bullish Reversals to date from the turning point of 2022 from this 2022 reaction low.
Curiously, the market has been only consolidating since that 2022 low and has been unable to exceed the high of that year while holding the low. The last Yearly Reversal to be elected was a Bullish at the close of 2022.
This market remains in a positive position on the weekly to yearly levels of our indicating models. Nevertheless, it closed last year on the weak side down from 2021. Pay attention to the Monthly level for any serious change in long-term trend ahead.
The perspective using the indicating ranges on the Daily level in the NY Gold Futures, this market remains in a bullish position at this time with the underlying support beginning at 19462.
On the weekly level, the last important high was established the week of October 16th at 20092, which was up 2 weeks from the low made back during the week of October 2nd. So far, this week is trading within last week's range of 20092 to 19212. Nevertheless, the market is still trading upward more toward resistance than support. A closing beneath last week's low would be a technical signal for a correction to retest support.
When we look deeply into the underlying tone of this immediate market, we see it is currently still in a weak posture. The broader perspective, this current rally into the week of October 16th reaching 20092 has exceeded the previous high of 19689 made back during the week of September 18th.
Right now, the market is above momentum on our weekly models hinting this is still bullish for now as well as trend, long-term trend. Looking at this from a wider perspective, this market has been trading up for the past 2 weeks overall.
INTERMEDIATE-TERM OUTLOOK
YEARLY MOMENTUM MODEL INDICATOR
Our Momentum Models are declining at this time with the previous high made 2020 while the last low formed on 2022. However, this market has rallied in price with the last cyclical high formed on 2020 and thus we have a divergence warning that this market is starting to run out of strength on the upside.
After closing above last year's low of 16733 when it was an outside reversal to the downside yet it did close lower. This immediate year, the market did open higher, thus far, but this market has rallied exceeding last year's high. and remains below last year's high of 20788. This market is still above the normal trading yearly envelope where the top remains at 17906. The last Breakout Mode indicator took place in during 2003.
This market is trading beneath that high of May which was 20854 by more than 2 percent. Critical support still underlies this market at 18107 and a break of that level on a monthly closing basis would warn of a further decline ahead becomes possible. Nevertheless, at this time, the market is still weak trading beneath last month's low.
DiscoverGold Gold Miners Golden and Silver Cross Indexes:
By: Carl Swenlin | October 20, 2023
GOLD MINERS Golden and Silver Cross Indexes: Gold Miners were down slightly today and it did siphon off a few stocks above their 20-day EMA. However, readings are well above our bullish 50% thresholds and we saw a new LT BULLISH Bias trigger as the GCI moved above its signal line. The rally in Gold is helping. Look for GDX to break out next week.

Read Full Story »»»
DiscoverGold
The Ord Oracle: GDX Update
By: Tim Ord | October 18, 2023
SPX Monitoring purposes: Long SPX 9/28/23 at 4299.70.
Gain since 12/20/22: 15.93%.
Monitoring purposes GOLD: Long GDX on 10/9/20 at 40.78.

The bottom panel in the above chart is the weekly GDX cumulative Advance/Decline Percent Indicator. The panel above it is the weekly GDX cumulative Up Down Volume Percent. The weekly indicators look at the bigger picture and the signals can last two to six months. A signal is triggered when one or both indicators close above its mid-Bollinger band. The blue circles identify when either indicator crossed above its mid-Bollinger band. At the moment, we have both. These indicators are good at catching trends that last two to six months. The previous signal came in April around the 34.00 range on a sell and now has turned bullish near the 29.00 range.
Tim Ord,
Editor
Read Full Story »»»
DiscoverGold
GDX #Miners - May need that Right Shoulder for a B/Tap of the B/Line & Lime/MA...
By: Sahara | October 18, 2023
• $GDX #Miners - May need that Right Shoulder for a B/Tap of the B/Line & Lime/MA...

Read Full Story »»»
DiscoverGold
When GDX goes down while spot gold goes up, sometimes it’s leads golds forecast price movements.
Spot hit 1950. I’m pretty sure it must retrace, we see.
Spot gold gotta consolidate before it stays any higher than 1920s.
GDX #Miners - A lot were ejected and are now wondering when to buy back...
By: Sahara | October 17, 2023
• $GDX #Miners - A lot were ejected and are now wondering when to buy back...

Read Full Story »»»
DiscoverGold
Gold Forecast: Gold Bottoms Right Into 'Kill' Zone
By: Jim Curry | October 16, 2023
With the action seen into last week, Gold has turned sharply back to the upside - with the metal having been anticipated to form a low into the 'kill zone' turn, which was identified in our Gold Wave Trader report as the October 9th date, plus or minus.
Stepping back, there is now the potential for a mid-term bottom also in place with the metal, though this would need to be confirmed.
With the above, we need a quick recap of the action seen over the past month.
From my 9/17/23 article for Gold-Eagle: "the rally with the 20-day cycle is expected to be a countertrend affair, holding below the 2029.20 swing top, seen back in July. From a late-September peak, the ideal path would be looking for another decline into October, where our larger 72-day wave is projected to trough. In terms of price, a drop below the 1913.60 swing bottom would be ideal as our 72-day wave next bottoms, a move which would be the technical setup for our next mid-term low for Gold."
Back in mid-September, I mentioned that the upward phase of our 20-day cycle was in progress, though with the ideal path looking for a countertrend rally with that wave - one that held below the July peak; this did end up as the case.
From there, a drop back below the 1913.50 swing bottom was favored to play out into our 'kill zone' date of October 9th, which was easily seen with the following action - with the metal spiking down to a low of 1823.50, bottoming on October 6th - within one trading day of our turn date.
Near-Term Picture for Gold
For the short-term view, as noted above, the last low for our 20-day wave was the October 6th bottom of 1823.50 (December, 2023 contract) for Gold - which was later confirmed by the subsequent reversal back above the 1849.40 figure, a number noted in advance in our Gold Wave Trader report.
Here again is that 20-day cycle, updated to the current action:
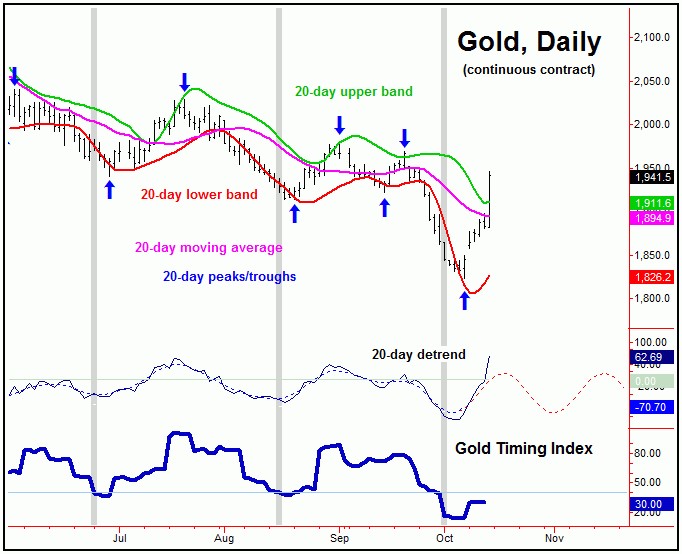
In terms of time, our 20-day cycle is some 5 trading days along on its current upward phase, and thus is moving back into the early-end of its topping range - though this seems likely to come from higher numbers than already seen.
Adding to the notes above, of keen interest is that our Gold Timing Index (lowest pane, in dark blue) has yet to see a sharp spike higher with the recent rally - which is viewed as a net positive, as it suggests the market has some room to run before the next 20-day top attempts to form.
Of additional note is that our Gold Timing Index recently dropped below the 40 figure just prior to our October 9th turn date. In our market report, we noted that prior drops below the 40 level occurred just prior to key bottoms in the Gold market, with the most recent one being no different.
With the above said and noted, our upside 'reversal point', as mentioned earlier, was set at the 1849.40 figure for Gold, and - since taken out - has given way to nearly 100 points of additional rally through the same.
For the very short-term, there is also a smaller 10-day wave for Gold, which is shown on our next chart:
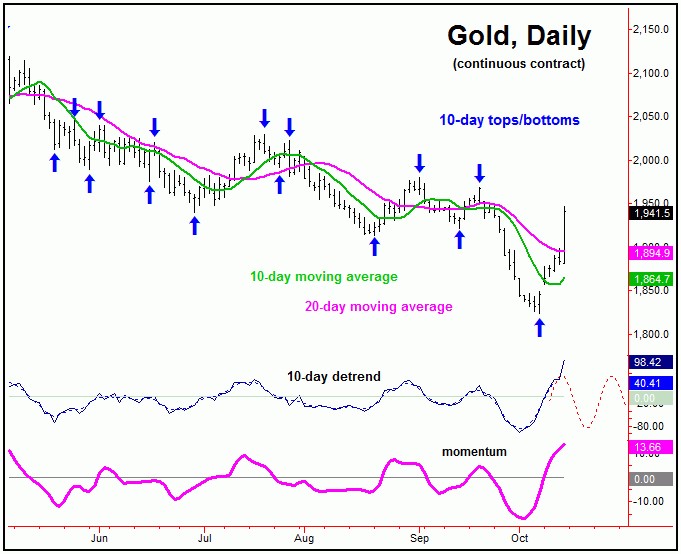
Our smaller 10-day wave is also 5 trading days along, and with that is looking for a smaller-degree peak in the next day or three. Once this wave does top, a quick drop back to the 10-day moving average would be a normal-enough affair. In terms of patterns, that decline would now seem favored to end up as countertrend.
Gold's Mid-Term View
With the above said and noted, do we have a mid-term low in place for Gold? There is now the potential for this to be correct, simply due to the configuration of our larger 72 and 310-day cycles - with the smaller 72-day wave shown below:
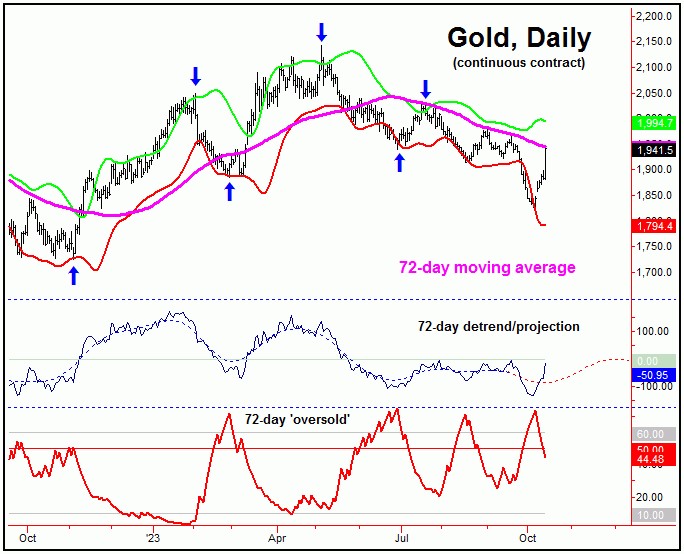
As mentioned back in September, our 72-day cycle was pointed south into October, which favored lower lows into that timeframe - which we have obviously seen. In looking at the action from our detrend, the suggestion is that the 1823.50 swing low is likely to end up as our trough for this wave.
Even with the sharp spike higher into Friday's session, an upturn in our 72-day component would still need to be confirmed by additional price action, by taking out our current upside 'reversal point' for this wave - with the exact number identified in our thrice-weekly Gold Wave Trader report.
Taking out our reversal point to the upside is now key, as the average rallies with our 72-day wave - when coming off the pattern of a ‘lower-low’ (which it had to have recently formed) have been approximately 15.7% from trough-to-peak. In other words, if the 1823.50 low was the bottom for our 72-day component, there would be the potential for a push up to the 2109 figure in the coming weeks/months.
Having said the above, there would actually be an even greater potential for further strength than noted, due to the position of our next larger wave, the 310-day cycle:
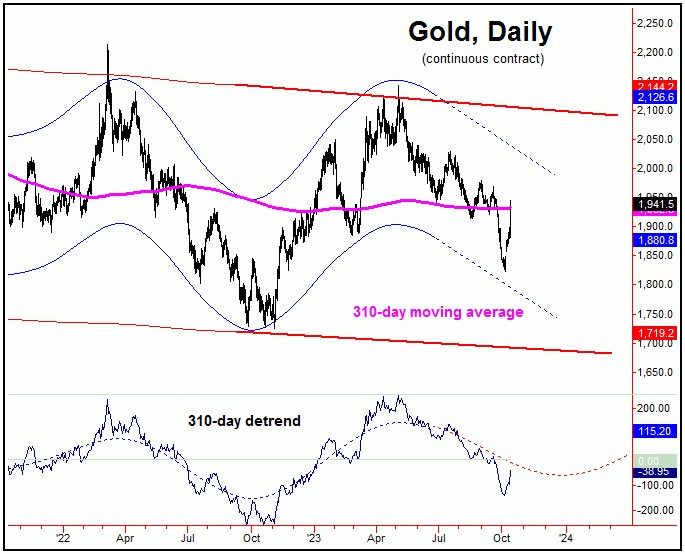
From my 9/17/23 article: "The last bottom for our 310-day cycle was seen back in November of 2022, forecast well in advance in our Gold Wave Trader market report. The downward phase of this 310-day wave is currently deemed to be in force, and with that is pushing south into the Autumn of this year. This low is not to be missed, as what follows should be another rally of some 20-25% or more in the Gold market, playing out into next year."
As far back as June of this year, we were able to confirm a turn south with our 310-day cycle, with that wave having been projected to bottom around the Autumn of this year. What followed was a correction of nearly 15% off the top for the metal, which is a normal percentage decline with this wave.
As mentioned earlier, there is the potential for a mid-term bottom in place for Gold, though it needs confirmation. Having said that, should the 1823.50 figure end up as this low, then there would be at least the potential for a push up to the 2279 figure into the Summer next year.
The above is due to the fact that the average upward phases with this 310-day cycle have seen Gold rising some 20-25% off the bottom. Whether we will see that higher range here is more speculation, though - with an economic recession appearing to be in the cards - this would seem very supportive of mid-term strength for the metal.
The Bottom Line
The overall bottom line with the above is that Gold troughed right into our 'kill zone' turn, and with that there is the potential for a larger-degree low to have formed. However, that action needs additional confirmation, by taking out a key price reversal level, with precise details noted in our Gold Wave Trader market report.
Read Full Story »»»
DiscoverGold
$BPGDM $GDX #Miners - Update: Eyeballing the GDX:GLD Ratio (Bottom Pane)...
By: Sahara | October 16, 2023
• $BPGDM $GDX #Miners - Update.
Eyeballing the GDX:GLD Ratio (Bottom Pane)...

Read Full Story »»»
DiscoverGold
GDX #Miners - Made it to the 2Hr Purple. Needs to take it out...
By: Sahara | October 16, 2023
• $GDX #Miners - Made it to the 2Hr Purple
Needs to take it out...

Read Full Story »»»
DiscoverGold
Jack Chan: Gold Price Exclusive Update
By: Jack Chan | October 14, 2023

Our proprietary cycle indicator is UP.
To public readers of our updates, our cycle indicator is one of the most effective timing tool for traders and investors. It is not perfect, because periodically the market can be more volatile and can result in short term whipsaws. But overall, the cycle indicator provides us with a clear direction how we should be speculating.
Investors
Accumulate positions during an up cycle and hold for the long term.
Traders
Enter the market at cycle bottoms and exit at cycle tops for short term profits.

GLD is on short term buy signal.

GDX is on short term buy signal.

XGD.to is on short term buy signal.

GDXJ is on short term buy signal.
Analysis

Expect higher gold prices overall.

Our ratio is on a buy signal.

Trend is UP for USD.

Trend is UP for gold stocks.

Trend is UP for gold.

Daily trend has also turned up.

In recent years, gold stocks have a tendency to bottom in the summer/fall time frame.
So far so good.
Summary
Gold sector cycle is up.
Trend is now up for gold and gold stocks.
$$$ We are cost averaging in.
Read Full Story »»»
DiscoverGold
Gold: Managed money is back to a largish net short position in Gold. The only other times they bet like this, gold:
By: Jason Goepfert | October 14, 2023
• Managed money is back to a largish net short position in gold.
The only other times they bet like this, gold:
Rallied 30%
Rallied 32%
Rallied 26%

Read Full Story »»»
DiscoverGold
NY Gold Futures »» Weekly Summary Analysis
By: Marty Armstrong | October 14, 2023
NY Gold Futures closed today at 19415 and is trading up about 6.31% for the year from last year's settlement of 18262. At present, this market has been declining for 5 months. This price action here in October is suggesting that this has been a bear market trend on the monthly level. As we stand right now, this market has made a new low breaking under the previous month's low dropping to 18235 intraday yet it remains trading back above that previous low of 18661 implying near-term strength.
ECONOMIC CONFIDENCE MODEL CORRELATION
Here in NY Gold Futures, we do find that this particular market has correlated with our Economic Confidence Model in the past. The Last turning point on the ECM cycle low to line up with this market was 2022 and 2015. The Last turning point on the ECM cycle high to line up with this market was 2020 and 2011 and 1996.
MARKET OVERVIEW
NEAR-TERM OUTLOOK
The historical perspective in the NY Gold Futures included a rally from 1999 moving into a major high for 2020, from which the market has been in a bearish trend since then moving into the low in 2022 forming a reactionary trend of 2 years bottoming at 16183. Even so, we have not elected any Yearly Bearish Reversal to date from the turning point of 2020, which tends to warn that the 2020 high could still be challenged until we elect a Yearly Bearish Reversal. Notwithstanding, 2022 was, in fact, an outside reversal to the downside closing lower than the previous year. Even so, we have elected all four intermediate Yearly Bullish Reversals to date from the turning point of 2022 from this 2022 reaction low.
Curiously, the market has been only consolidating since that 2022 low and has been unable to exceed the high of that year while holding the low. The last Yearly Reversal to be elected was a Bullish at the close of 2022.
This market remains in a positive position on the weekly to yearly levels of our indicating models. Nevertheless, it closed last year on the weak side down from 2021. Pay attention to the Monthly level for any serious change in long-term trend ahead.
Looking at the indicating ranges on the Daily level in the NY Gold Futures, this market remains moderately bullish currently with underlying support beginning at 19403 and overhead resistance forming above at 19479. The market is trading closer to the support level at this time. An opening below this level in the next session will imply a decline is unfolding.
On the weekly level, the last important low was established the week of October 2nd at 18235, which was down 22 weeks from the high made back during the week of May 1st. We have been generally trading up for the past week from the low of the week of October 2nd, which has been a move of 6.728%. When we look deeply into the underlying tone of this immediate market, we see it is currently still in a weak posture.
INTERMEDIATE-TERM OUTLOOK
YEARLY MOMENTUM MODEL INDICATOR
Our Momentum Models are declining at this time with the previous high made 2020 while the last low formed on 2022. However, this market has rallied in price with the last cyclical high formed on 2020 and thus we have a divergence warning that this market is starting to run out of strength on the upside.
After closing above last year's low of 16733 when it was an outside reversal to the downside yet it did close lower. This immediate year, the market did open higher, thus far, but this market has rallied exceeding last year's high. and remains below last year's high of 20788. This market is still above the normal trading yearly envelope where the top remains at 17906. The last Breakout Mode indicator took place in during 2003.
This market is trading below that high of May which was 20854 by more than 5 percent. Critical support still underlies this market at 18107 and a break of that level on a monthly closing basis would warn of a further decline ahead becomes possible. Nevertheless, at this time, the market is still weak trading beneath last month's low.
DiscoverGold it wanted to stay in 1800s, there is a huge gap in price, shorts will try and take it down, or its a breakaway gap and will never look back. it can go either way, Next few weeks tell everything about gold direction and acceleration, why, October is usually a negative month for gold, but....and its a big but, the October dip already happened where gold hit lows not seen since last March. My take, it waaaay over corrected, so its a good chance that is a breakaway gap.
The Gaza War: Gold Bull Candlesticks
By: Morris Hubbartt | October 13, 2023
Here are today's videos and charts. The videos are viewable on mobile phones as well as computers. Double-click to enlarge the charts.
SGS Key Charts, Signals, & Video Analysis
Super Force Signals (SFS) is being rebranded as Super Gold Signals (SGS at https://supergoldsignals.com), to reflect the growing global importance of gold.


The dollar looks ready for a major meltdown and gold (and silver!) could go ballistic if the Israel-Gaza war goes out of control. At my SGS flagship newsletter, our focus is doing big picture trades on our winning core positions in gold, silver, commodities, and some Dow stocks too. At $229 a year the value is outstanding, and I have a special offer this week of just $199 for a full 14 months! Shoot me an email or click this link if you want the offer. Thanks!
SG60 Key Charts, Signals, & Video Analysis
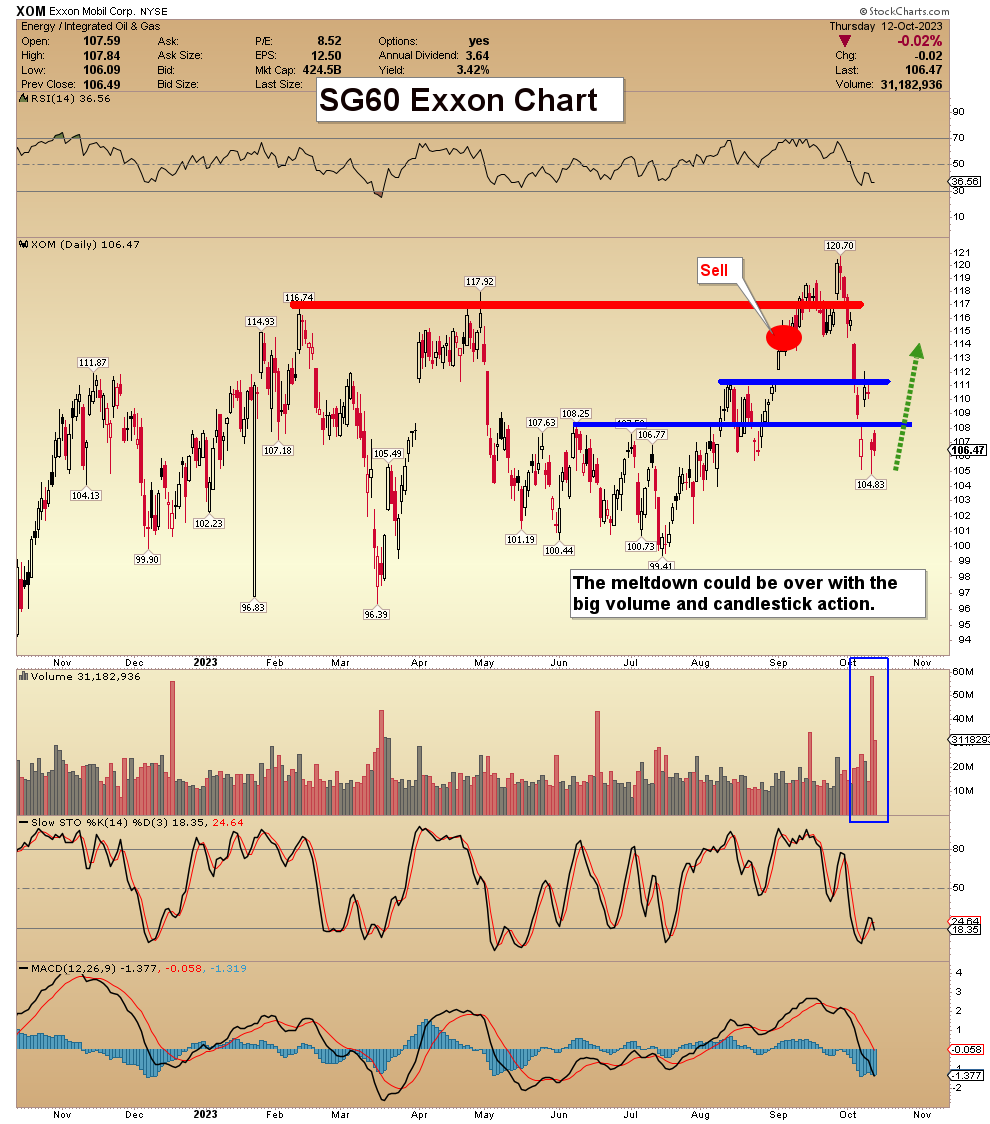

SGT Key Charts, Signals, & Video Analysis

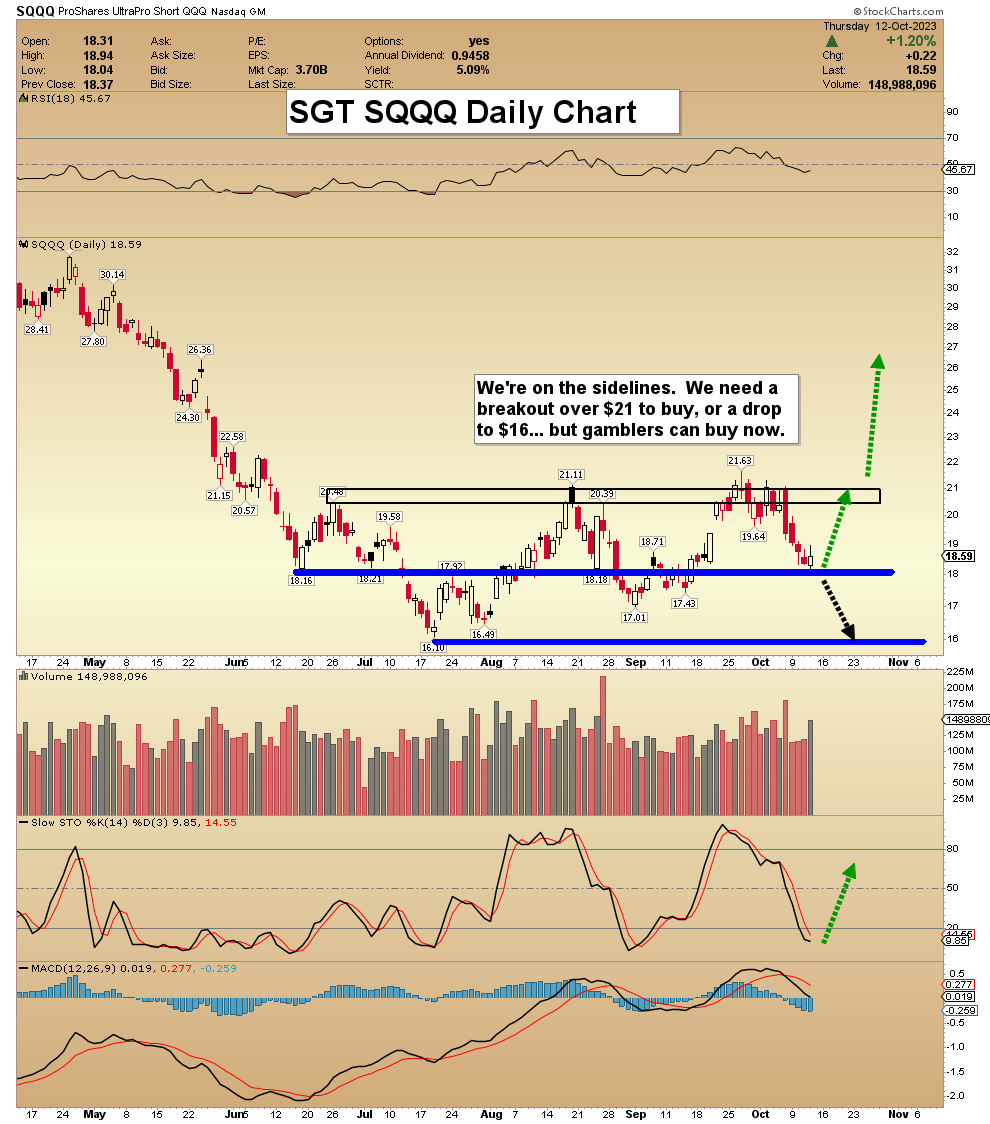
SGJ Key Charts, Signals, & Video Analysis

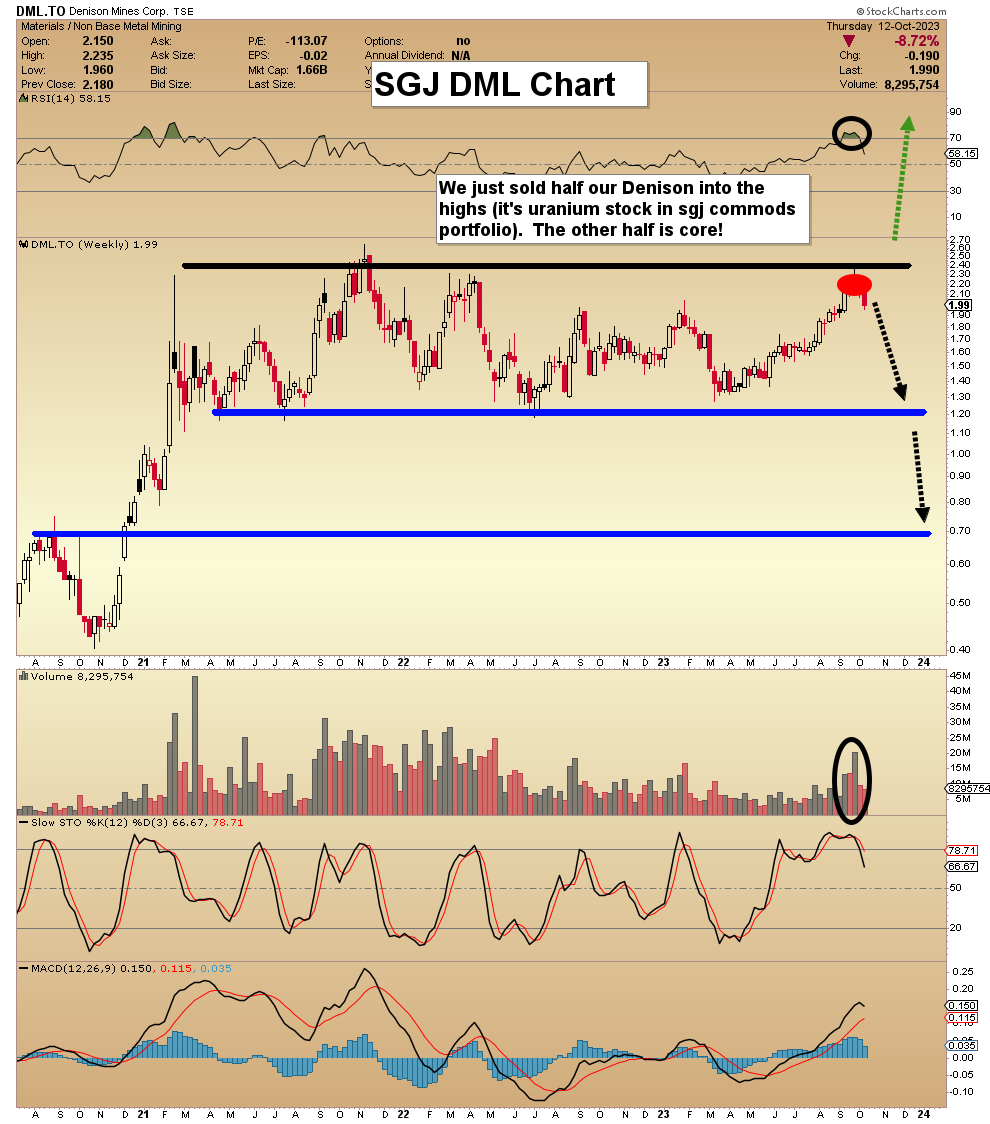
Read Full Story »»»
DiscoverGold
Gold Stocks Clawing Back 2
By: Adam Hamilton | October 13, 2023
The battered gold miners’ stocks are clawing back from their recent unusual breakdown. That was fueled by heavy gold-futures short selling slamming gold in the wake of the latest FOMC meeting. Speculators’ resulting excessive shorts had to soon be covered, and that tragic terrorist invasion in Israel proved the igniting catalyst. Both gold and GDX are rebounding sharply, poised to soon regain their interrupted uptrends.
My essay last week analyzed gold’s violent breakdown in depth. In a nutshell, top Fed officials slashed their forecast for 2024 rate cuts in half from 100 basis points to 50bp. Despite these dot-plot projections being notoriously inaccurate, traders viewed that shift as very hawkish. So afterwards they flooded into the US dollar as Treasury yields soared, which unleashed withering gold-futures shorting hammering gold lower.
Gold was looking solid technically before that late-September FOMC meeting, still in its strong upleg’s uptrend and still above its 200-day moving average. But over the next nine trading days following those shifting year-end-2024 dots, gold plunged 5.5% on a parallel 1.5% US Dollar Index surge! Both of gold’s key support zones were shattered, and its festering pullback was stretched into a formal correction exceeding 10%.
With gold’s powerful 26.3% upleg that nearly carried it to new nominal record highs slain, the gold stocks weren’t going to take that well. Gold miners’ profits are highly leveraged to prevailing gold prices, so gold-stock prices amplify whatever their underlying metal is doing. During that nine-trading-day post-FOMC span, the leading GDX gold-stock ETF collapsed 12.3%. That made for 2.2x downside leverage to gold.
GDX is dominated by the largest major gold miners, and their stocks tend to amplify material gold moves by 2x to 3x. So this small contrarian sector’s latest plunge was actually on the light side relative to gold. But that recent drop sure had an outsized psychological impact, with bearishness soaring as a months-old selloff deepened. Gold’s pullback had started from $2,050 in early May, and GDX’s from $35.85 in mid-April.
With gold stocks seriously of favor today, traders have forgotten their last upleg. That powered up a nice 63.9% over 6.5 months, leveraging gold’s underlying one by 2.4x. Before the last several weeks and that hawkish-2024-dots scare, GDX remained in this upleg’s uptrend despite selling off with gold since early May. This chart superimposes GDX and some of its key technicals over gold during the last several years.

Gold stocks’ unusual breakdown in recent weeks is striking, knifing well below uptrend support. That extended GDX’s total selloff since its latest upleg peak to 27.7% over 5.7 months. While steep, that was normal leveraging gold’s roughly-parallel pullback-then-correction by 2.5x. But gold’s sharp drop wasn’t sustainable, as I explained in last week’s essay written right at gold’s lows. My contrarian conclusion then was...
“The bottom line is gold just suffered a violent technical breakdown, trashing sentiment. But gold’s latest plunge was driven by massive gold-futures selling, leaving speculators’ positioning exceedingly-bearish. These super-leveraged traders have probably about exhausted their capital firepower available for selling. Their shorts in particular are likely challenging major secular highs, which are never sustainable for long.”
“That guarantees huge mean-reversion short-covering buying is imminent, which will catapult gold sharply higher. As specs rush to cover or face financial ruin, the much-larger long-side specs will pile on to chase gold’s upside momentum. The sparking catalyst for all this will be some Fed-dovish data shifting traders’ federal-funds-rate expectations, which could come any day. Battered gold stocks will soar as gold recovers.”
* * *
Read Full Story »»»
DiscoverGold
GDX - Was expecting some retrenchment for a Right Shoulder at least. But seems happy to ride my bullish Arrow...
By: Sahara | October 10, 2023
• $GDX #Miners - Was expecting some retrenchment for a Right Shoulder at least.
But seems happy to ride my bullish Arrow...

Read Full Story »»»
DiscoverGold
GDX #Miners - Turn came in on cue. Now needs to prove it doesn't need to visit that 62/Fib...
By: Sahara | October 9, 2023
• $GDX #Miners - Turn came in on cue...

Read Full Story »»»
DiscoverGold
|
Followers
|
150
|
Posters
|
|
|
Posts (Today)
|
1
|
Posts (Total)
|
5585
|
|
Created
|
06/29/08
|
Type
|
Free
|
| Moderators DiscoverGold trunkmonk | |||

http://www.vaneck.com/index.cfm?cat=3192&tkr=GDX&LN=3-02
The Gold Miners ETF seeks to replicate as closely as possible, before fees and expenses, the price and yield performance of the NYSE Arca Gold Miners Index. The Index provides exposure to publicly traded companies worldwide involved primarily in the mining for gold, representing a diversified blend of small-, mid- and large-capitalization stocks. As such, the Fund is subject to the risks of investing in this sector.
| ||||||||||||||||||||||||||||||||||||||||||||||||||||||||||||||||||||||||||||||||||||||||||||||||||||||
| DAILY |
| WEEKLY |
| Volume | |
| Day Range: | |
| Bid Price | |
| Ask Price | |
| Last Trade Time: |


