 News
News  Market Data
  Discover
Support: 888-992-3836
Copyright © 2023 InvestorsHub Inc.


Register for free to join our community of investors and share your ideas. You will also get access to streaming quotes, interactive charts, trades, portfolio, live options flow and more tools.
GDX near major support with extreme oversold condition adds to the bullish setup
By: Tim Ord | May 18, 2022
• 18 MA of up down volume and Advance/Decline both hit near -50; lowest reading going back to 2010. 83% chance a worthwhile low is forming here on $GDX, GDX also near major support with extreme oversold condition adds to the bullish setup.

Read Full Story »»»
 DiscoverGold
Gold & Market Update: Stocks Aiming Lower as Gold Shows Signs of Bottoming
By: AG Thorson | May 18, 2022
Gold prices have plunged nearly $300 since peaking in March. The chart is building a bullish hup-with-handle pattern supporting a breakout above $2000 later this year.
Metals and miners could drop further over continued weakness in broader markets. Overall, I believe this dip will be viewed as an excellent long-term buying opportunity.
The next big rally in precious metals will come when the Fed pivots. That could happen soon if we see widespread fuel shortages and price controls, as I expect.
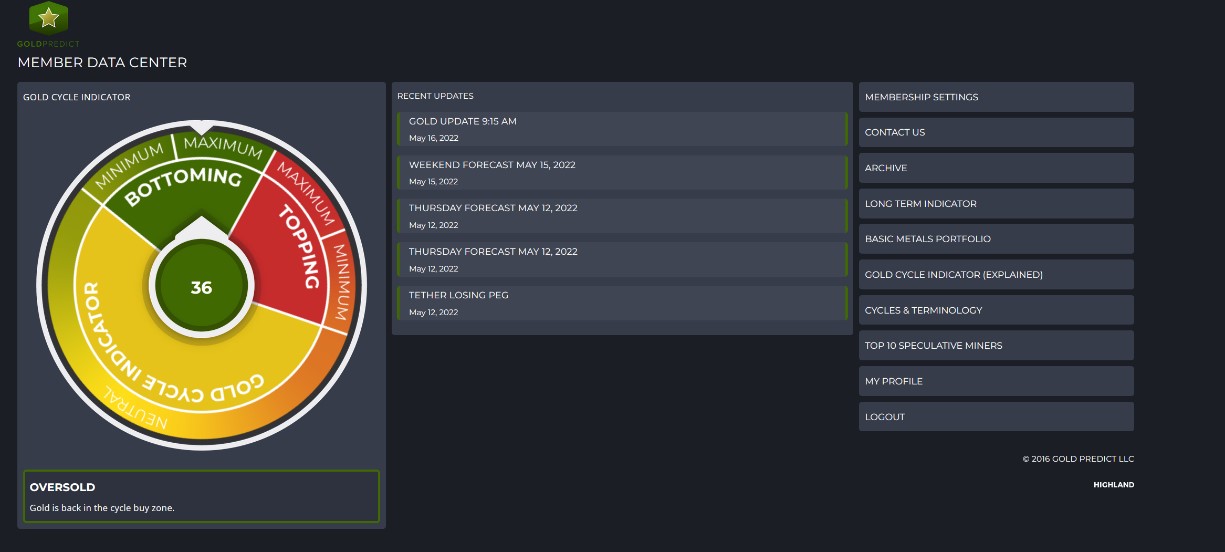
Our Gold Cycle Indicator is at 36 and within maximum cycle bottoming.
Gold Prices
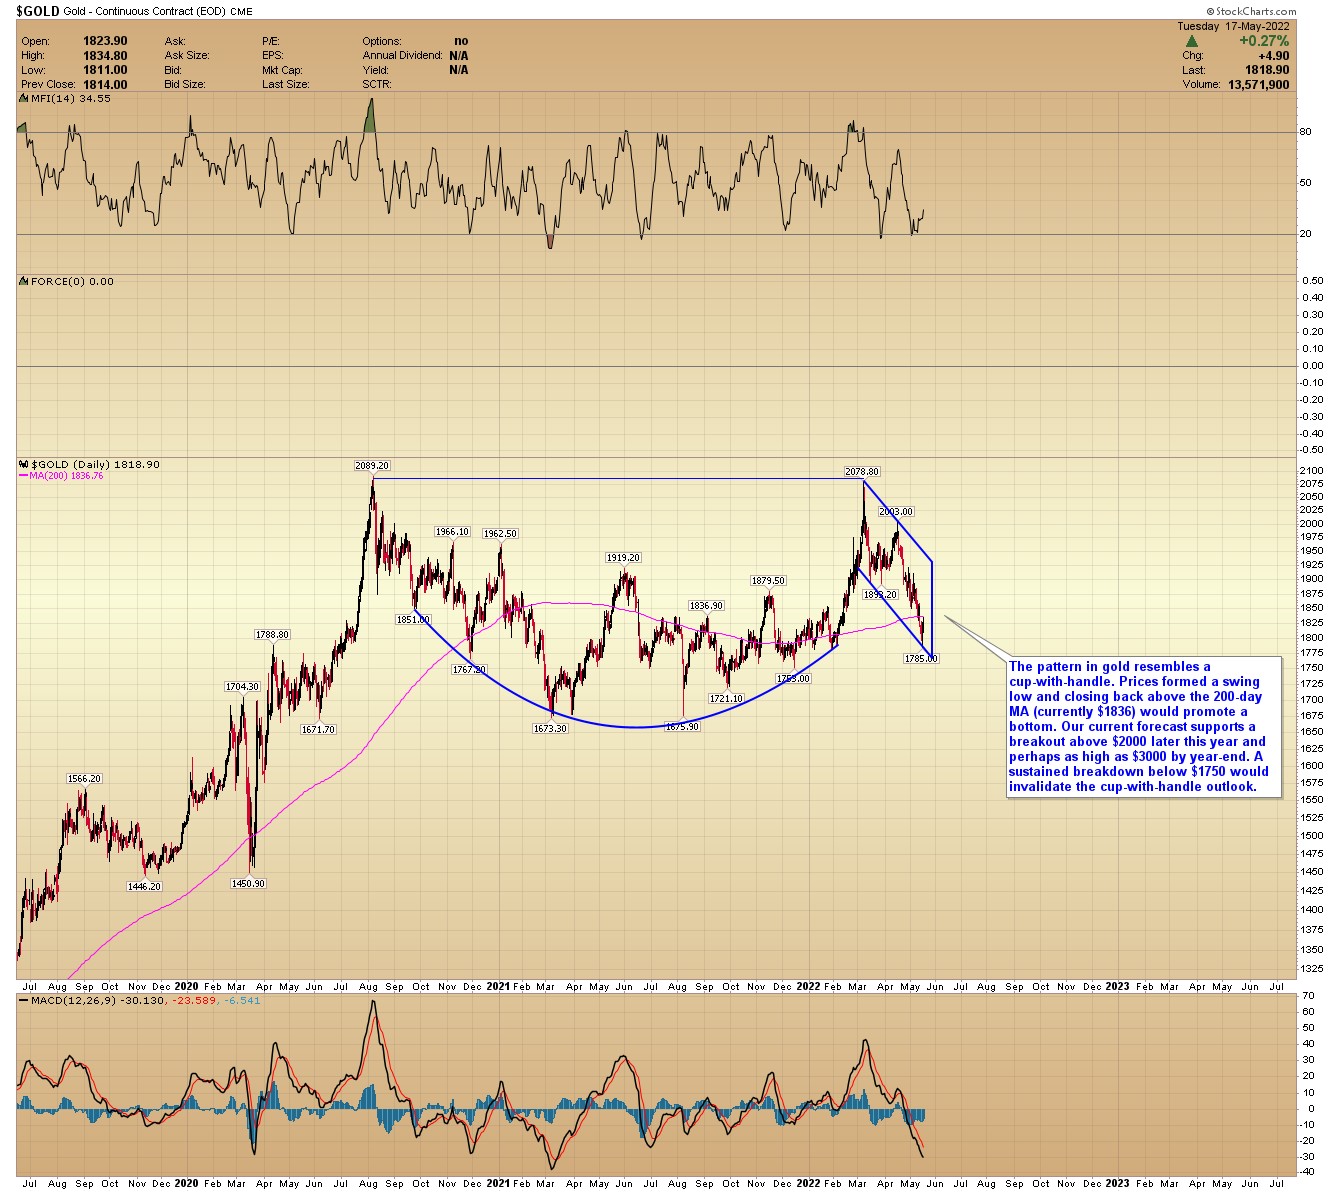
The pattern in gold resembles a cup-with-handle. Prices formed a swing low and closing back above the 200-day MA (currently $1836) would promote a bottom. Our current forecast supports a breakout above $2000 later this year and perhaps as high as $3000 by year-end. A sustained breakdown below $1750 would invalidate the cup-with-handle outlook.
GDX
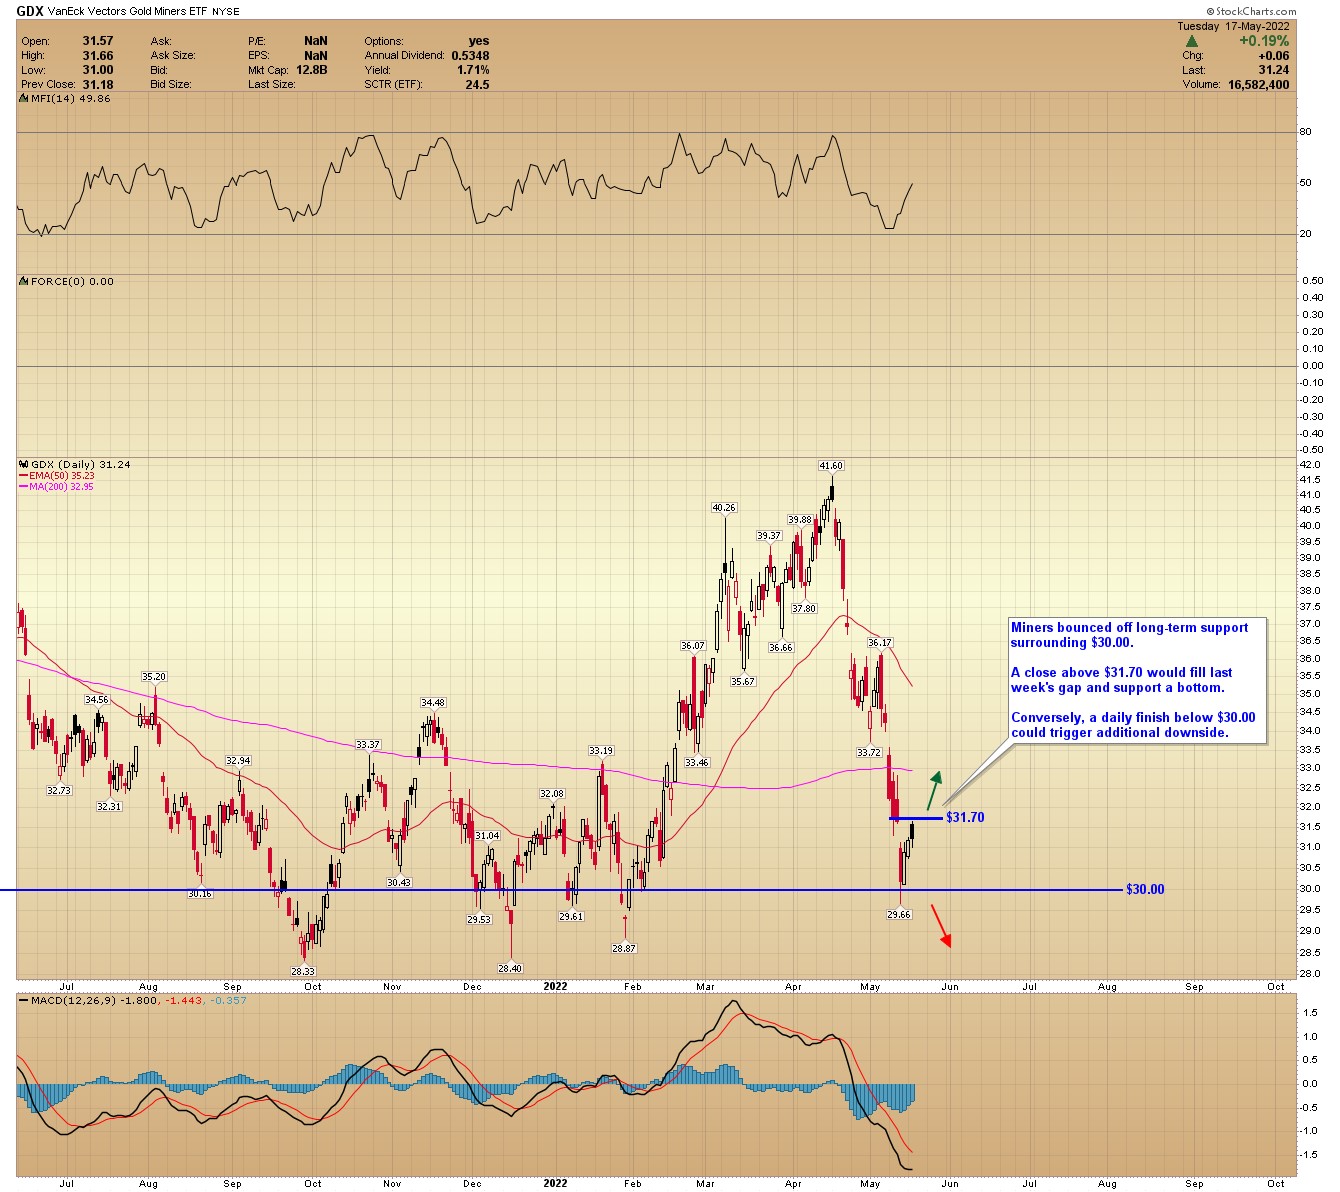
Miners bounced off long-term support surrounding $30.00. A close above $31.70 would fill last week's gap and support a bottom. Conversely, a daily finish below $30.00 could trigger additional downside.
GDXJ
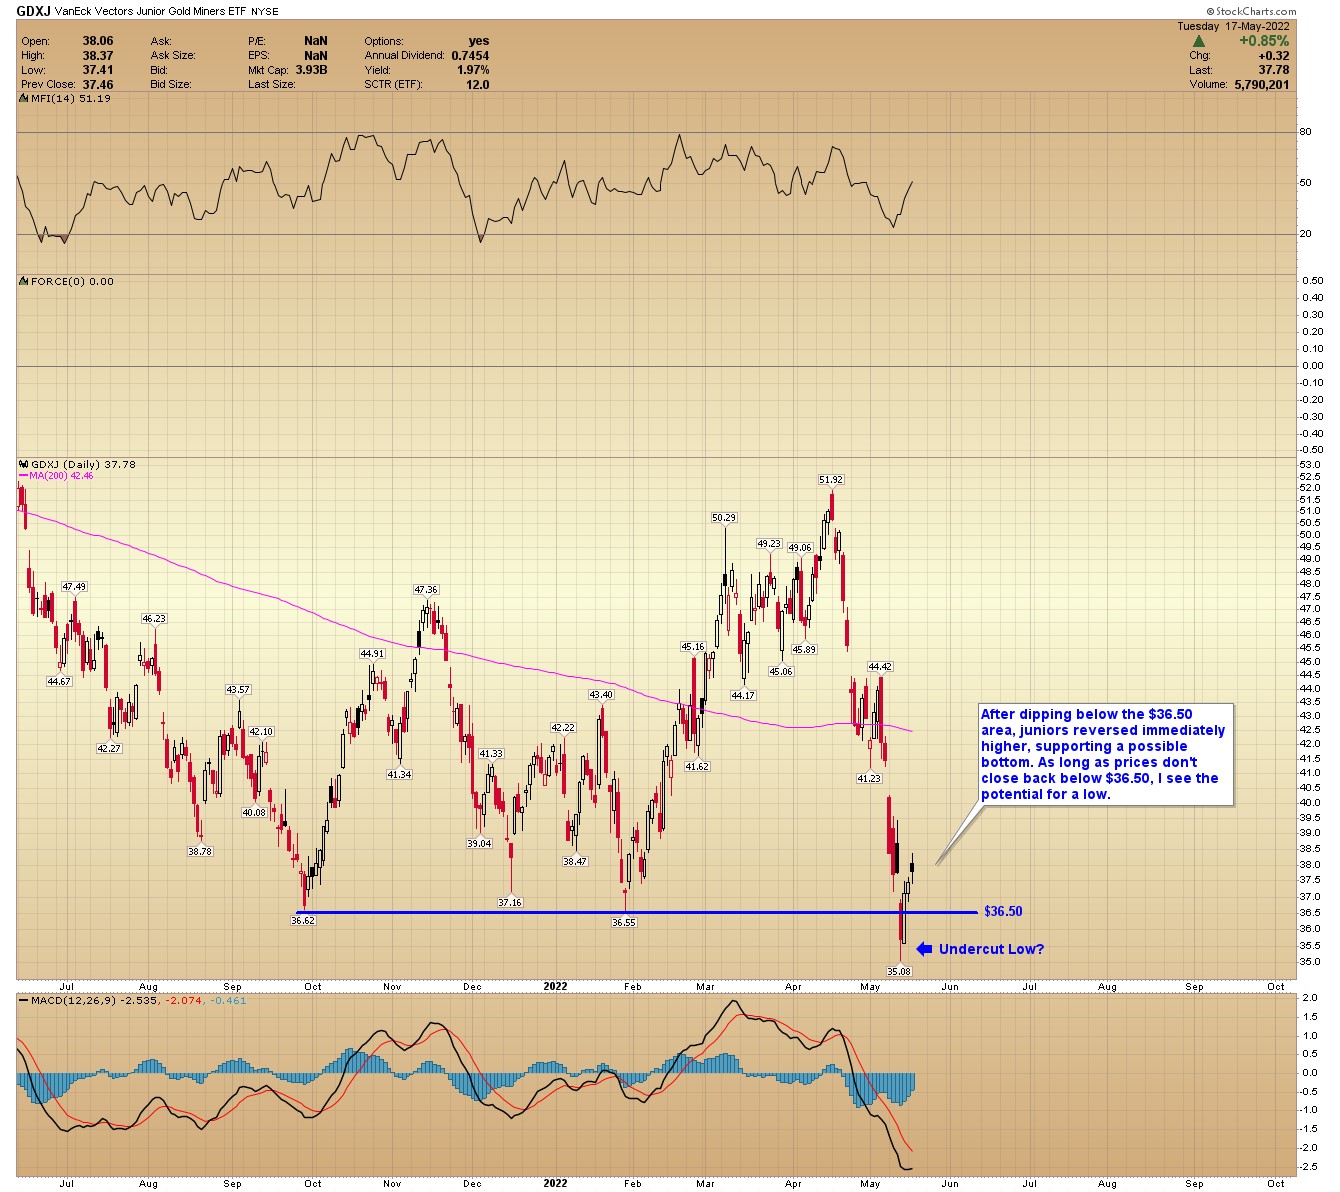
After dipping below the $36.50 area, junior miners reversed immediately higher, supporting a possible bottom. As long as prices don't close back below $36.50, I see the potential for a cycle low.
DOW
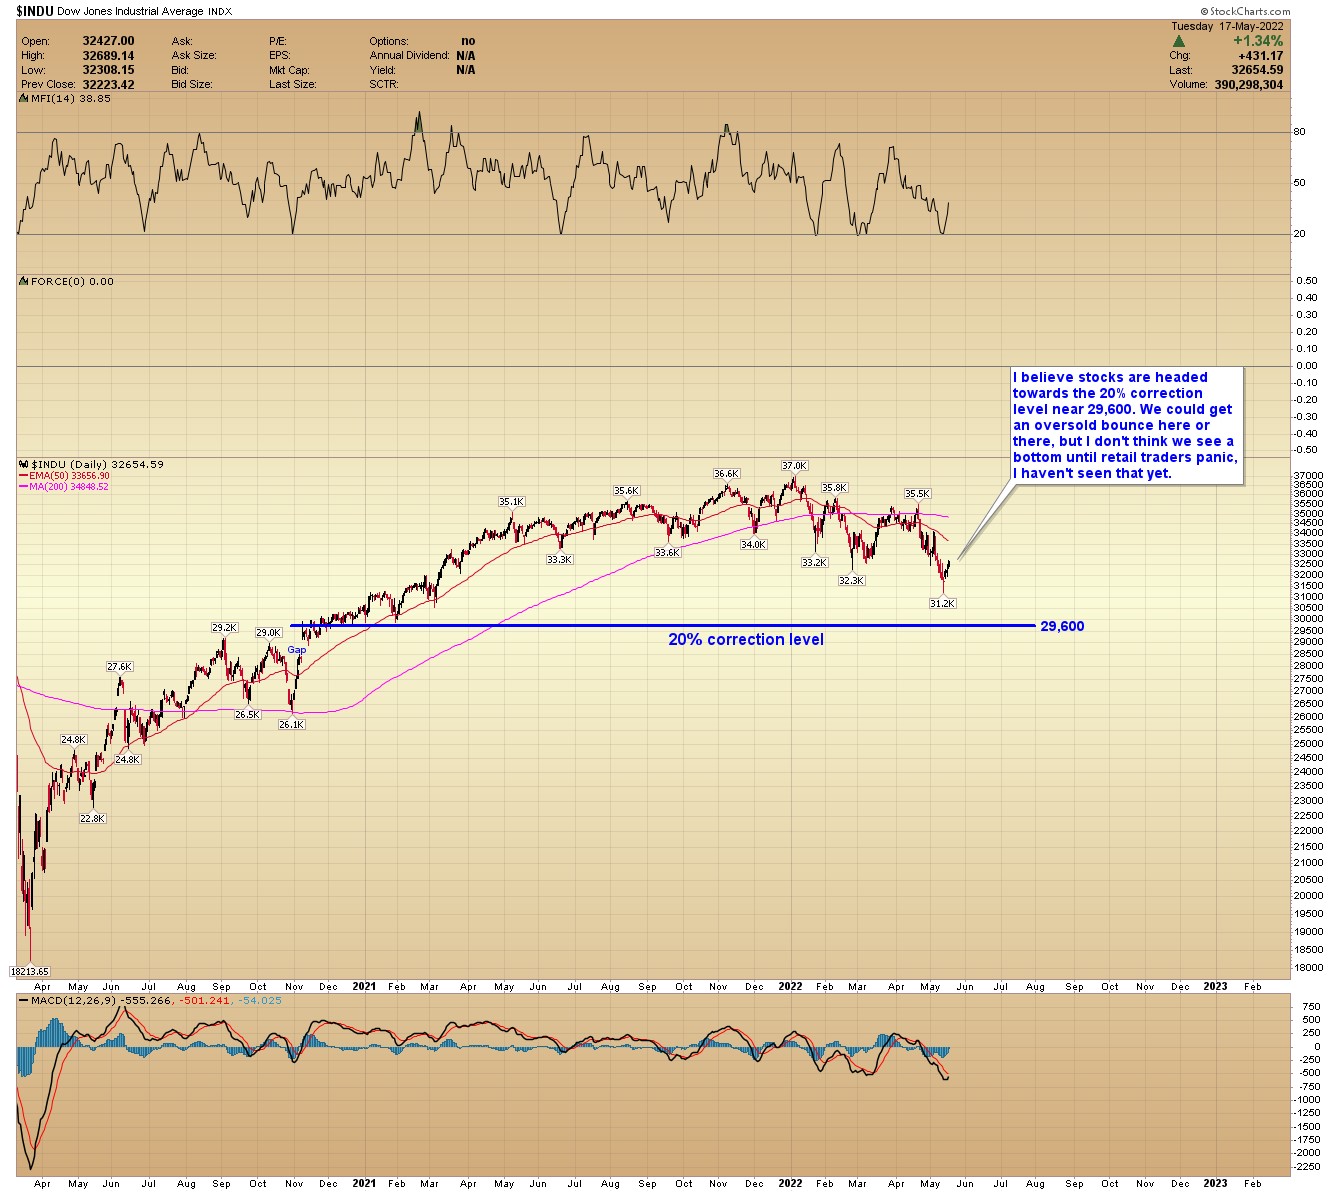
I believe stocks are headed towards the 20% correction level near 29,600. We could get an oversold bounce here or there, but I don't think we see a bottom until retail trader’s panic; I haven't seen that yet.
TSLA
I think we need to see panic and a breakdown in Tesla before markets bottom. As I understand it, Musk has $88-billion in margin debt against his Telsa shares. The Twitter deal may add another $13-billion. That is a lot of debt tied to an extremely volatile and overpriced stock.
If Tesla shares crash like I've been calling for, Musk could see significant financial stress. For his sake, I hope I'm wrong. A price decline below $550 could trigger panic.
Takeaways:
• The general stock market is bouncing, but I won't expect a bottom until retail traders capitulate...watch Tesla.
• A liquidity event is possible, resulting in a flash crash. I'm keeping an eye on cryptocurrencies; they could fail first.
• It's probably a good time to hold cash in anticipation of buying opportunities if prices drop further.
Read Full Story »»»
DiscoverGold
With the blink of an eye it’s back from 1815 with heavy volume, to 1810. A few bot trades with toilet paper futures, voilà.
I’d say by end of June bots will fry their circuits
No matter how much buy volume there is, spot gold gets boxed in around 1812. Gonna be a vicious day.
It’s popping up now, with a lot of buying, but will be back to1812, watch.
Gold stuck in the teens. Dollar fell hard so most likely the hammering of gold was attempt to offset drop. Didn’t work for dollar but gold sure looks bruised.
Every nice clean takeoff attempt to get about 1820 gets taken out at the knees. How do I know, gold then sputters around for a bit after.
Gold Forecast: While The Dollar Rests, Is It Time For Gold To Rise And Shine?
By: P. Radomski | May 17, 2022
Practically everything that I wrote yesterday either happened in tune with that or it remains up-to-date, so today’s technical part will be rather brief.
In short, gold reversed yesterday’s decline after almost touching its previous 2022 lows, and at the same time, it practically erased the entire war-tension-based rally – just like it was supposed to.
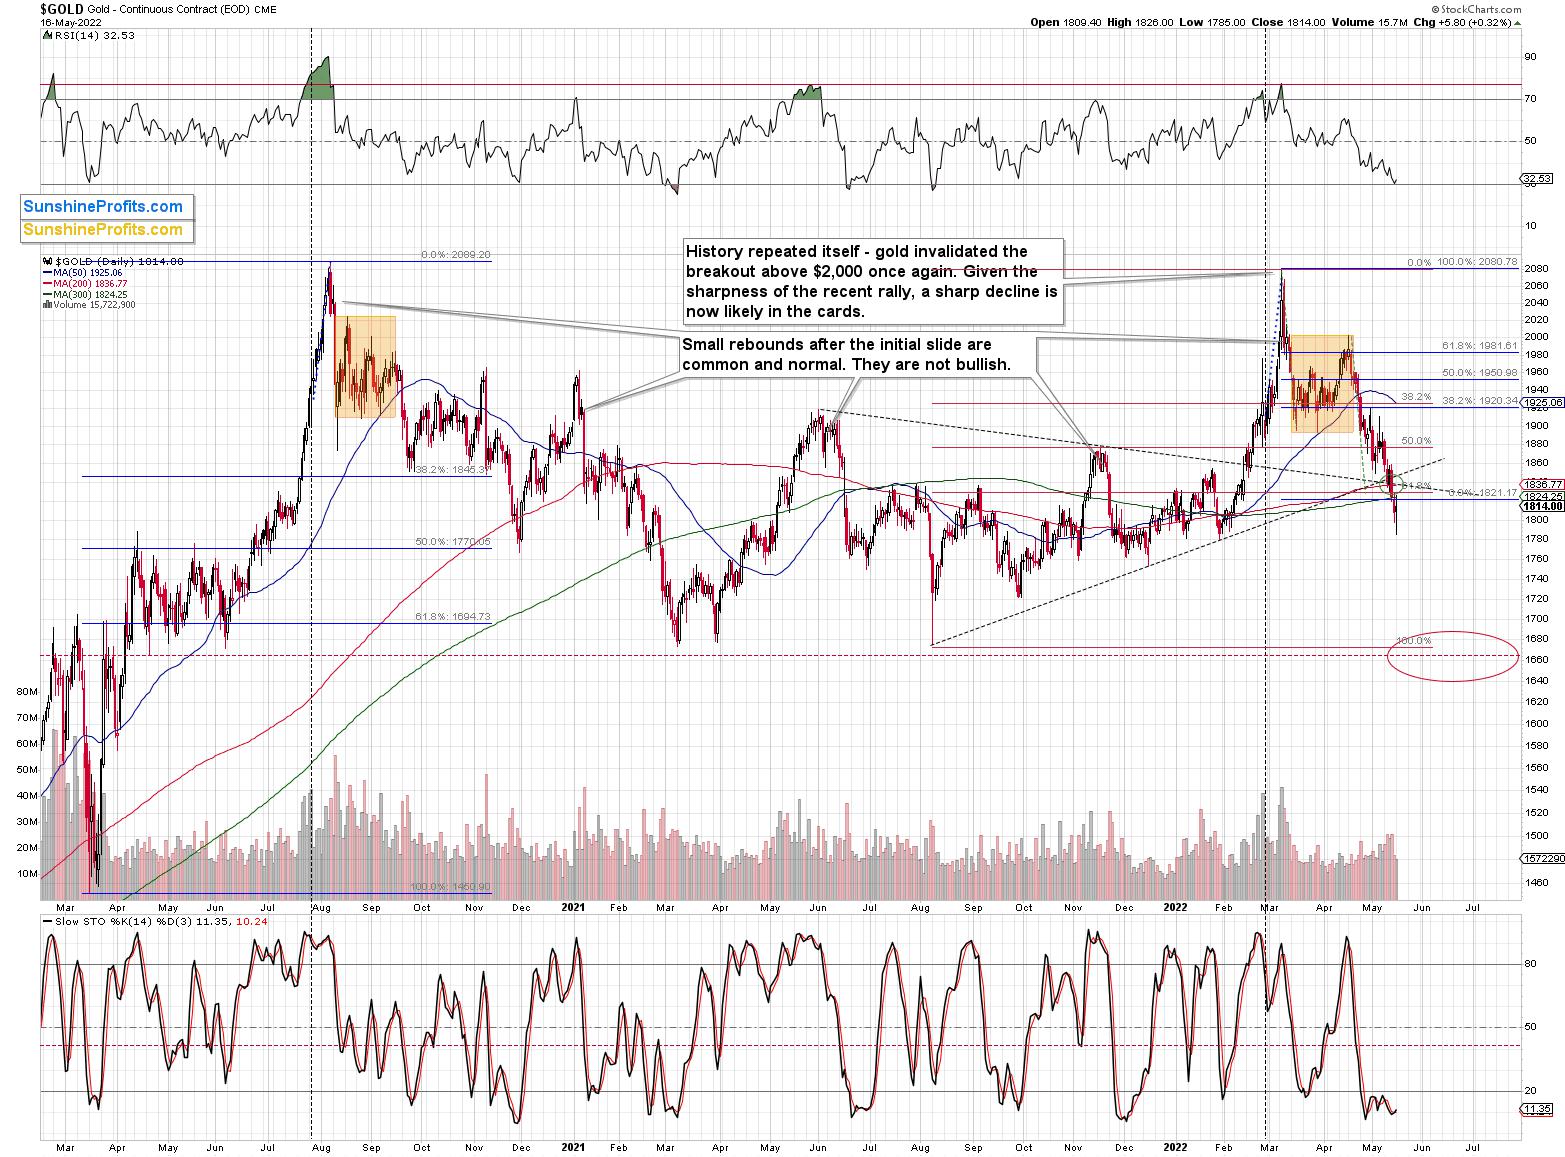
Gold ended the day only $5.80 higher, but the important thing is that it reversed at all. Gold’s RSI also bounced off the 30 level, which can be viewed as a buy signal on its own.
Junior miners were up by almost 1% yesterday, about 3 times more than gold. They continue to show strength, and our long positions (that became profitable almost immediately) are getting more profitable also in today’s early trading as the GDXJ is up in London trading.
In yesterday’s analysis, I wrote that the S&P 500 invalidated its head and shoulders pattern on an intraday basis, and even though it declined very modestly yesterday, it’s up in a clear manner in today’s pre-market trading.
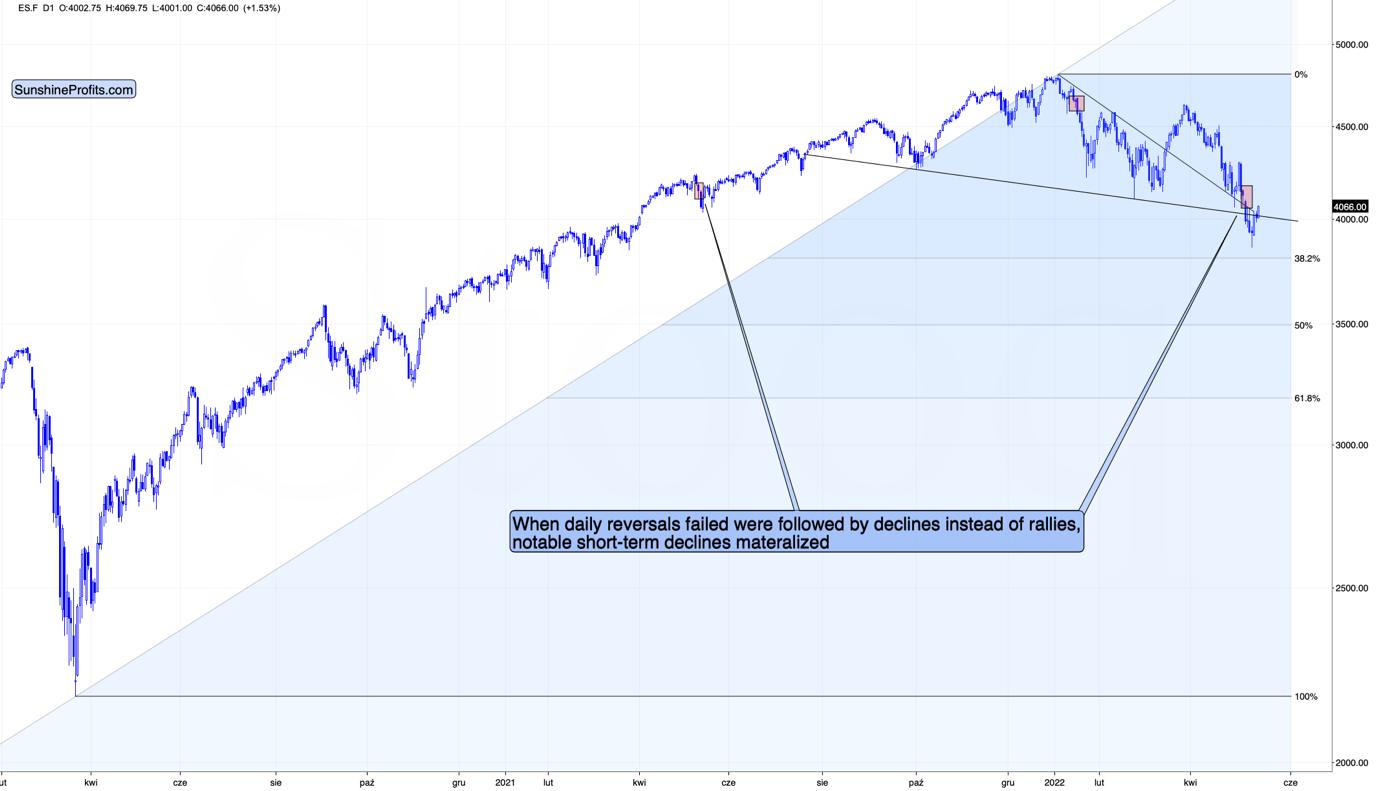
This means that the odds of a short-term rally in the following days have greatly increased. This makes the current long position in junior mining stocks even more justified.
Also, as far as the USD Index is concerned, I previously wrote the following:
The higher of the recent highs is at 103.96 right now, so if the analogy to 2014 is to remain intact, the USD Index could now top at close to 104.5 or even 105.
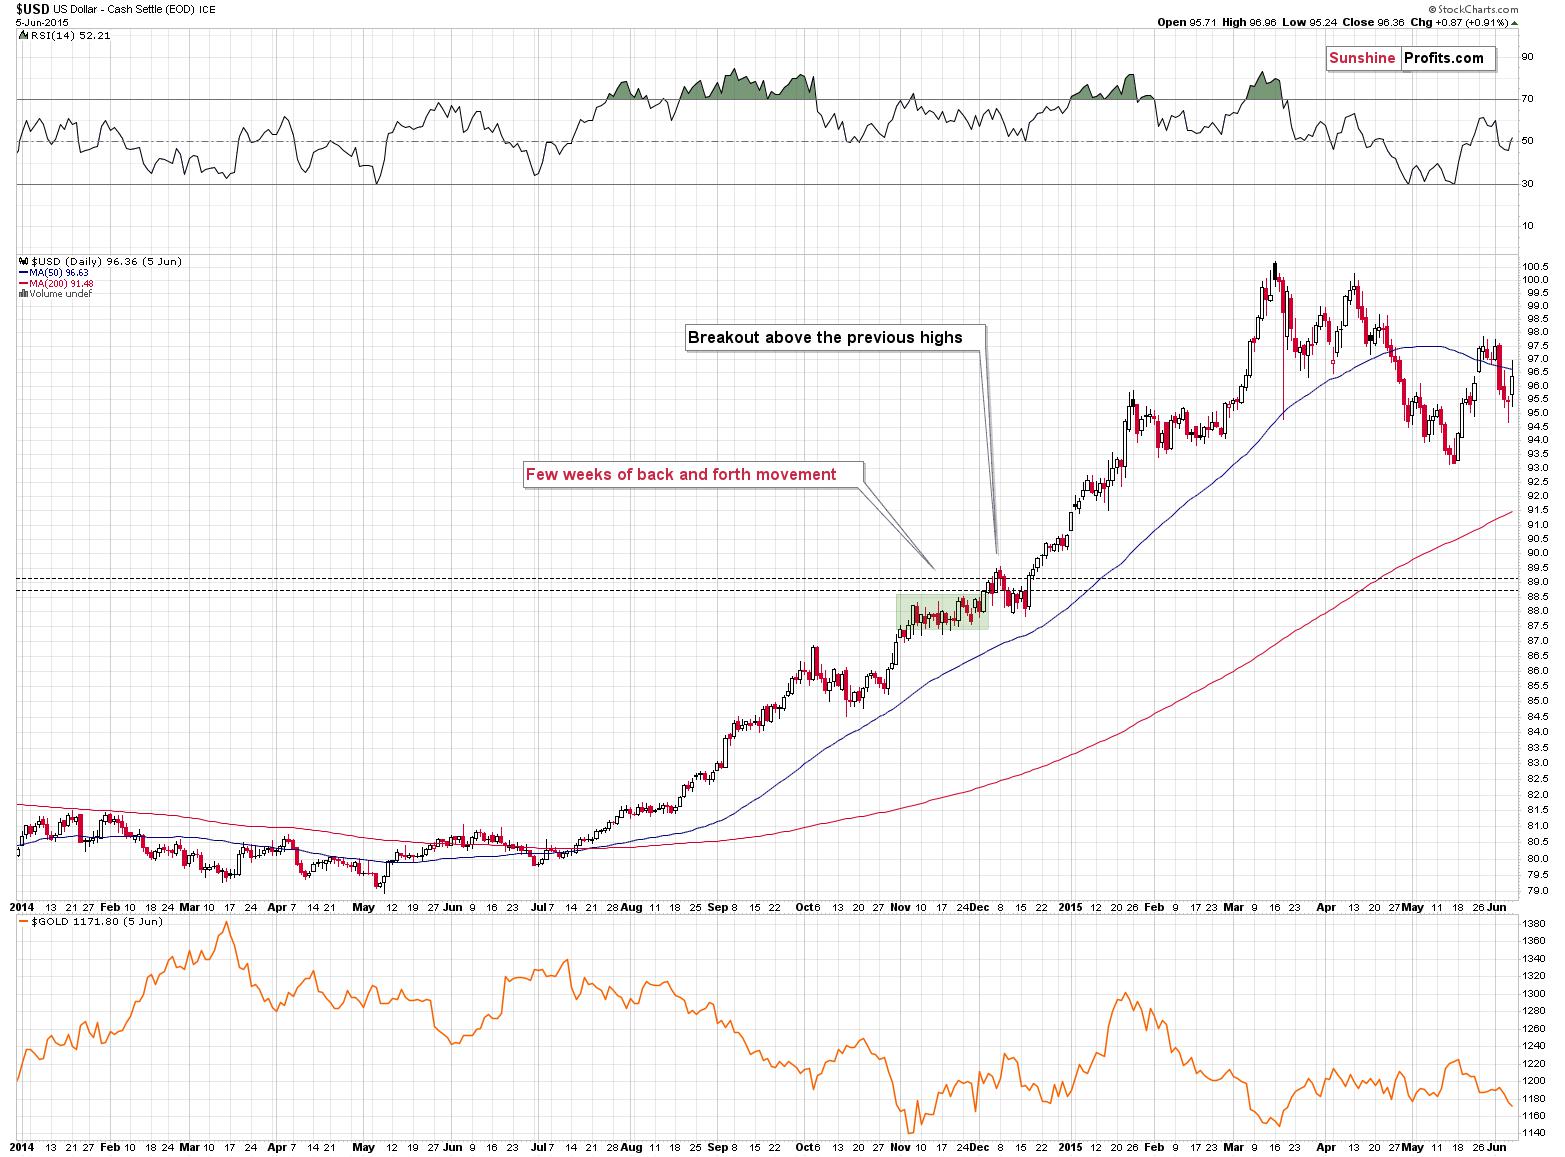
That’s exactly what happened recently. On Thursday, the USD Index moved to 104.96, and in Friday’s trading it rallied above 105 (to 105.065) and it invalidated the breakout above this level - which is in perfect tune with what I wrote above. Consequently, it seems that we could now see a move to about 103-103.5, after which USD’s rally could continue.
The opposite is likely to take place in the precious metals sector. Gold, silver, and mining stocks are likely to rally in the near term, and then – after topping at higher levels – their decline would continue.
The USD Index futures moved to about 103.7 in today’s pre-market trading (so far), so you might be wondering if the bottom is in or about to be, and therefore, will gold stop rallying.
Please note that it’s possible that the USD Index bottoms shortly in the 103-103.5 range but then continues to trade sideways for a few days, while gold continues to rally. In fact, that’s what happened in late 2014. Consequently, what we saw so far today doesn’t imply that gold’s, silver’s, or miners’ rallies are over.
Read Full Story »»»
DiscoverGold
TM GCM Mining Corp. April 18 News Release Recap Video
https://www.youtube.com/watch?v=3cztofuYcD0


Here’s Why I’m Bullish on Gold Miners
By: Przemyslaw Radomski | May 16, 2022
• Are you wondering if it’s worth choosing a long position in the gold market now? Well, consider taking a look at the junior miners first to find out.
Miners Last Week
On Thursday, I wrote that I was going to go long on junior mining stocks, and in the following hours, the GDXJ moved even a bit lower, providing you with a great opportunity to exit short positions and enter long ones in a comfortable manner. Hopefully, you did that, because the GDXJ rallied by almost 4% on Friday and ended the week above $37. The popular leveraged ETF, JNUG, was up by over 7% in a single day.
If you’re long on miners and you reaped those profits – congratulations! If not, let me re-emphasize what I wrote in Friday’s extensive flagship Alert: it seems to me that the short-term rally has only begun, and that quick profits are likely just around the corner.
Looking at gold’s pre-market decline, one might get second thoughts about the above, but please note that we are long on mining stocks, not gold, and there is a good reason why I chose mining stocks as a proxy and not gold or silver. The reason is that miners tend to show strength relative to gold before the bottom and then immediately thereafter.
Consequently, even if gold didn’t bottom last week and we’re seeing a bottom more or less right now, it doesn’t necessarily mean that miners will test their lows too.
Gold Price Action This Week
Let’s check what’s gold been doing so far this week.

Gold is down to new lows in today’s pre-market trading, and it’s well below my initial target area for it. However, another important support level is just around the corner.
I don’t mean just the psychologically important (being round) $1,800 level. That too, but it’s crucial to note that gold just moved to levels from which the entire war-tension-based rally started. If it wasn’t for those tensions, gold would likely have plunged profoundly in February and perhaps it would be already after or getting close to its final low. However, since the war has indeed started, gold peaked (when the tensions and uncertainty peaked), and it’s been moving lower since that time – despite what most analysts told you.
Gold and Uncertainty
Here’s what I wrote on February 28, 2022, in the Gold & Silver Trading Alert entitled “Since There is a War, Gold Will Rise, Right? Wrong.”:
Let’s keep in mind that for gold to decline, the war doesn’t have to end, it doesn’t have to be won by either side. The only thing that matters with regard to it, is how big the uncertainty and concern is. And the peak uncertainty/concern might be today, as everything is new, and the situation is dramatically changing the geopolitical environment in Europe.
For comparison, remember Covid-19 cases, deaths in early 2020? That was just a tiny fraction of what we saw later. However, it was new and unknown. People were particularly scared then, and the markets moved particularly significantly then – not based on additional millions of cases and thousands of deaths next year.
Investing and trading are difficult. If it was easy, most people would be making money – and they’re not. Right now, it’s most difficult to ignore the urge to “run for cover” if you physically don’t have to. The markets move on rumor and sell the fact. This repeats over and over again in many (all?) markets, and we have direct analogies to similar situations in gold itself. And junior miners are likely to decline the most, also based on the massive declines that are likely to take place (in fact, it already started) in the stock markets.
That wasn’t the peak uncertainty, but the latter peaked about a week later, and the war is still taking place months later, so it seems that one could say that the above proved to be correct.
Since junior miners just moved to new 2022 lows, it was also profitable not to chase the “emotional stampede”, but rather focus on the analogies to the previous situations from the past. Based on how the situation has developed in the markets so far, it seems that the clearest analogy is to how the gold market performed in 2001, based on the U.S.-Afghanistan war. I provided the chart in my Feb. 28, 2022, analysis, but here it is again:

The decline had been big and sharp, but please note when it ended. Gold formed an initial, and then final, short-term bottom, very close to the price levels at which the rally started before the outbreak of the war.
Gold Today
Fast-forward to the current situation – these are the levels that gold is approaching in today’s pre-market trading.
The January 2022 low is $1,781.30 and the February 2022 low (which is also the yearly low) is $1,778.80.
Today’s pre-market low is $1,787.44 (at least so far). That’s less than $10 away from the above-mentioned strong support levels.
All this means is that gold and silver prices might have just bottomed or that they could bottom shortly.
Miners vs Gold
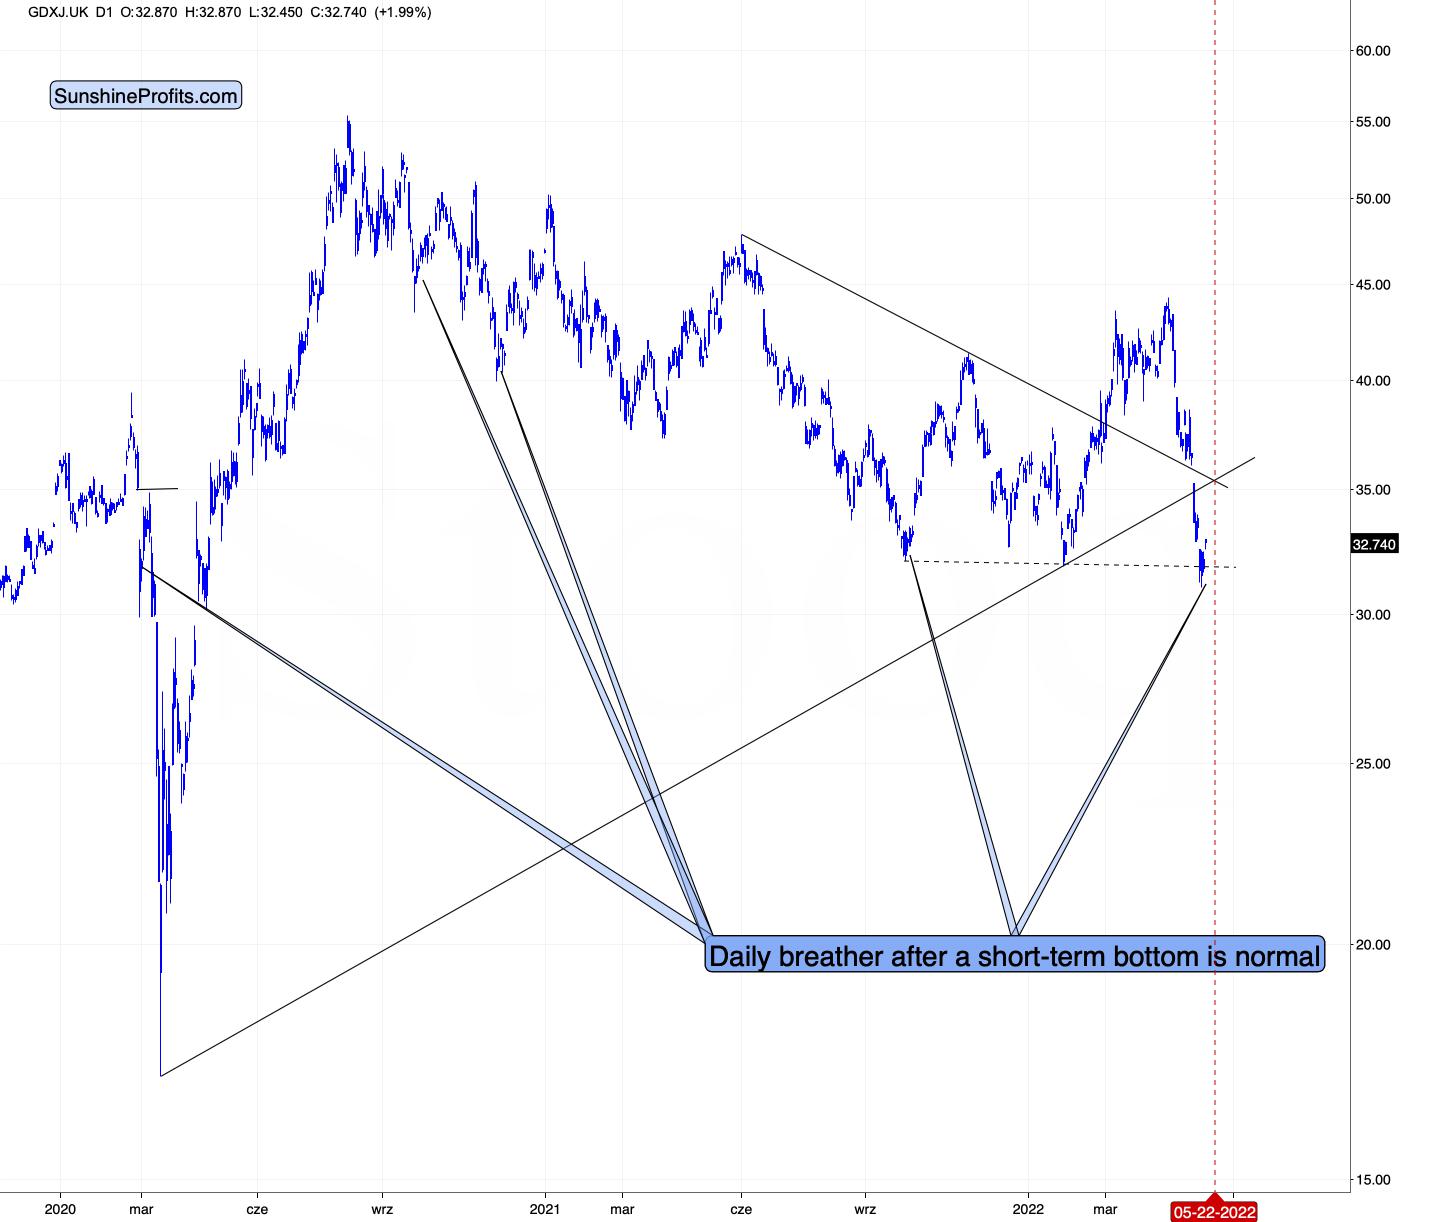
Let’s not forget what miners tend to do before and right after bottoms – they tend to show strength relative to gold. Let’s check what the GDXJ ETF is doing in today’s London trading.

It corrected somewhat, but unlike gold, the GDXJ didn’t move to new lows today. In other words, junior miners are showing strength, just as they are supposed to around the bottoms.
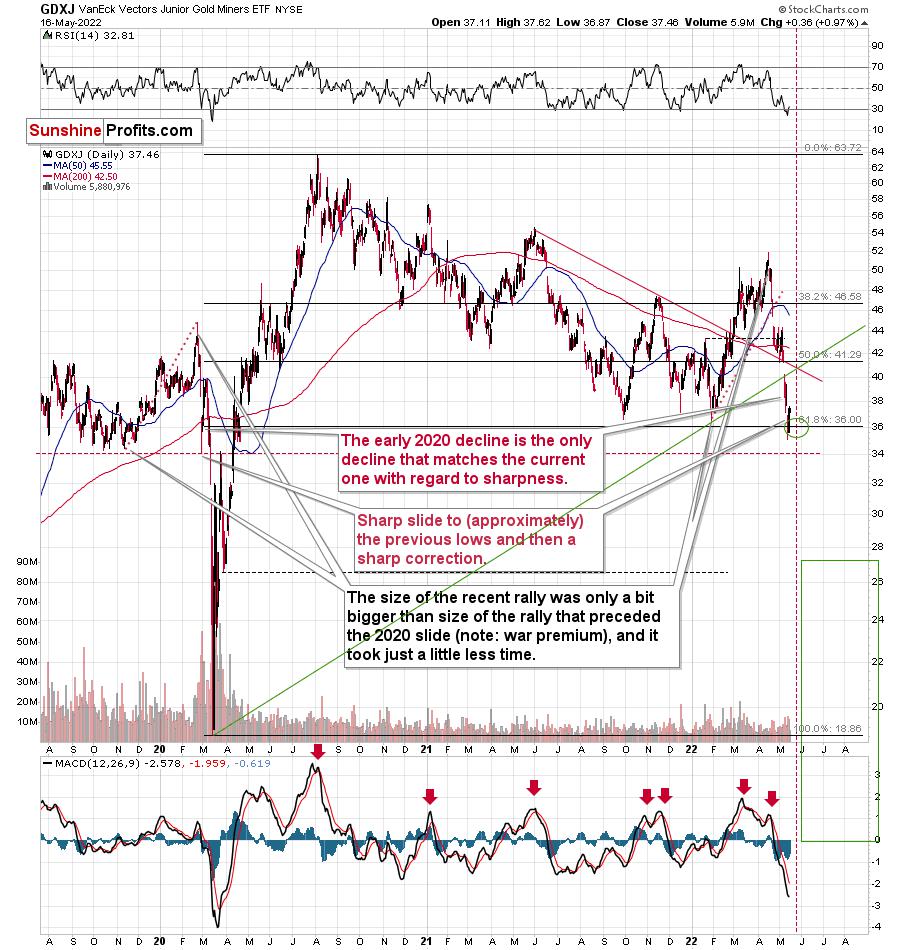
There are three more things on the above chart that I would like to discuss.
1. The first is that a daily pause right after the turnaround is common for the GDXJ, and I marked several other occasions where we saw something similar. This includes what we saw after the sharp early-2020 correction.
2. The second thing is that it’s clear that the GDXJ just (on Friday) invalidated the small breakdown below its previous (2021 and 2022) lows. This is a huge bullish development (for the short term only!). Invalidations of breakdowns immediately become bullish signals, without the need to wait for confirmation, and that’s what we just saw.
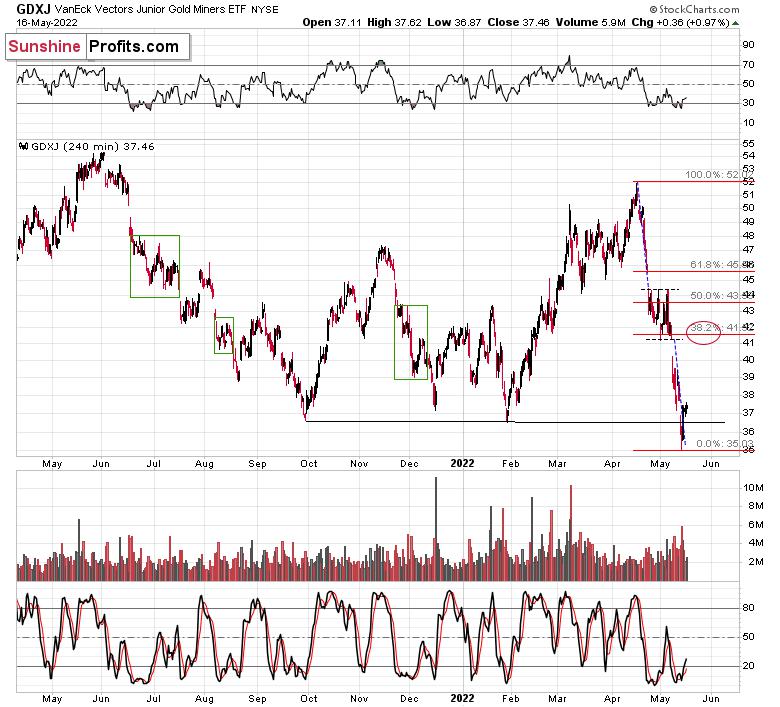
3. The third indication is the triangle-vertex-based reversal, which will take place in about a week. It points to some kind of reversal taking place on May 22. That’s Sunday, so based on the above, we might expect a turnaround on Friday or next Monday.
Trading Strategy and Technical Analysis
This serves as an indication that we might want to prepare ourselves to close the current long position and go back on the short side of the trade before the end of the week – perhaps on Friday. Geopolitically, a lot can happen over the weekend, so I’d prefer to be positioned along with the medium-term trend beforehand.
The invalidation described as the “second thing” is also something that we saw from the U.S. perspective, so it’s definitely important.

The thing that I’d like to add is that the RSI just moved back above 30 after being below it, which is a classic buy signal. That’s what marked the end of the 2020 decline, and something very similar to what marked the end of the initial March decline (RSI just touched 30 at that time, but it was enough).
Please note that the triangle-vertex-based reversal point is practically the same from the U.S. point of view, so it adds credibility to the scenario in which junior miners top close to the end of this week.

This fits the target area that I provided on Friday on the above 4-hour-candlestick GDXJ chart.
The target would also fit the sharpness of the recent decline. After all, corrections tend to be similarly volatile as the price moves that are being corrected. Of course, let’s keep in mind that the current long position is for trading capital only, not for long-term investments, as I don’t think that the medium-term downtrend in gold, silver, and mining stocks is completely over yet.
Read Full Story »»»
DiscoverGold
Gold makes screwy start this morning.1803 to 1804 is magnetic. It’s wasting good share buys at 8:30, NY Fed didn’t say anything that wasn’t already crystal clear. July can’t come too soon.
Rookie or completely clueless amateurs trying to predict gold, or they are short futures. ive got at least 3 indicators that say gold is a couple weeks away from blastoff, besides the long term trendline is completely intact to date. anything can happen forward but is see an imminent uptrend like never before, ever.
Gold Forecast: It's Time To Buy
By: Jim Curry | May 15, 2022
Recapping Last week
Last week's trading saw Gold forming its high in Monday's session, here doing so with the tag of the 1885.60 figure. From there, a sharp decline was seen into late-week, with the metal dropping down to a Friday low of 1797.20 - before bouncing slightly off the same to end the week.
Gold Cycles, Short-Term
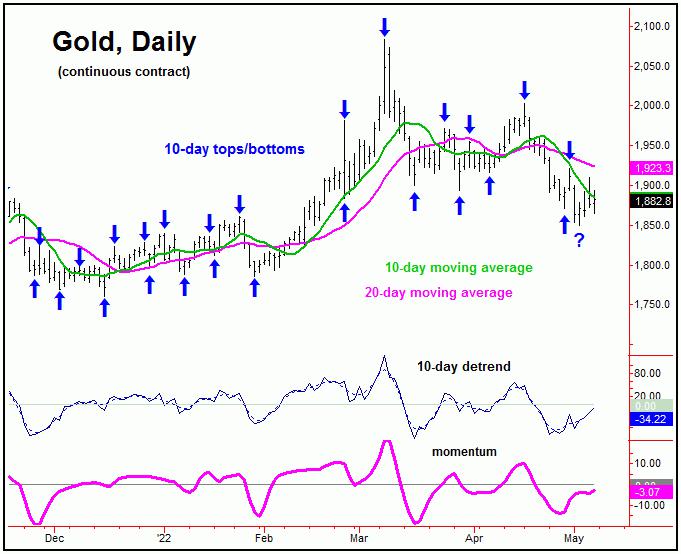
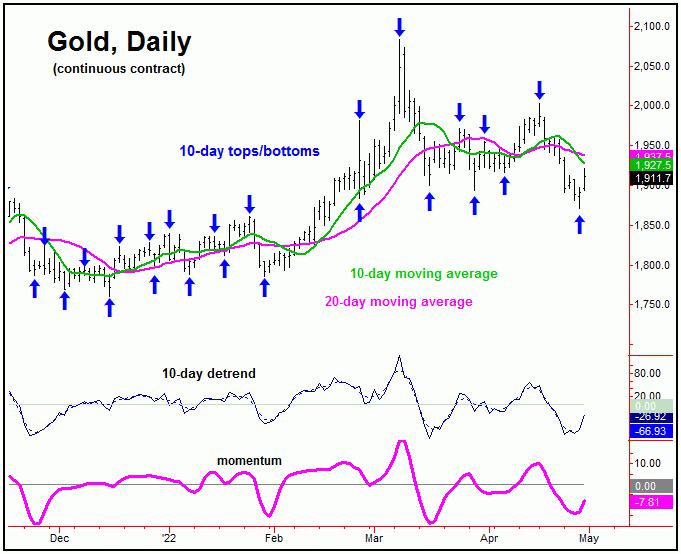
For the very short-term, the downward phase of the smaller 10 and 20-day cycles is currently deemed to be in force, though are into bottoming range. The chart below shows the smaller of these waves, the 10-day component:
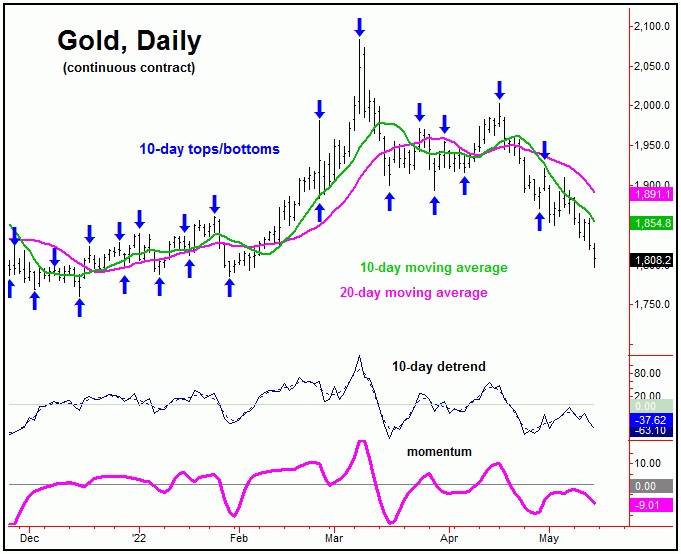
With the recent action, our current upside 'reversal point' for the 10 and 20-day waves is set at intraday push back above the 1865.00 figure (June, 2022 contract) - a number which could continue to drop going forward, depending on the action, with the most current numbers always posted in our Gold Wave Trader market report.
Stepping back slightly, from whatever bottom that is seen with the 10 and 20-day waves, the probabilities will favor a rally back to the 20-day moving average or better on their next short-term upward phase.
Gold's 72-Day Downward Phase Still in Force
Since the March peak of 2083.70, Gold has seen a drop of over 290 points into the low seen last week, with the metal now trading below its December, 2021 close of 1835.10. With that, anyone who has bought the metal this year (and still holding) is now at a loss. With that, there seems to be a complete lack of interest in the Gold market.
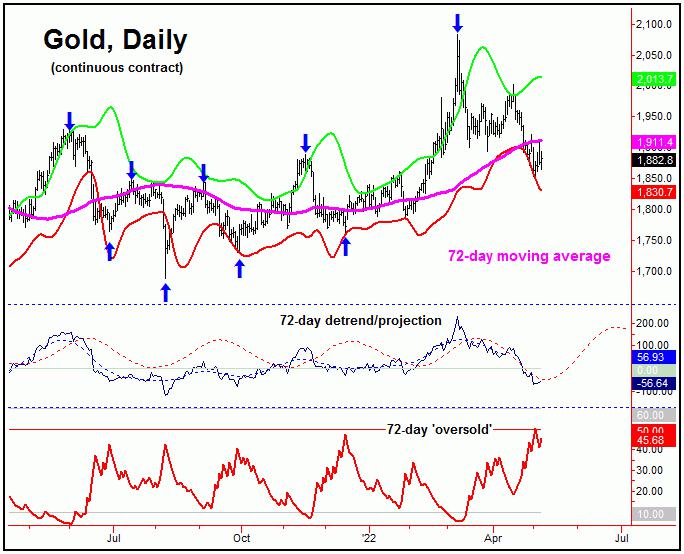
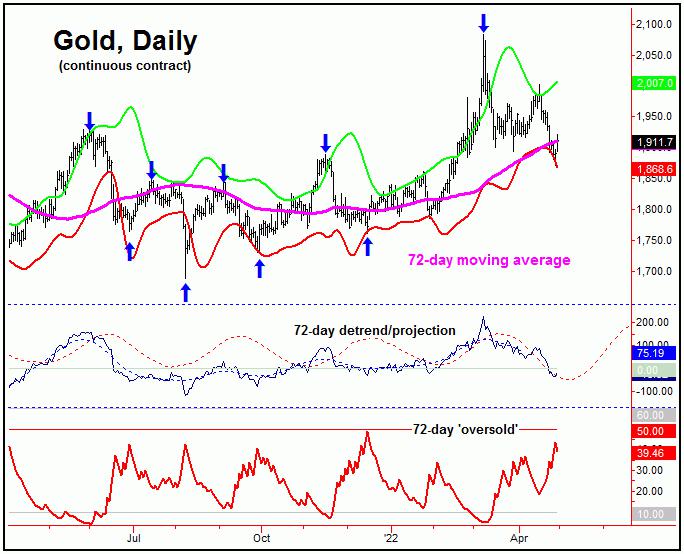
The lack of interest in Gold is a good sign, with the bullish case now starting to strengthen. That is, the next bottom of significance expected to come from Gold's 72-day cycle, which is shown again on the chart below:
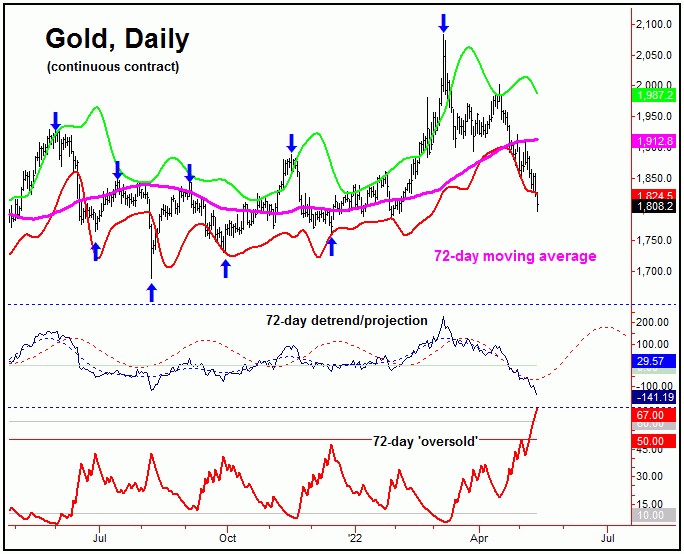
In terms of time, we are now into extended territory with this 72-day cycle. Once this 72-day wave does bottom, the average rallies with the same have been 14% off the low, lasting an average of 40 trading days before topping. With that, there is a ton of potential upside, once this wave does turn higher.
From last weekend: "in order for the next really good buy trigger to be seen with Gold, I would like to see our 72-day 'oversold' indicator (which moves inversely to price - similar to the VIX, vs. the U.S. stock market) spiking above its upper reference line - which the recent action has now seen. I would also like to see daily close below our lower 72-day cycle band indicator, with the combination of the above ideally seen on the same trading day. This particular pattern/setup is often seen near key lows with this 72-day cycle."
The one thing that we did finally see with the action into late last week was this: we now have a close below our lower 72-day cycle band, as well as a daily spike above our upper 72-day 'oversold' line. From the comments made in recent outlooks, this pattern is often seen at or near lows with this wave.
With our 72-day cycle at or into normal bottoming range, its next low is due to materialize at anytime. Even said, Gold needs to take out a key upside 'reversal point' for price - an exact number which we are watching closely in the days ahead, with precise details noted in our Gold Wave Trader report.
Gold, Mid-Term Picture
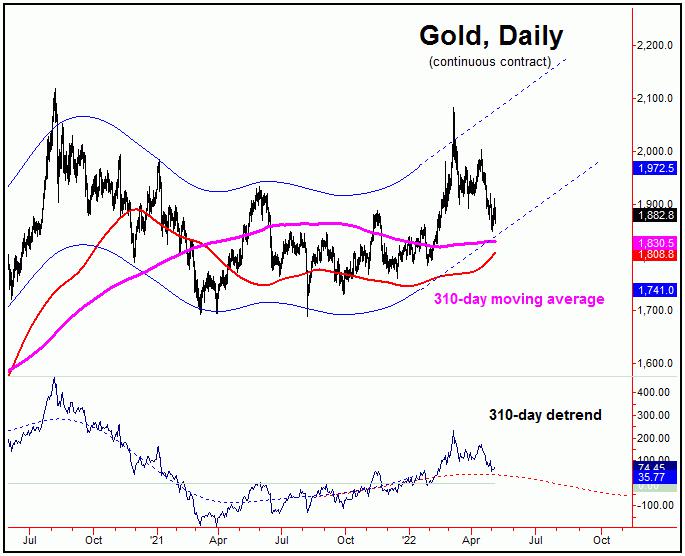
In terms of patterns, the overall assumption is that the current correction phase with the 72-day cycle will end up as a countertrend affair - holding above the December, 2021 trough of 1760. If correct, then the next upward phase of this wave is favored to take Gold back above the 2083 swing top (the prior 72-day peak) into what looks to be the July - August timeframe of this year.
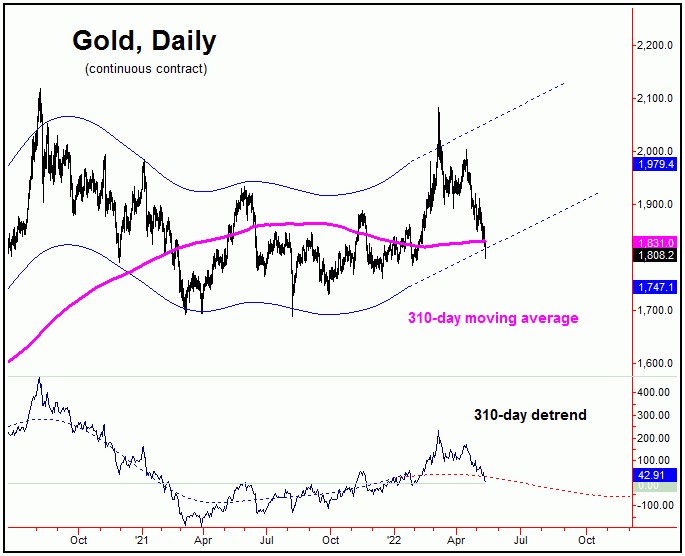
For the bigger picture, higher highs into mid-to-late Summer of this year - if seen - should eventually top our larger 310-day cycle (chart, above), for what is expected to be another good percentage decline into later in the year.
On the flip side, any break below that December, 2021 trough would tell us that our larger 310-day cycle has already topped - and would tell us to expect the next 72-day cycle upward phase to end up as only a countertrend affair. Note that either of the above scenarios favors a sharp rally soon playing out with the 72-day wave, with the new week expected to provide some key information. Stay tuned.
Read Full Story »»»
DiscoverGold
Jack Chan: Gold Price Exclusive Update
By: Jack Chan | May 14, 2022
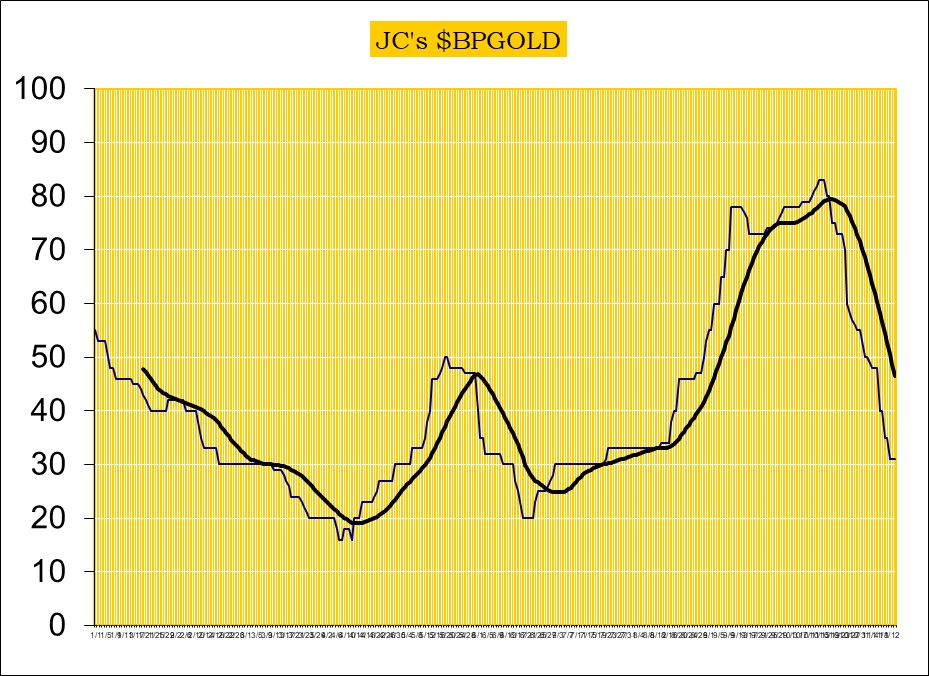
Our proprietary cycle indicator is DOWN.
To public readers of our updates, our cycle indicator is one of the most effective timing tool for traders and investors. It is not perfect, because periodically the market can be more volatile and can result in short term whipsaws. But overall, the cycle indicator provides us with a clear direction how we should be speculating.
Investors
During a major buy signal, investors can accumulate positions by cost averaging at cycle bottoms, ideally when prices are at or near the daily 200ema.
During a major sell signal, investors should be hedged or in cash.
Traders
Simply cost average in at cycle bottoms when prices are at or near the daily 200ema; and cost average out at cycle tops when prices are above the daily 50ema.
Gold sector is on a new long term BUY signal, suggesting that the correction since 2020 has been completed.
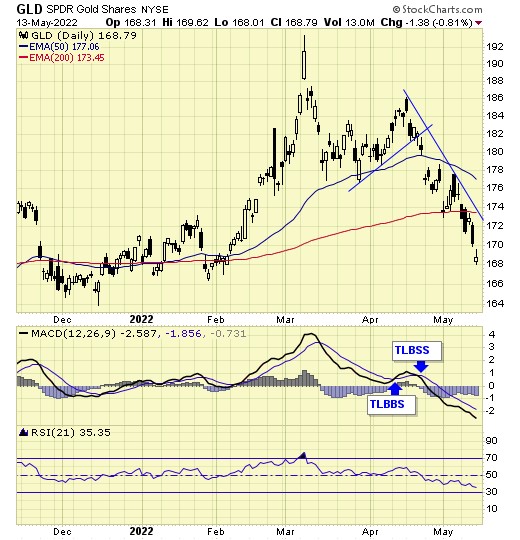
GLD is on short term sell signal.
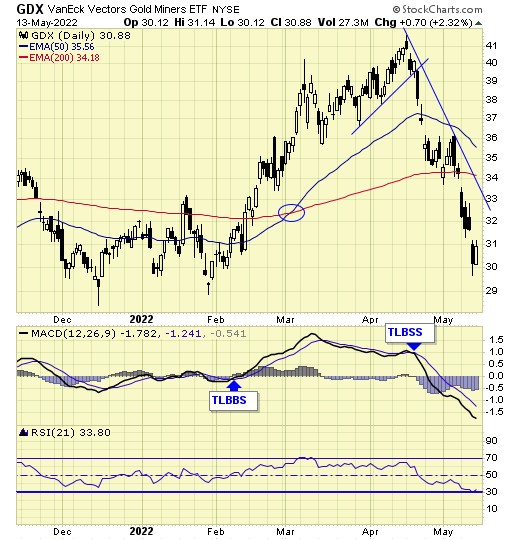
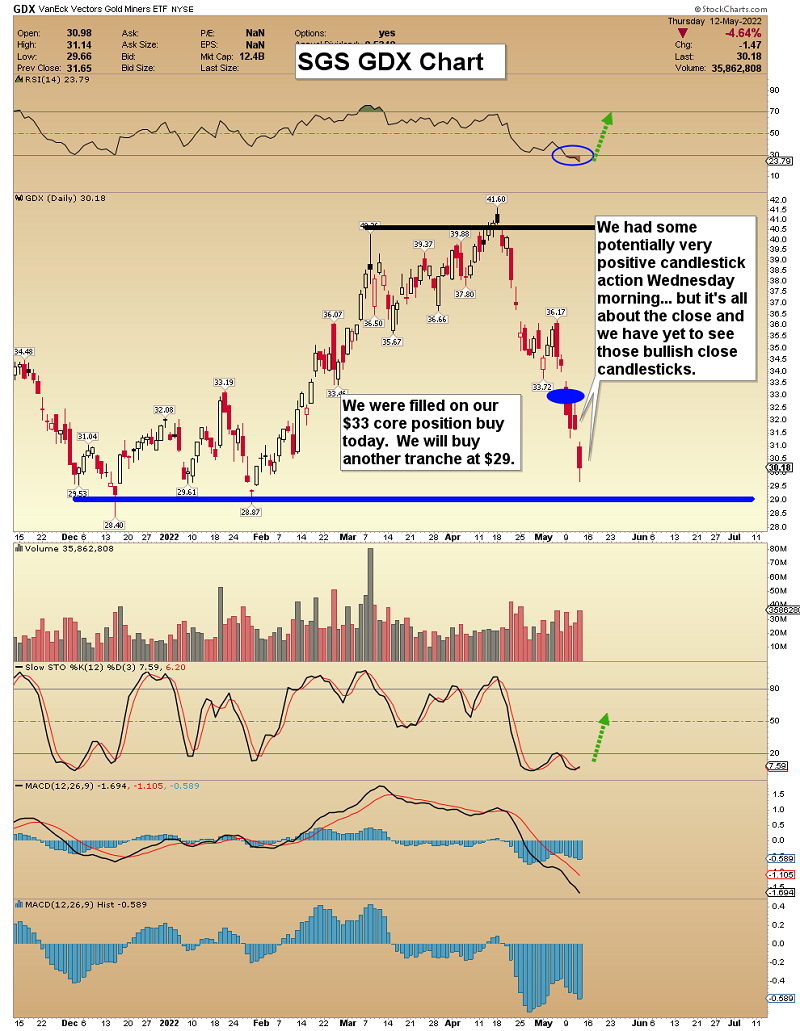
GDX is on short term sell signal.
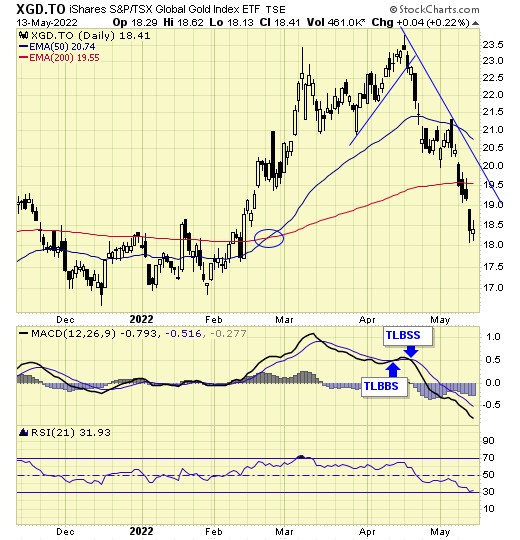
XGD.to is on short term sell signal.
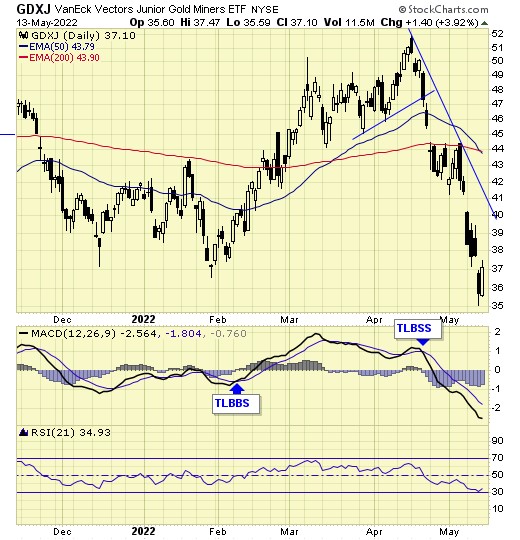
GDXJ is on short term sell signal.
Analysis
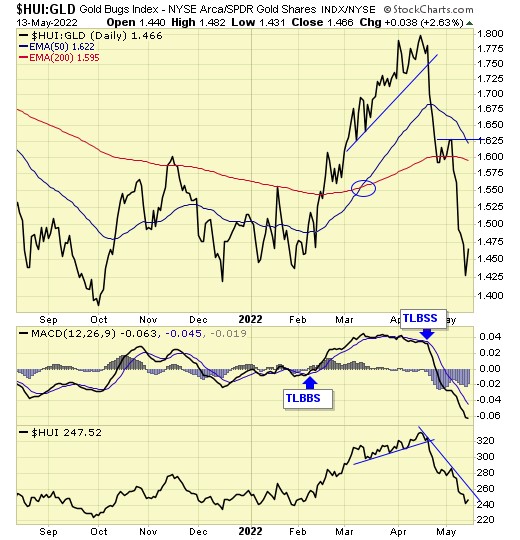
Our ratio is on sell signal.
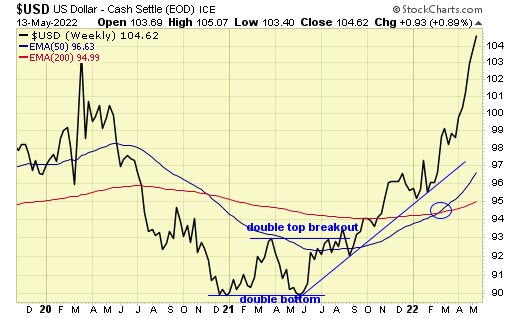
Trend is up for the dollar.
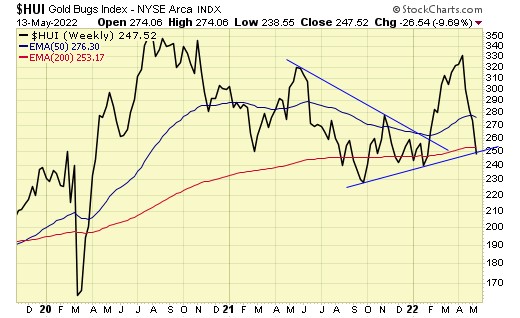
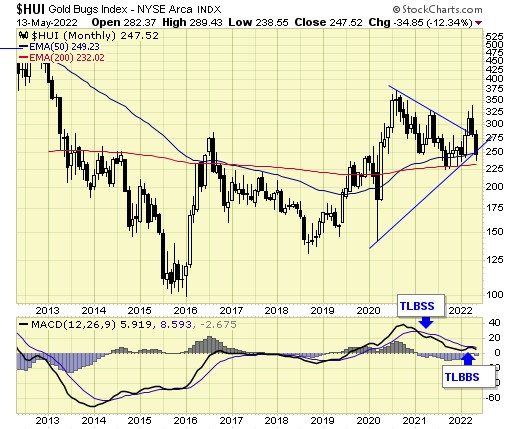
$HUI is testing support.
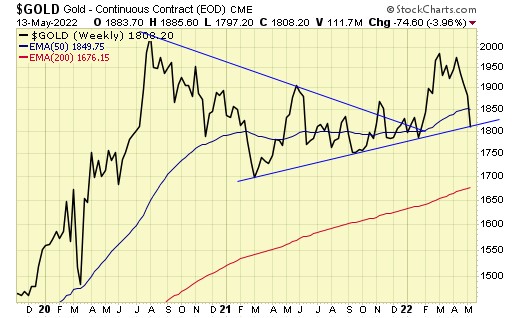
Gold is testing support.
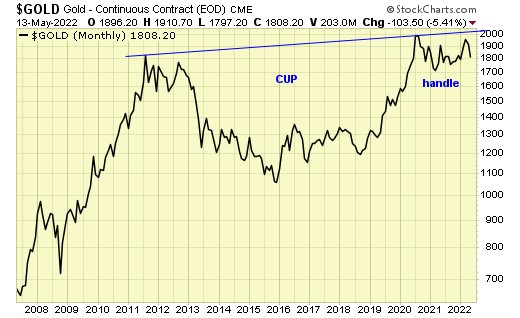
The multi year “cup with handle” is in progress.
Summary
Long term – on BUY signal.
Short term – on sell signals.
Gold sector cycle is DOWN.
A correction is in progress.
$$$ We are holding a core position and will be a buyer again at the next cycle bottom.
Read Full Story »»»
DiscoverGold
NY Gold Futures »» Weekly Summary Analysis
By: Marty Armstrong | May 14, 2022
The NY Gold Futures closing today at 180820 is immediately trading down about 1.11% for the year from last year's settlement of 182860. Factually, this market has been declining for 2 months and if the market continues to remain beneath the previous month's low of 187090 on a closing basis, then it will remain weak for now. This price action here in May is warning that we may have at least a temporary high in place beginning perhaps a bearish reactionary move on the monthly level if we see lower prices next month or close lower. Otherwise, there remains the potential for a one-month Knee-Jerk reaction low. As we stand right now, this market has made a new low breaking under the previous month's low dropping to 179720 intraday and remains trading beneath that level.
ECONOMIC CONFIDENCE MODEL CORRELATION
Here in NY Gold Futures, we do find that this particular market has correlated with our Economic Confidence Model in the past. The Last turning point on the ECM cycle low to line up with this market was 2015. The Last turning point on the ECM cycle high to line up with this market was 2020 and 2011 and 1996.
MARKET OVERVIEW
NEAR-TERM OUTLOOK
The historical perspective in the NY Gold Futures included a rally from 2015 moving into a major high for 2020, the market has been consolidating since the major high with the last significant reaction low established back in 2015. The market is still holding above last year's low but is trading rather weak at this moment. The last Yearly Reversal to be elected was a Bullish at the close of 2020.
This market remains in a positive position on the weekly to yearly levels of our indicating models.
Looking at the indicating ranges on the Daily level in the NY Gold Futures, this market remains in a bearish position at this time with the overhead resistance beginning at 183450.
On the weekly level, the last important high was established the week of March 7th at 207880, which was up 30 weeks from the low made back during the week of August 9th. We have been generally trading down for the past 3 weeks, which has been a very dramatic move of 10.27%.
Looking at this from a broader perspective, this last rally into the week of April 18th reaching 200300 failed to exceed the previous high of 207880 made back during the week of March 7th. That rally amounted to only three typical reaction weeks. Subsequently, the market has breached that low of the week of March 28th and has closed beneath it warning the market is weak. Right now, the market is below momentum on our weekly models casting a bearish cloud over the price action. Looking at this from a wider perspective, this market has been trading up for the past 8 weeks overall.
INTERMEDIATE-TERM OUTLOOK
YEARLY MOMENTUM MODEL INDICATOR
Our Momentum Models are declining at this time with the previous high made 2020 while the last low formed on 2021. However, this market has rallied in price with the last cyclical high formed on 2020 and thus we have a divergence warning that this market is starting to run out of strength on the upside.
Critical support still underlies this market at 175200 and a break of that level on a monthly closing basis would warn that a sustainable decline ahead becomes possible. Nevertheless, the market is trading below last month's low warning of weakness at this time.
DiscoverGold COT - Commitments of Traders in Metals Futures Market Reports
By: Software North | May 13, 2022
Gold

Silver

Read Full Story »»»
DiscoverGold
Gold Stocks: Value But No Buy Signals
By: Morris Hubbartt | May 13, 2022
SGS Key Charts, Signals, & Video Analysis
Super Force Signals (SFS) is being rebranded as Super Gold Signals (SGS at https://supergoldsignals.com), to reflect the growing global importance of gold.
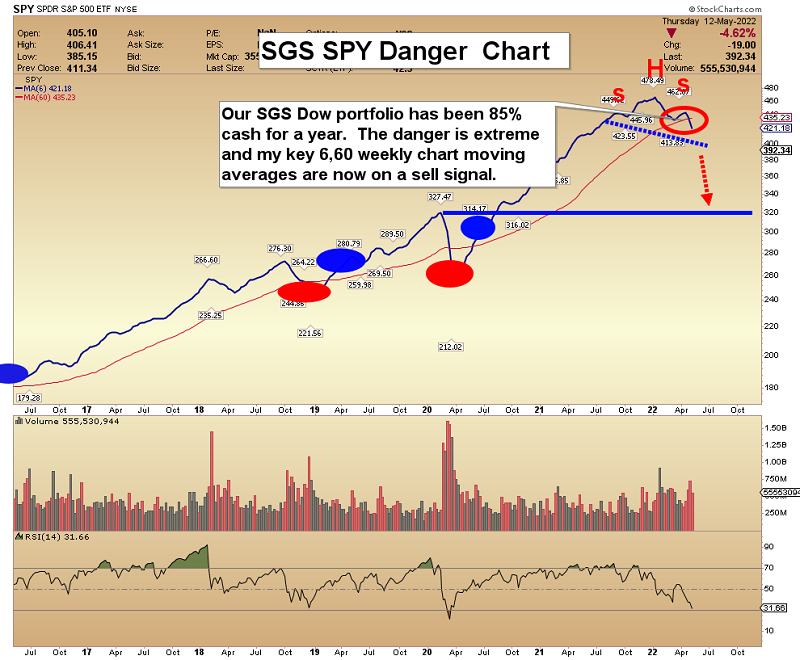
I cover the big technical picture for gold, the stock market, and commodities in my flagship SGS newsletter, with a focus on key candlestick actin. Finland and Poland are now part of concerning US-Russia tensions. That brings danger, and opportunity, for investors! At $249 a year, subscribers love the SGS value. I'm offering an inflation special of a full 14 months for just $199. Send me an email if you want the offer and I'll get you onboard, thanks!
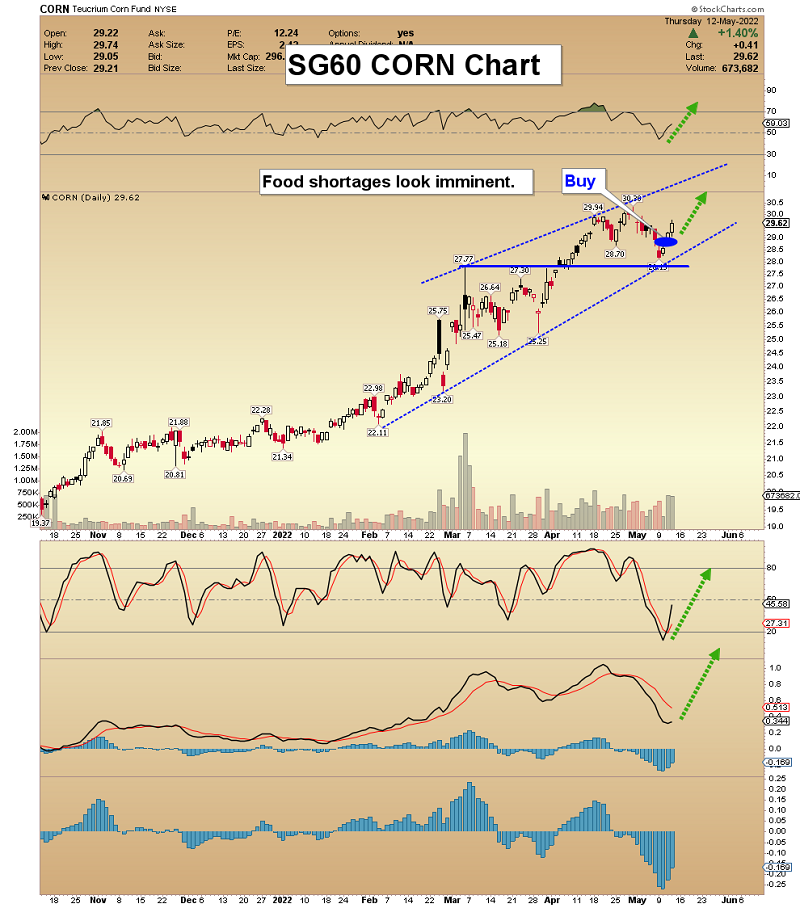
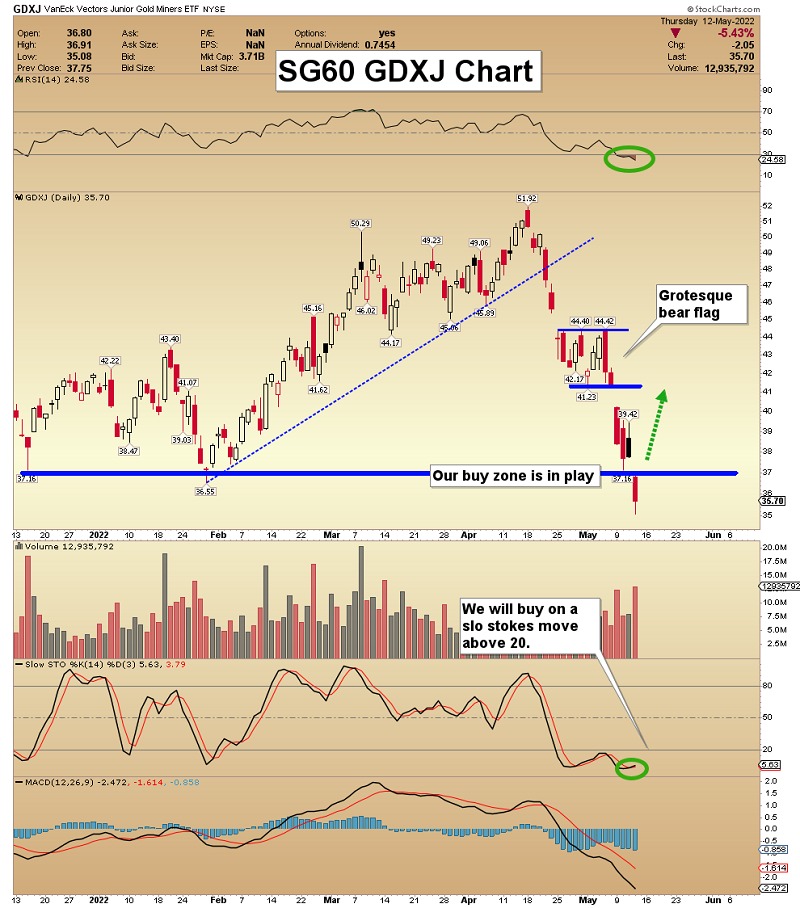
SG60 Key Charts, Signals, & Video Analysis
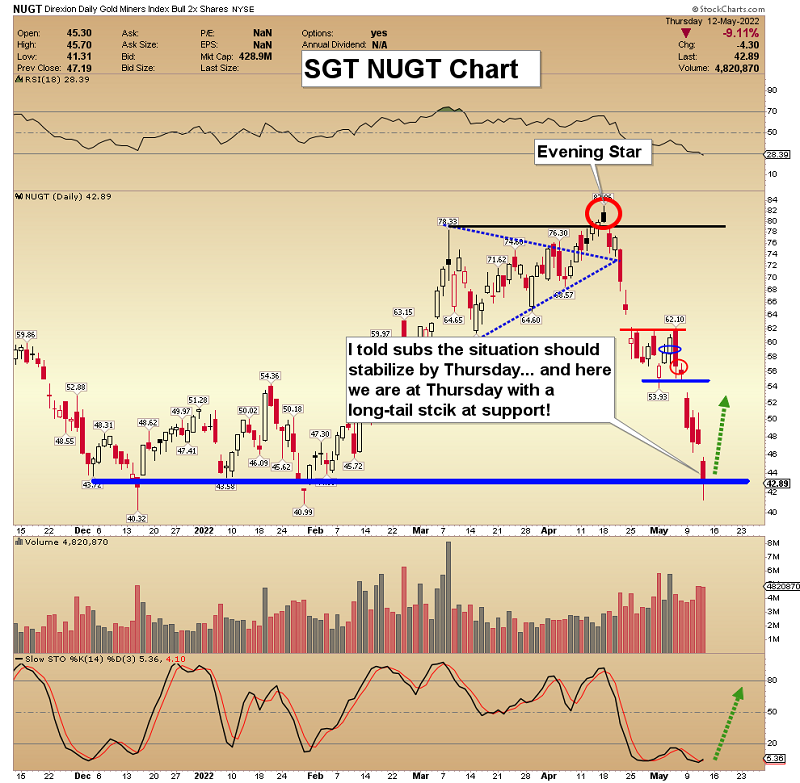
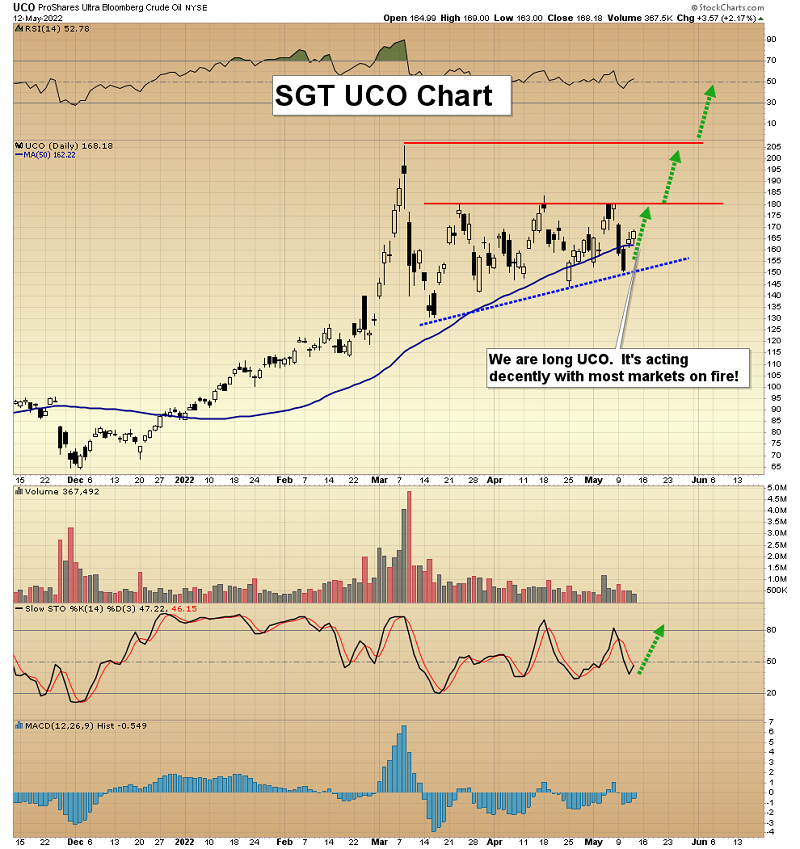
SGT Key Charts, Signals, & Video Analysis
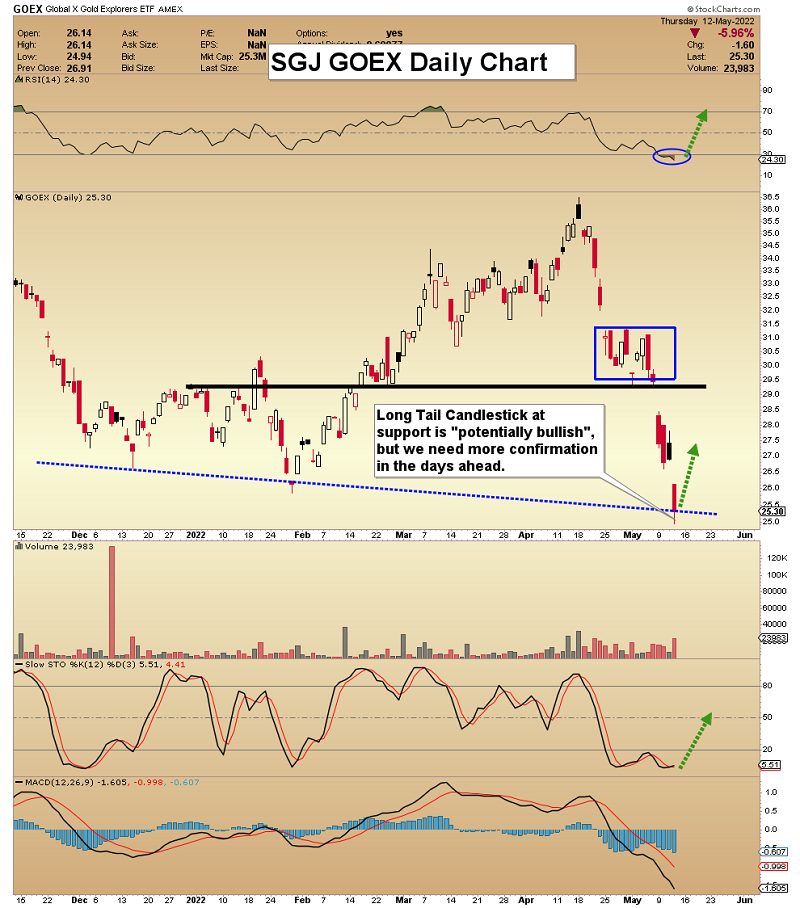
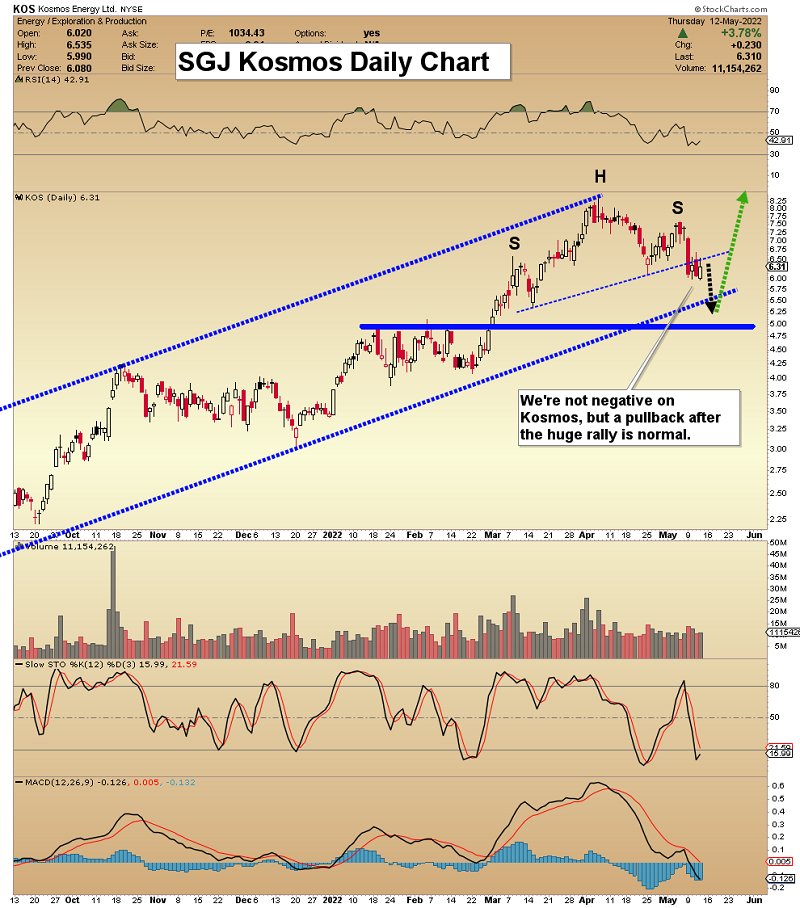
SGJ Key Charts, Signals, & Video Analysis
Read Full Story »»»
DiscoverGold
Gold Miners’ Q1’22 Fundamentals
By: Adam Hamilton | May 13, 2022
The major gold miners’ stocks have plunged in recent weeks, obliterating positive sentiment. They got sucked into the serious stock-market selloff fueled by extreme Fed hawkishness, which spawned big fear. But that is rash given this sector’s long record of powering higher on balance through general-stock bear markets. The gold miners’ fundamentals remain solid-to-strong, as revealed in their just-reported Q1’22 results.
The most-popular major-gold-stock benchmark remains the venerable GDX VanEck Gold Miners ETF. Launched way back in May 2006, it has since parlayed its first-mover advantage into an insurmountable lead. Even in its present battered state, mid-week GDX’s net assets of $13.0b dwarfed those of the next-largest 1x-long gold-miners-ETF competitor by a staggering 25.9x! GDX is effectively the only game in town.
The larger gold miners were actually having a great year until the stock markets started crumbling several weeks ago. By mid-April GDX had surged a smart 27.6% year-to-date! That amplified gold’s parallel rally by a big 3.4x, better than GDX’s usual 2x-to-3x gold-leverage range. And both the metal and its miners’ stocks were trouncing the flagship S&P 500 broad-market index, which had dropped 7.9% in that same span.
That’s how gold and gold stocks usually work during material stock-market selloffs, powering higher on balance as general stocks weaken. Even major bear markets mostly unfold slowly, taking a couple years or so to finish their maulings. But occasionally downlegs cascade precipitously, fueling flaring fear that infects everything including gold. Thus its miners’ stocks can get trapped in those rare fear maelstroms.
Since gold stocks’ latest interim high in mid-April, the S&P 500 has plunged a serious 10.4%! That heavy selling spawned big safe-haven buying, fueling a monster 3.2% surge in the US Dollar Index in that short span. That flight to cash unleashed massive gold-futures selling, hammering the yellow metal a sharp 6.3% lower. The VIX fear gauge soared 47.1%. All that bludgeoned GDX 22.6% lower in only 17 trading days!
So in just several weeks gold stocks have done an abrupt turn-one-eight from mounting popularity as their gains grew to being mired in universal bearishness. But dumping this sector given the extraordinary market backdrop is a baby-with-the-bathwater type of mistake. With inflation raging, gold and its miners’ stocks are the best investments now. History has proven that true regardless of stock bears and Fed rate hikes.
This week’s latest US Consumer Price Index print remained red-hot, soaring 8.3% over this past year! That’s slightly off the prior month’s worst levels since December 1981, despite this inflation gauge being intentionally lowballed by the government. Surging general prices are the result of absurd Fed money printing. Over 25.5 months into mid-April, the Fed mushroomed its balance sheet an insane 115.6% or $4,807b!
Effectively more than doubling the US money supply conjured up vastly-more dollars to chase relatively-less goods and services, bidding up their prices. Monetary inflation is wildly-bullish for gold. During the only other two similar mammoth inflation super-spikes in the 1970s, gold prices nearly tripled during the first before later more than quadrupling in the second! The epic gold-stock gains then were truly life-changing.
And gold-futures speculators’ fears of Fed rate hikes are supremely-irrational. The Fed’s thirteenth hiking cycle of the modern monetary era since 1971 is underway. Gold actually thrived in the previous dozen, averaging hefty 29.2% gains during their exact spans! Fed tightenings are bullish for gold and therefore its miners’ stocks because they are bearish for general stocks, greatly bolstering gold investment demand.
So for hardened contrarians able to buck unreasonable herd fear, this recent big-and-fast gold-stock drawdown is a fantastic buying opportunity. Rather than succumbing to groupthink on this sector, smart traders should consider the major gold miners’ fundamentals and outlook. We just got fresh updates on how they are actually faring operationally and financially in their latest just-finishing Q1’22 earnings season.
For 24 quarters in a row now, I’ve painstakingly analyzed the latest results released by GDX’s 25-largest component stocks. These include the world’s biggest gold miners, which now account for a commanding 87.9% of this ETF’s entire weighting. Digesting hard fundamental results as they are released is essential for cutting through obscuring sentiment fogs. It helps traders rationally understand gold stocks’ real outlook.
This table summarizes the operational and financial highlights from the GDX top 25 during Q1’22. These gold miners’ stock symbols aren’t all US listings, and are preceded by their rankings changes within GDX over this past year. The shuffling in their ETF weightings reflects shifting market caps, which reveal both outperformers and underperformers since Q1’21. Those symbols are followed by their current GDX weightings.
Next comes these gold miners’ Q1’22 production in ounces, along with their year-over-year changes from the comparable Q1’21. Output is the lifeblood of this industry, with investors generally prizing production growth above everything else. After are the costs of wresting that gold from the bowels of the earth in per-ounce terms, both cash costs and all-in sustaining costs. The latter help illuminate miners’ profitability.
That’s followed by a bunch of hard accounting data reported to securities regulators, quarterly revenues, earnings, operating cash flows, and resulting cash treasuries. Blank data fields mean companies hadn’t reported that particular data as of the middle of this week. The annual changes aren’t included if they would be misleading, like comparing negative numbers or data shifting from positive to negative or vice versa.
Last quarter proved solid-to-strong for major gold miners. While the larger ones continue to struggle with depletion which is nothing new, mining-cost rises moderated despite the severe inflationary pressures festering from this profligate Fed’s vast deluge of new money. The resulting higher prevailing gold prices in Q1’22 really boosted implied sector profitability. The gold miners are still making money hand-over-fist!
As long-time readers know, I’m generally not a fan of the major gold miners. After actively speculating in gold stocks and writing popular financial newsletters about that for over two decades, their best gains by far have been won in smaller mid-tier and junior gold miners. I’ll cover their Q1’22 results in next week’s essay on the far-superior GDXJ ETF. The largest gold miners have been dead-weight for many years now.
They’ve mostly proven unable to overcome a crucial operational challenge, seriously retarding their stock-price gains. Operating from such large-scale production bases, the bigger gold miners have long failed to replenish their gold mined. They simply can’t find or purchase big-enough gold deposits to develop into new mines to overcome depletion. That’s why I’d never trade the lion’s share of heavier-weighted GDX stocks.
The best-available global gold supply-and-demand data is published quarterly by the World Gold Council in its awesome Gold Demand Trends reports. The latest covering Q1’22 revealed worldwide gold-mine output climbed a strong 2.6% YoY to 856.5 metric tons, or 27,537k ounces. Yet the GDX top 25’s collective gold production last quarter plunged a steep 8.1% YoY to 7,729k ounces! That’s despite gold surging.
Quarterly average gold prices blasted 4.8% higher to $1,879 between Q1’21 to Q1’22! That’s certainly good incentive to maximize production to take advantage of great gold prices. Last quarter actually saw the second-highest gold prices ever witnessed after Q3’20’s $1,912. Yet the GDX-top-25 output still fell to its lowest levels in at least the last 24 quarters I’ve been advancing this research thread! But that’s a bit skewed.
As of mid-week, South Africa’s Harmony Gold hadn’t yet reported its Q1’22 operational results. This is a major gold miner, a threshold which starts at 250k ounces of quarterly production. Excluding Harmony’s output from the comparable Q1’21 leaves overall GDX-top-25 gold production down a milder 3.7% YoY. That’s still shrinkage though, way worse than overall world gold-mining output growth again running 2.6% YoY.
Generally the only times large major gold miners temporarily enjoy annual production boosts are in the four quarters after they acquire competitors. That has long proved true for the mighty industry behemoths Newmont and Barrick Gold, which dominate GDX at 26.4% of its total weighting! That’s because of their gigantic market capitalizations. Gold-stock mega-mergers are bad, only briefly masking depletion problems.
Together NEM and GOLD produced a massive 2,334k ounces last quarter, which is enormous. But as recently as Q4’19, these same two super-majors collectively mined 3,269k! The only large major seeing great production growth last quarter was Agnico Eagle Mines, with impressive 27.8%-YoY growth to 661k ounces. Yet that’s only because it acquired Kirkland Lake Gold. A year ago those two companies mined 820k!
So the production growth investors prize above everything else is rarely seen in the major gold miners that overwhelmingly account for GDX’s weightings. Smaller mid-tier and junior gold miners have a far-better track record of growing output, which is way-easier with their much-smaller production bases. Just bringing single new smaller gold mines online periodically keeps their outputs generally growing on balance.
Eleven of these GDX-top-25 component stocks qualify as majors, producing 250k+ ounces in Q1’22. Together they command a majority 56.7% of this ETF’s total weightings. Excluding Harmony which again dragged its feet on reporting, the remaining ten true majors saw their total quarterly output fall 5.0% YoY to 6,317k ounces. Unable to even replenish depletion, unfortunately most of the majors aren’t worth owning.
Even if they were, their upside potential is limited by their far-larger market caps. The bigger any stock, the greater the capital inflows necessary to drive it materially higher. Mid-week the true majors averaged hefty $20.3b market caps, compared to just $6.9b for the rest of the GDX top 25. And if Franco-Nevada which is just a wildly-overpriced royalty play is excluded, the latter market caps are even lower averaging $5.2b.
Unit gold-mining costs are generally inversely-proportional to gold-production levels. That’s because gold mines’ total operating costs are largely fixed during planning stages, when designed throughputs for mills that process gold-bearing ores are determined. Their nameplate capacities don’t change quarter-to-quarter, requiring similar levels of infrastructure, equipment, and employees to keep running at full-speed.
So the only real variable driving quarterly gold production is the ore grades fed into the mills. Those vary widely even within individual gold deposits. Richer ores yield more ounces to spread the big fixed costs of mining across, lowering unit costs and boosting profitability. So with the GDX top 25’s output falling last quarter, per-ounce costs should’ve at least risen comparably and likely more given the Fed’s raging inflation.
Cash costs are the classic measure of gold-mining costs, including all cash expenses necessary to mine each ounce of gold. But they are misleading as a true cost measure, excluding the big capital needed to explore for gold deposits and build mines. So cash costs are best viewed as survivability acid-test levels for the major gold miners. They illuminate the minimum gold prices necessary to keep the mines running.
The GDX-top-25 gold miners’ average cash costs shot up 10.1% YoY to $851 per ounce, just shy of their all-time high of $853 in the preceding Q4’21. Hecla Mining proved a wild outlier, reporting eye-popping $1,516 cash costs that skyrocketed 44.1% YoY! Management blamed this on “inflationary cost pressures related to steel, reagents, fuel for mobile equipment, other consumables, and increased contractor costs...”
Excluding Hecla’s extreme, the rest of the GDX top 25 averaged modestly-better $812 cash costs. And while this wasn’t true for Hecla, many of these gold miners are forecasting improving gold outputs as 2022 marches on. That ought to lower average cash costs in coming quarters, with more ounces to bear the fixed costs of mining. But even $851 remains far, far below prevailing gold prices averaging $1,879 in Q1.
All-in sustaining costs are far superior than cash costs, and were introduced by the World Gold Council in June 2013. They add on to cash costs everything else that is necessary to maintain and replenish gold-mining operations at current output tempos. AISCs give a much-better understanding of what it really costs to maintain gold mines as ongoing concerns, and reveal the major gold miners’ true operating profitability.
Surprisingly given their weaker output and the inflationary pressures on gold mining, these GDX-top-25 gold stocks reported a comparatively-mild 6.2%-YoY AISC increase to $1,133 per ounce. That actually was a considerable improvement quarter-on-quarter from Q4’21’s all-time high of $1,188. Nevertheless, this latest quarter proved the 14th in a row seeing average all-in sustaining costs climbing year-over-year.
That’s not necessarily a problem though as long as gold-price gains generally outpace rising costs. That AISC-inflation streak began way back in Q4’18 when they ran $874. Yet back then gold only averaged $1,228 per ounce. While AISCs are now 29.6% higher in this latest quarter, average gold prices fared far better rallying 53.0%! Mining costs naturally trend with gold prices, which impact the economics of gold deposits.
Higher-grade ore bodies usually have lower unit costs to exploit, less waste rock to dig up and process compared to the contained gold. When gold prices are powering higher on balance in secular bulls, the mining companies can target other more-common lower-grade deposits. Those have higher unit costs, but are much easier to find and often develop. So better gold prices gradually reduce average grades of mines.
And Hecla’s crazy-high $1,810 AISCs also skewed the GDX-top-25 average higher in Q1. Excluding that big outlier, the rest of these gold miners averaged $1,094. Interestingly Hecla expects those AISCs to moderate, with full-year-2022 guidance near a $1,525 midpoint. Out of the 16 GDX-top-25 gold miners reporting both Q1’22 AISCs and 2022 forecasts, fully 11 see average full-year AISCs below last quarter’s levels.
And those improvements weren’t trivial, with AISC guidances across this population averaging 7.0% lower than their AISCs last quarter! So major gold miners are mostly forecasting both lower costs and higher production in Q2, Q3, and Q4. That has big potential to really boost the gold miners’ earnings this year, as long as prevailing gold prices remain relatively-high. They certainly should with the Fed’s inflation raging!
Gold-mining earnings are the difference between prevailing gold prices and mining costs. The best sector proxy for gold-mining profitability simply subtracts GDX-top-25 AISCs from quarterly-average gold levels. That proved a pleasant surprise in these latest results, with implied sector earnings actually climbing 2.6% YoY to $746 per ounce in Q1’22 despite 6.2%-higher average AISCs! Those are hefty profits by historical standards.
Way back in Q4’18 when that 14-quarter-old streak of higher AISCs started, major gold miners’ implied unit profits by this measure merely ran $353 per ounce. Last quarter’s impressive $746 is more than double that, and the fourth-highest on record after Q3’20’s $884, Q4’20’s $838, and Q2’21’s $778. So the major gold miners dominating GDX really are making money hand-over-fist with these excellent gold prices.
Amazingly despite gold’s sucked-into-heavy-stock-market-selling drubbing in recent weeks, its average price so far in Q2’22 is still running $1,915! If gold bounces soon as it ought to on extreme gold-futures selling reversing into big proportional buying, this quarter’s average gold level could rival Q3’20’s record high of $1,912. Couple that with lower AISCs on rising output, and gold miners’ earnings could really surge.
So despite recent weeks’ big-and-fast gold-stock plunge that decimated sector sentiment, the major gold miners’ fundamentals remain really strong. That’s also mostly reflected in their hard accounting results, just reported to securities regulators under Generally Accepted Accounting Principles or other countries’ equivalents. The GDX top 25’s total revenues edged up 1.3% YoY to $13.9b despite their lower gold output.
Average gold prices surging 4.8% YoY certainly helped, as did some companies boosting their byproduct outputs of base metals and silver. Despite higher sales, overall bottom-line earnings still plunged 23.1% YoY to just $2,162m. Accounting-earnings data is noisy, skewed both ways by big unusual charges and gains. Major sources include mine impairments and reversals, and gains and losses on asset sales and hedges.
When I wade through gold miners’ quarterly reports, I always look for unusual one-time gains and losses on their income statements. Some larger ones in this latest quarter included Kinross Gold’s huge $671m impairment charge on trying to quickly sell its Russian operations in response to that country’s invasion of Ukraine. Endeavour Mining suffered a big $179m “loss on financial instruments”, which included $130m of hedges.
This company is hedging over half of its remaining forecasted 2022 output around just $1,833 gold, which really irritates investors. They buy gold stocks for leveraged upside exposure to gold, and selling that via hedges robs shareholders in gold-bull environments. Gold-stock management teams should be fired if they hedge anything beyond limited requirements necessary to finance mine expansions and new mine-builds.
Offsetting those unusual losses was an enormous $480m gain Peru’s Buenaventura reported in selling discontinued operations. Net these together, and GDX-top-25 accounting earnings in Q1’22 were closer to $2,532m which is only down 10.0% YoY. The major gold stocks remain relatively-cheap in valuation terms based on classic trailing-twelve-month price-to-earnings ratios, with the GDX top 25 averaging 30.9x.
That’s close to their 24-quarter low of 29.1x seen in Q2’21. Eight of these elite gold miners were trading with cheap P/Es below 20x mid-week, and valuations are trending even lower given the recent heavily-outsized gold-stock selling. Cash flows generated from operations also proved solid last quarter, totaling $4,660m across the GDX top 25 which slumped 8.0% YoY. Their total cash treasuries edged up 0.4% to $20.6b.
That’s the third-highest on record, making for big cash warchests these larger gold miners will use to try and stem their ongoing depletion-driven output shrinkage. While they do expand existing mines and build new ones, most of their growth at major-scale comes from buying entire gold-mining companies outright. The smaller mid-tier and junior gold miners are the prime targets, feeding majors’ insatiable gold-supply pipeline.
If you regularly enjoy my essays, please support our hard work! For decades we’ve published popular weekly and monthly newsletters focused on contrarian speculation and investment. These essays wouldn’t exist without that revenue. Our newsletters draw on my vast experience, knowledge, wisdom, and ongoing research to explain what’s going on in the markets, why, and how to trade them with specific stocks.
That holistic integrated contrarian approach has proven very successful. All 1,296 newsletter stock trades realized since 2001 averaged outstanding +20.0% annualized gains! Today our trading books are full of great fundamentally-superior mid-tier and junior gold and silver miners to ride their uplegs. These stocks have massive room to run, and are great buys after selling off hard. Subscribe today and get smarter and richer!
The bottom line is the major gold miners fared pretty-well fundamentally last quarter. Their long struggle failing to overcome depletion continued, with more production shrinkage like usual. But despite lower output and monetary-inflation pressures, the GDX top 25 still held the line on all-in sustaining costs. Those didn’t climb proportionally with weaker production, helping higher prevailing gold prices really boost earnings.
Gold-mining profitability last quarter was among the highest on record, and ought to improve further as this year marches on. The gold miners are mostly forecasting improving outputs along with lower costs in coming quarters. That is really-bullish for earnings growth with gold prices highly-likely to keep climbing on balance in this raging inflation. The beaten-down gold stocks are far too low to reflect these strong fundamentals!
Read Full Story »»»
DiscoverGold
We haven’t finished this low and subsequent high, and he is talking next low??so many people don’t really know much or they are shorting it.
$GDX The next intermediate term low should happen on May 26 - June 3
By: CyclesFan | May 13, 2022
• You can't say I didn't warn $GDX holders in advance of what's coming. Given the crash I'm updating my forecast. The next intermediate term low should happen on May 26 - June 3 since the short term cycle has ranged 18-23 TD since the January low.

Read Full Story »»»
DiscoverGold
Gold is absolutely floundering after getting pounded by central banks to prop up the dollar. Fed is clueless, doing this makes imports more desirable, screwing GDP. It makes exports too expensive for weaker countries, and it stifles job growth if they rely on exports.
How do I know gold is manipulated, I can see it on the ticker, and everything happening now is good for gold. It should be blasting off, instead it’s floundering.
Serafino Iacono: We are Setting up for a Metals Cycle Unlike Any We Have Ever Seen
23,424 viewsApr 25, 2022
https://www.youtube.com/watch?v=V8zgkAOXkHc
) gold itself is having a tough time, i watch 5 times the volume for buys than sells brings it up $1, while the sell side with 1/5 of the volume brings it down $5. its bizzaro if i didnt know there are forces hammering it in the name of the dollar. but the dollar will die a slow death no matter how they try to revive it. its gonna take time.
Barrick Gold (GOLD) Stock Boasts Perfect Buying Opportunity
By: Schaeffer's Investment Research | May 10, 2022
• The global economic selloff has been a boon for mining stocks
• GOLD just fell to a historically bullish trendline
As gold prices struggle to continue their rise in the midst of a global economic selloff, mining stocks such as Barrick Gold Corp (NYSE:GOLD) have been suffering as well. However, Barrick Gold stock boasts a 13.3% year-to-date lead, and though it recently pulled back from annual highs near the $26 level, data from Schaeffer's Senior Quantitative Analyst Rocky White suggests the stock may be flashing a buy signal as it nears a historically bullish trendline.
Specifically, GOLD recently came within one standard deviation of its 320-day moving average following an extended period above the trendline, defined for this study as having traded north of the moving average 80% of the time in the past two months and in eight of the last 10 trading days. The equity experienced two similar pullbacks within the past three years, which resulted in an average 21-day gain of 22.4%, with both returns positive.

At last check, Barrick Gold stock was marginally lower, off a paltry 0.3% to trade at $21.44. A move higher of similar magnitude would put the stock at $26.25, which is an area the shares have failed to reach since November 2020, and also help GOLD recover ground on its 8.2%, 12-month deficit.
A shift in analyst sentiment could create tailwinds for the equity. At the moment, four of the nine covering brokerages recommend a tepid "hold" rating, leaving the stock open to a round of upgrades.
An unwinding of pessimism in the options pits could send the shares higher as well. This is per the security's 10-day put/call volume ratio at the International Securities Exchange (ISE), Cboe Options Exchange (CBOE), and NASDAQ OMX PHLX (PHLX), which sits in the elevated 82nd percentile of its annual range, suggesting an unusually healthy appetite for bearish bets in the last two weeks.
Options are an attractive route at the moment, per Barrick Gold stock's Schaeffer's Volatility Index (SVI) of 43% that sits in the relatively low 23rd percentile of its annual range. This indicates options traders are pricing in extremely low volatility expectations for the time being. What's more, GOLD ranks high on the Schaeffer's Volatility Scorecard (SVS), with a score of 85 out of 100, meaning the security has consistently realized bigger returns than options traders have priced in.
Read Full Story »»»
DiscoverGold
Gold's Current Cyclical Position
By: Jim Curry | May 8, 2022
Recapping Last week
Last week's trading saw Gold dropping sharply to start the week, with the metal hitting a bottom of 1849.70 - made in Tuesday's session. From there, a sharp rally was seen post-fed, here running up to a Thursday high of 1910.70 - before selling down off the same into early in Friday's session.
Gold Cycles, Short-Term
As mentioned last weekend, it looked like we had a 10 and 20-day cycle trough in place, with Gold spiking up to a recent high of 1921.30. However, this rally did not make it back to the 10 and 20-day moving averages - something which will be seen 85% of the time or better, on the upward phase of these two waves.
The chart below shows the smaller 10-day cycle component:
While the most push up to the 1921 figure (June, 2022 contract) did come within earshot of the 10-day moving average, it fell well short of the higher 20-day moving average. With that, the downward phase of the 20-day cycle is still seen as in force, though it may well have bottomed out at the 1849.70 swing low from last week.
With the above said and noted, if the 20-day cycle did bottom out last week, the ideal path would be for another try at the 20-day moving average in the days ahead. Until proven otherwise, however, that move seems favored to end up as a countertrend affair, against the downward phase of the larger 72-day cycle.
Gold's 72-Day Cycle Still Looking for Low
Since the March 8, 2022 peak of 2083.70, Gold has fallen some 11.2% into the most recent swing low, its largest decline of 2022. With that, the next bottom of significance is expected to come from Gold's 72-day cycle, which is shown again on the chart below:
In terms of time, we are at or into the range where the red (dashed) detrend indicator is projecting the next 72-day cycle to bottom. Having said that, we know that bottoms (or tops) can arrive early - or late - and with that we can't always rely on the detrend's estimate of where this wave is going to trough.
From the comments made in recent articles, in order for the next really good buy trigger to be seen with Gold, I would like to see our 72-day 'oversold' indicator (which moves inversely to price - similar to the VIX, vs. the U.S. stock market) spiking above its upper reference line - which the recent action has now seen.
I would also like to see daily close below our lower 72-day cycle band indicator, with the combination of the above ideally seen on the same trading day. This particular pattern/setup is often seen near key lows with this 72-day cycle.
With the above said and noted, we could see another short-term rally phase for Gold (with the 10 and 20-day cycles), but would have to lean the odds in favor of a lower low still out there for this 72-day component. However, once this 72-day cycle bottom is in place, then the probabilities will favor another sharp rally phase in the months to follow, ideally playing out into mid-Summer of this year.
With our 72-day cycle at or into normal bottoming range, its next low is due to materialize at anytime. With that, Gold needs to take out a key upside 'reversal point' for price - an exact number which we are watching closely in the days ahead, with the precise details noted in our Gold Wave Trader report.
Gold, Mid-Term View
For the mid-term picture, the next rally with the 72-day cycle should take Gold up into the Summer of this year, then to top a larger 310-day cycle that we track, which is shown again on the next chart:
Should a lower low still be out there for our 72-day cycle, then key support looks to be around the 1830's for Gold - which is near our lower (and rising) 310-day cycle channel. This 1830's level (plus or minus) ideally needs to contain the correction phase with that 72-day wave - if higher highs are still out there for the metal into the Summer of this year, with the larger 310-day component. Stay tuned.
Read Full Story »»»
DiscoverGold
Jack Chan: Gold Price Exclusive Update
By: Jack Chan | May 7, 2022

Our proprietary cycle indicator is DOWN.
To public readers of our updates, our cycle indicator is one of the most effective timing tool for traders and investors. It is not perfect, because periodically the market can be more volatile and can result in short term whipsaws. But overall, the cycle indicator provides us with a clear direction how we should be speculating.
Investors
During a major buy signal, investors can accumulate positions by cost averaging at cycle bottoms, ideally when prices are at or near the daily 200ema.
During a major sell signal, investors should be hedged or in cash
Traders
Simply cost average in at cycle bottoms when prices are at or near the daily 200ema; and cost average out at cycle tops when prices are above the daily 50ema.

Gold sector is on a new long term BUY signal, suggesting that the correction since 2020 has been completed.

GLD is on short term sell signal.

GDX is on short-term sell signal.

XGD.to is on short term sell signal.

GDXJ is on short term sell signal
Analysis

Our ratio is on sell signal.

Trend is up for the dollar.

Trend is up for gold stocks.

Trend for gold is up.

The multi year “cup with handle” is in progress.
Summary
Long term – on BUY signal.
Short term – on sell signals.
Gold sector cycle is DOWN.
A correction is in progress.
$$$ We are holding a core position and will be a buyer again at the next cycle bottom.
Read Full Story »»»
DiscoverGold
Can Metals See One More Drop?
By: Avi Gilburt | May 5, 2022
In all honesty, when it comes to silver, I do not have a whole lot of clarity. While I have this potentially counted as a c-wave of a 4th wave as having completed, it really is VERY deep for a 4th wave, even in a diagonal. It would actually be easier if silver got a lower low to reset the count. But, as long as we remain below the resistance, I have no way of viewing us as rallying to complete the leading diagonal.
As you can see from the GDX chart, we have dropped right down to the bottom of the pivot and have begun a rally. I cannot see a CLEAR 5-wave structure off that low, so I am still in a bit of a wait-and-see posture on GDX.
As far as gold, well, I am viewing this as a 4th wave pullback, as you can see from the daily GLD chart. The question is if gold has completed that 4th wave, or if it has one more lower low before it is done. As you can see from the GC chart, we have followed through on that 4th wave bounce I have been outlining over the last two days. And, we have struck the resistance for wave 4. As long as it holds, we can see one more lower low in wave 5 to complete the c-wave of the 4th wave. But, if we break out through that resistance, then wave iv is done, and the next rally phase has likely begun.
So, I still have no reason to take any aggressive long trades. Until I have a clear 5-wave Fib Pinball structure, I do not act aggressively on any chart. The Fib Pinball structure provides me with high confidence in trading, with low-risk, high probability entries and exits. Without that, I am not willing to get aggressive. In the meantime, I still think the market goes much higher, but the question is still a matter of path when it comes to the micro structure. I would imagine this can finally clear up in the coming week or two.
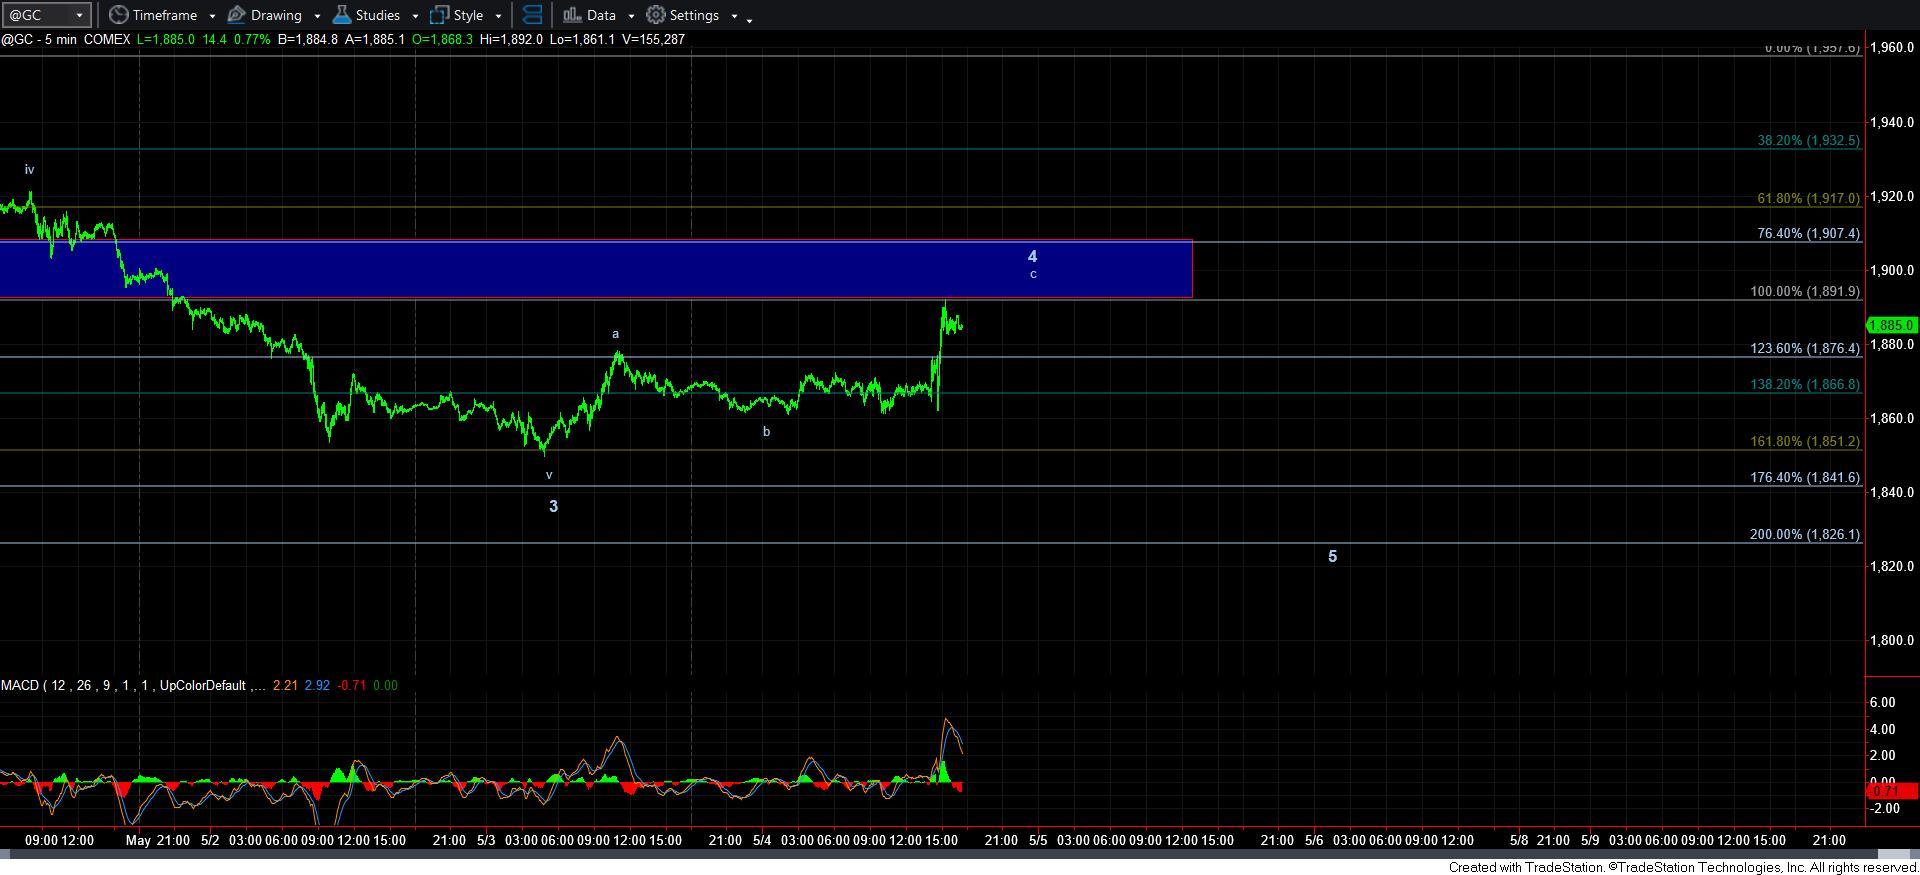
GC5min
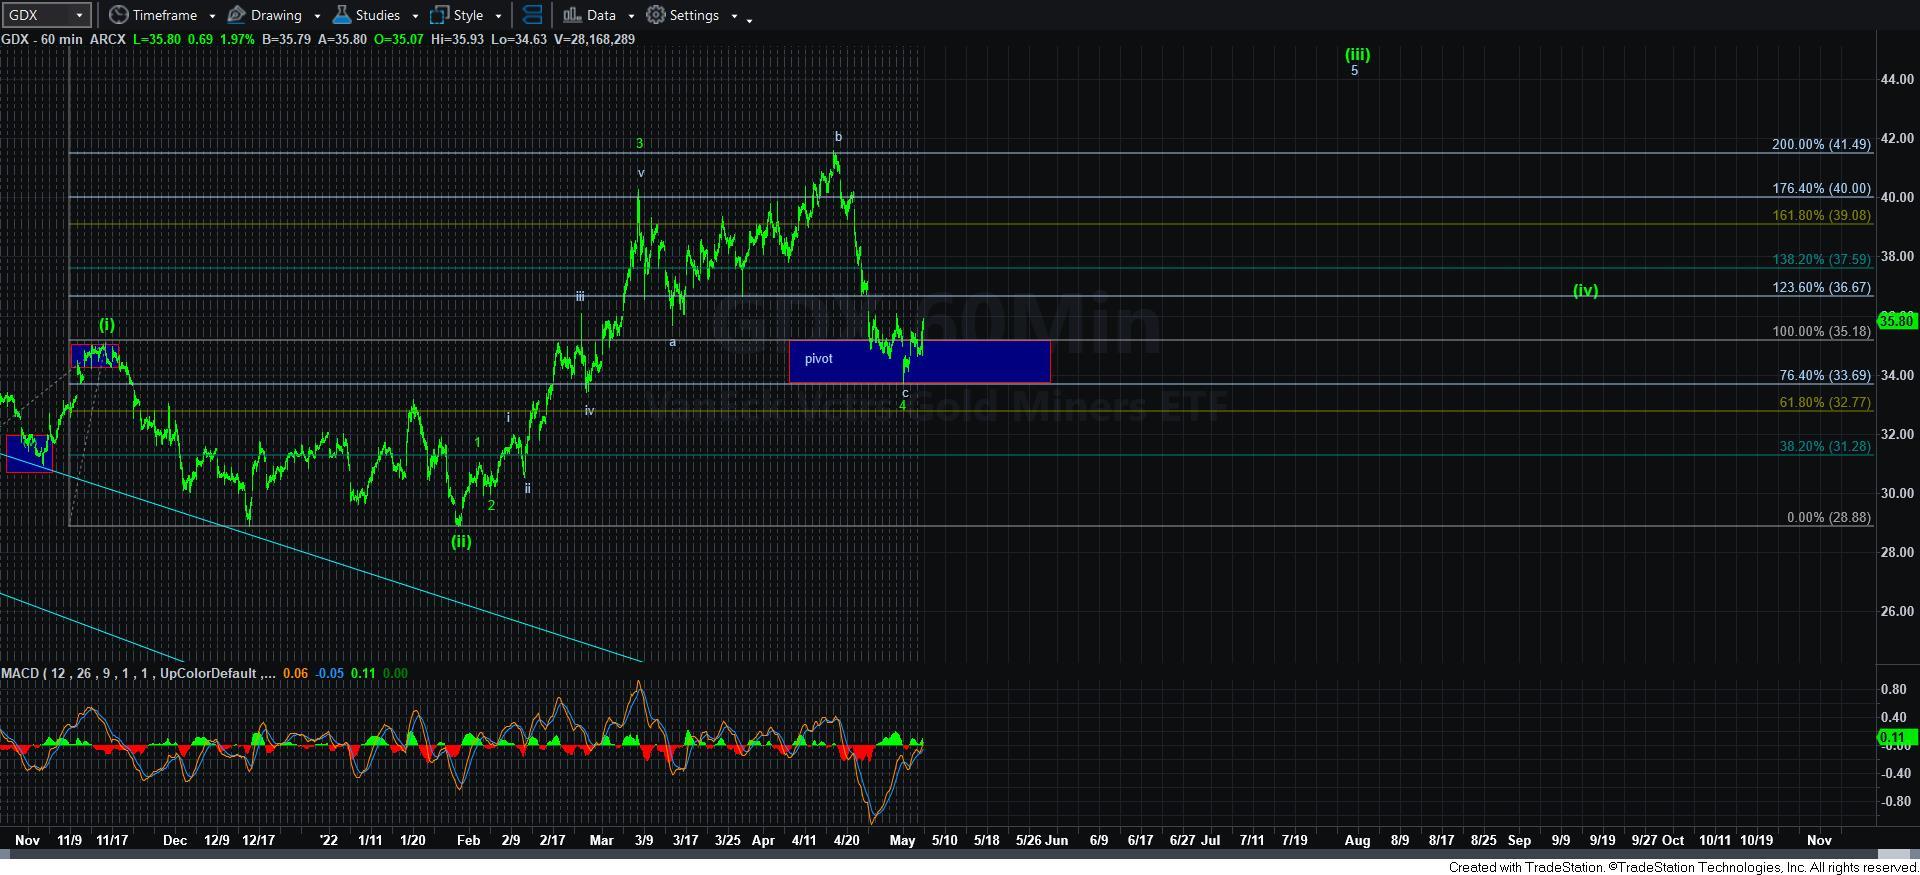
GDX60min
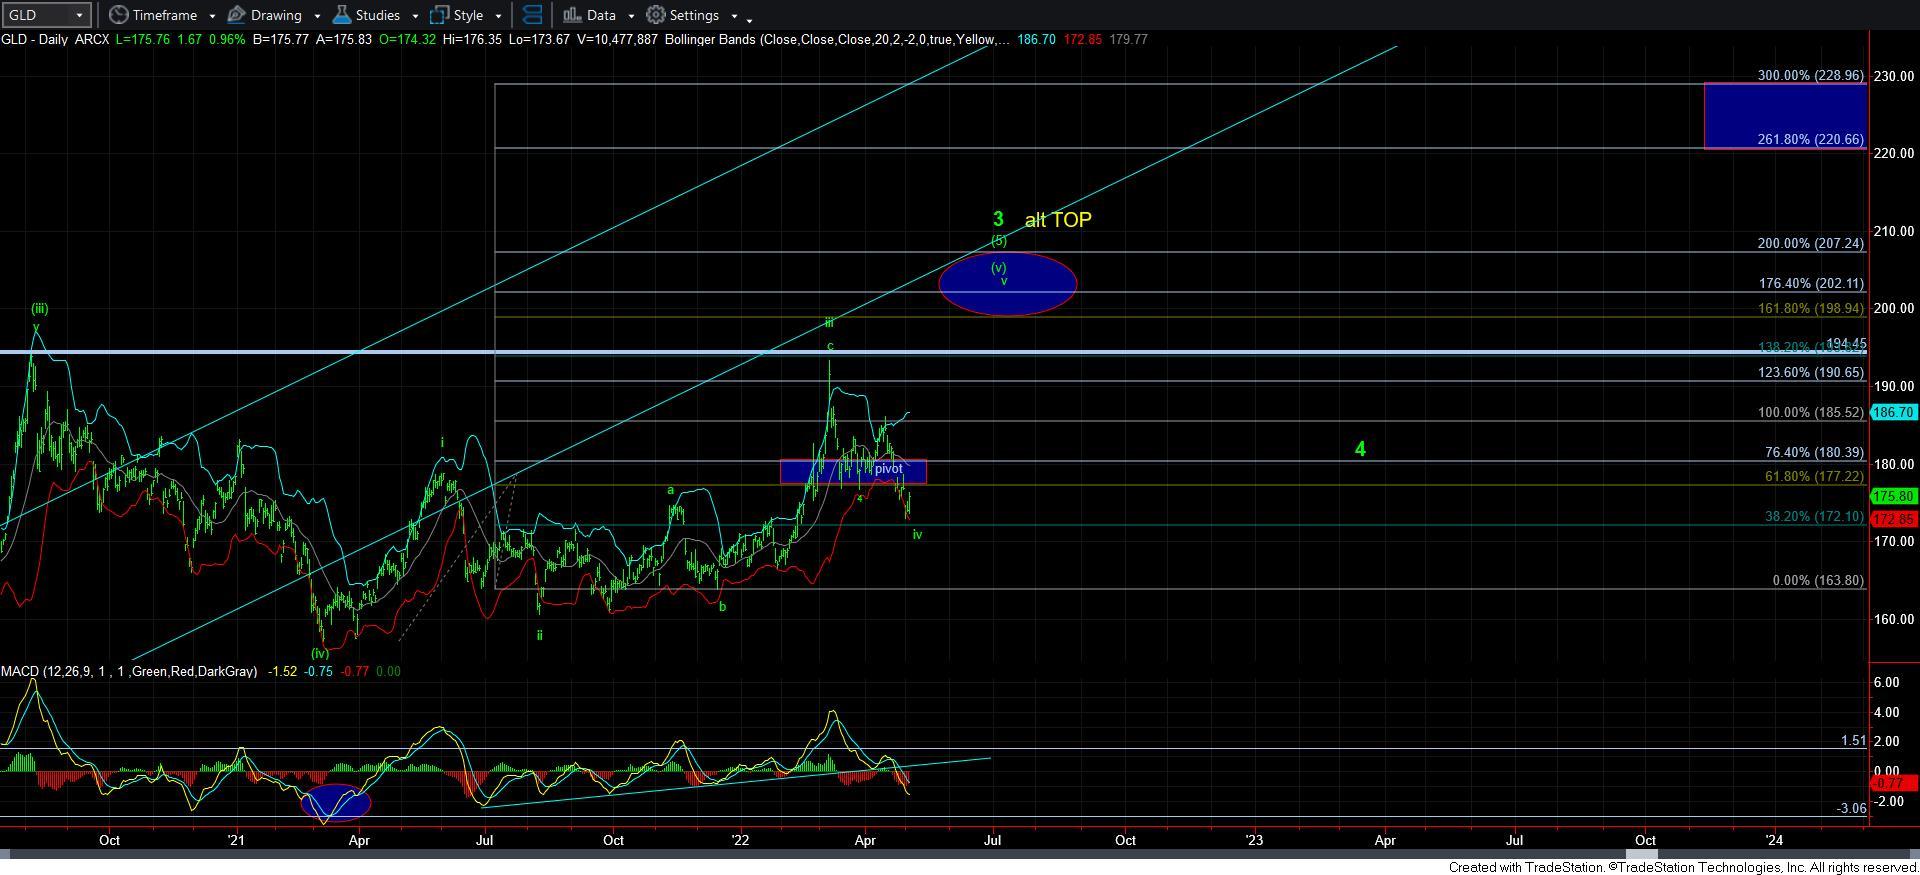
GLDdaily
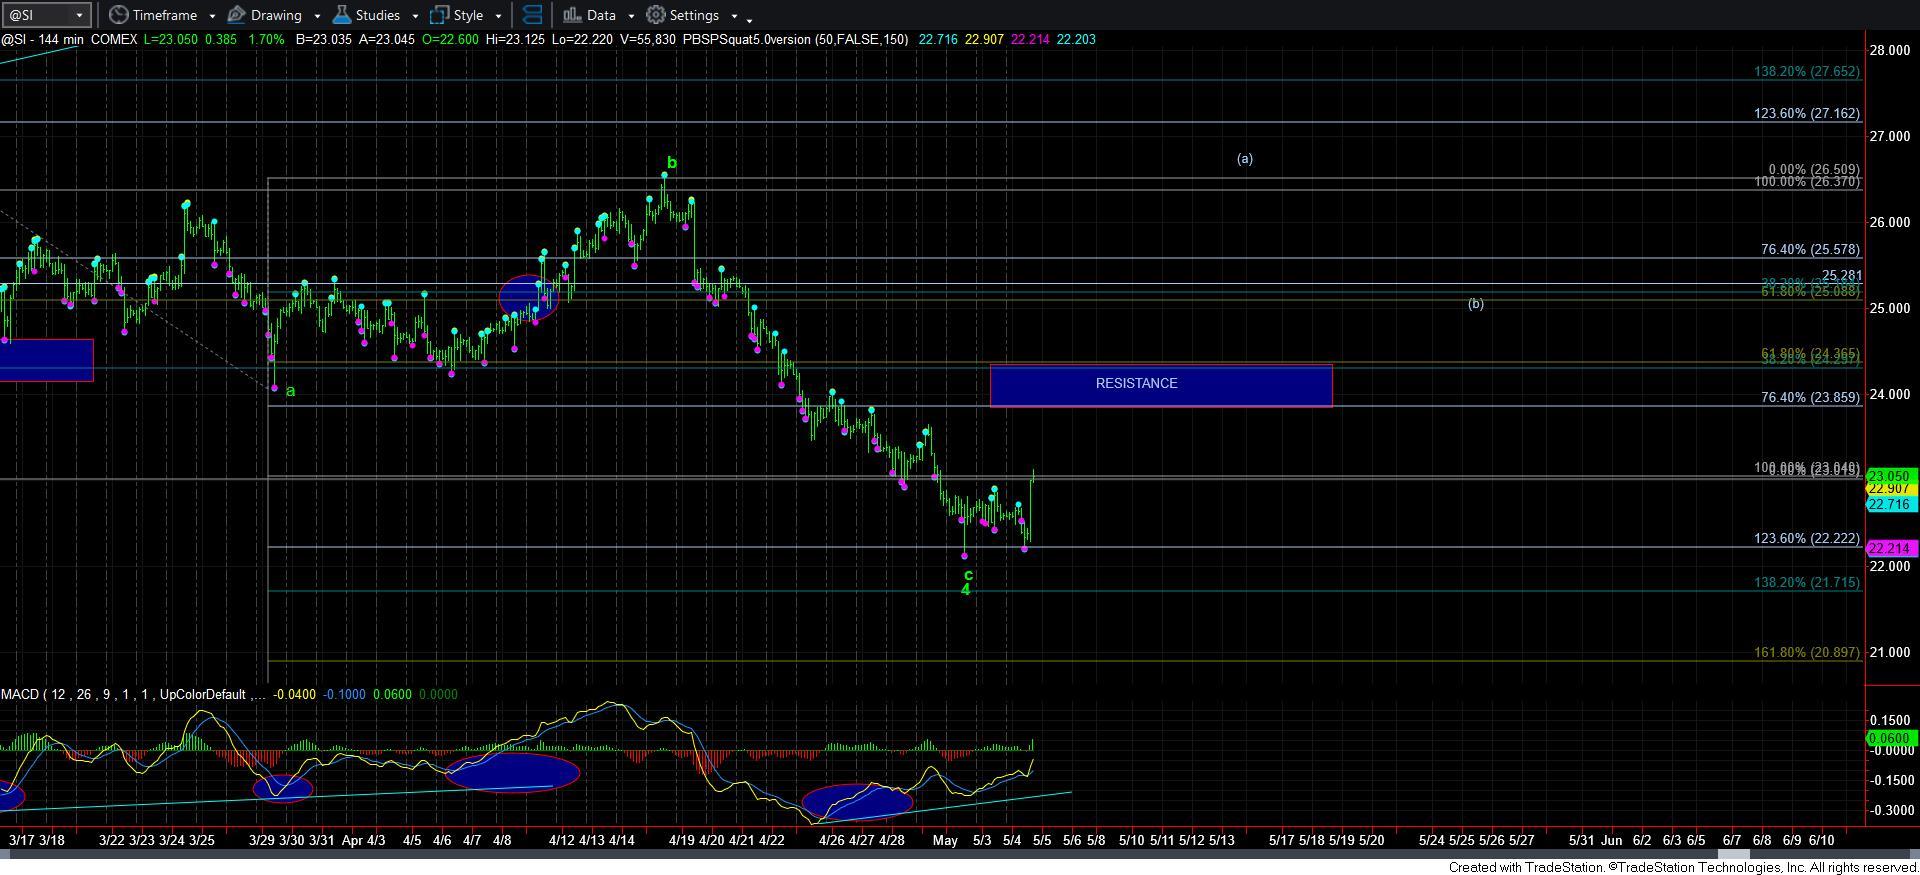
Silver-144min
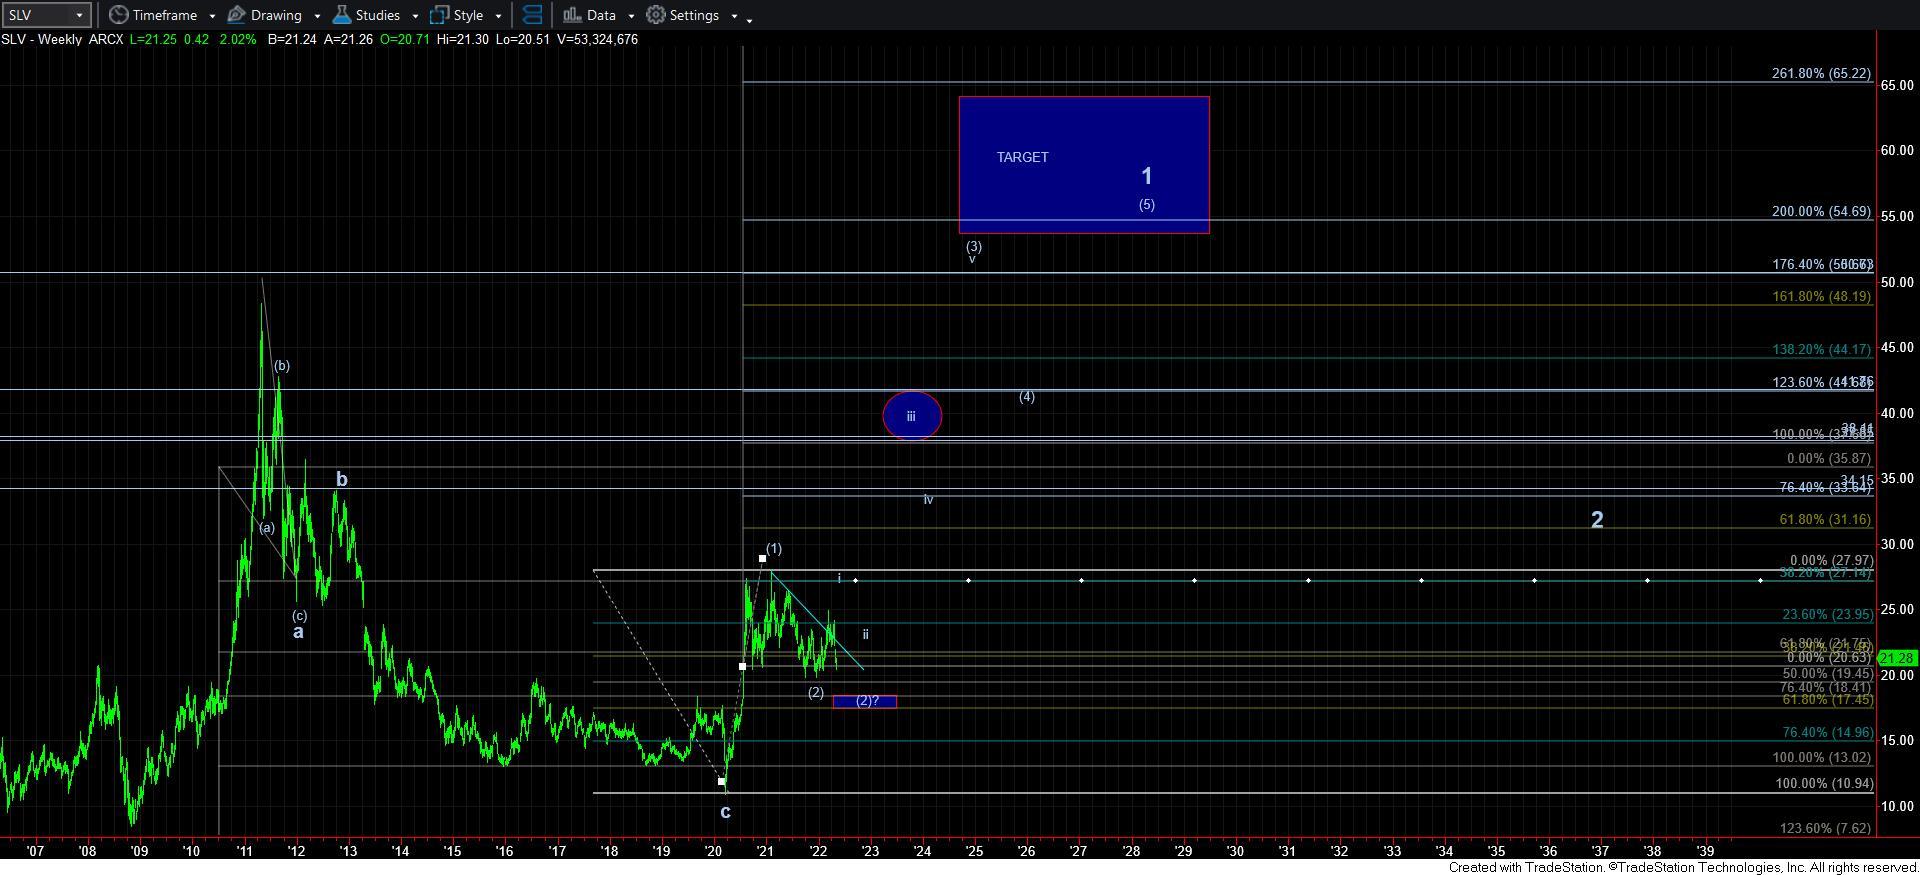
SLVweekly
Read Full Story »»»
DiscoverGold
$GDX probably made a short term low on May 2
By: CyclesFan | May 8, 2022
• $GDX probably made a short term low on May 2 and should bounce to at least the 20 day MA before moving down into the next daily cycle low around mid June: June 13-16.

Read Full Story »»»
DiscoverGold
Gold Tests Support; Stocks Further Abort
By: Mark Mead Baillie | May 8, 2022
With reference back to our 02 April missive entitled "Gold Seeks Support as its Trend Flips Short", price this past Monday and Tuesday finally tested the uppermost area of said 1854-1779 critical support zone; Gold then bounced a bit in settling its weak week yesterday (Friday) at 1883. To wit, the updated graphic of Gold by the day-to-date in 2022. At right you can see the test of the support zone, price's geo-political RUS/UKR "spike and fade" now some two months in arrears:

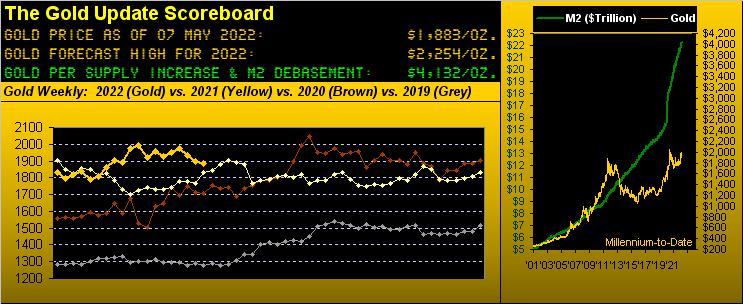
'Course, it remains to be seen if Gold re-tests that support zone, let alone penetrate it more deeply. As stupefying as 'tis to find Gold at such lowly levels given our 4132 opening Scoreboard valuation -- like it or not -- the weekly parabolic trend as below shown remains Short, the rightmost declining red dots now six weeks in duration per our year ago-to-date view. Note the Gold/Silver ratio is up to 84.2x, nearly a 22-month high:

And it can be said -- as much as we oft put forth that Gold plays no currency favourites -- the Almighty Dollar by its Index just recorded a high (104.105) not seen in nearly 20 years (since 23 December 2002). The first occurrence of Gold reaching today's 1883 level was on 22 August 2011, "The Dixie" that day settling at 74.250; yet too, (by "M2"), there are 2.4x as many Dollars out there now as there were then. Clearly a "Federal Reserve Note" is worth more than a Gold anything. (By the way, we've a bridge for sale, if you're interested). "Got Gold?"
Sharing this week's title of course are stocks, which as measured from the S&P 500's 04 January all-time high of 4819 have since corrected -14% in settling the week at 4123. You regular readers know we're anticipating the S&P's correction this year to reach down into the 3587-3198 structural support zone: that begins -13% below present price.
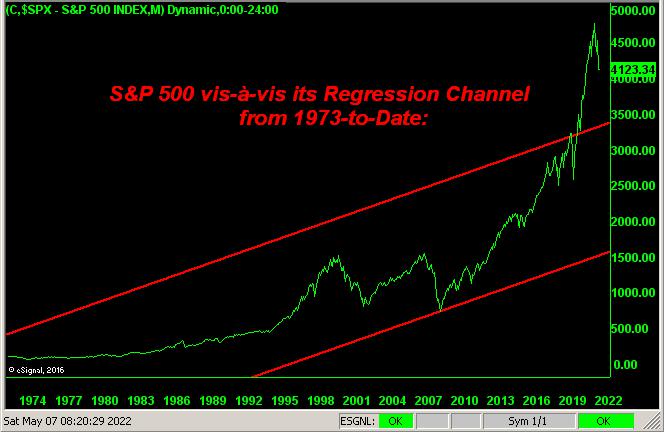
But wait, there's more: in the spirit of the long-running 1950s TV series "You Asked For It" --[DuMont Television Network], now back by popular readership demand we've updated the following two daunting S&P graphics, both as last herein presented on 04 September 2021 ("Own Gold with Reason into S&P Crash Season") in anticipation of it all going wrong, which obviously it now rightly is.
• First for the past 50 years-to-date, we've the S&P's regression channel vis-à-vis the Index's monthly closing prices, provisionally including yesterday's settle at 4123 for May. The current level of the upper channel line is 3325; that is -19% below present price:
• Second for the entire lifetime of the S&P 500 (i.e. from March 1957-to-date) we've the evolving mean (red line) of the "live" price/earnings ratio (green line) right up through yesterday's settle at 32.3x. Obviously as you can see, the P/E has always returned to its mean, (today 22.3x); that is -45% below the present P/E:

'Course, as stodgy as is Q1 Earnings Season (413 of the S&P's 504 constituents having thus far reported) with a full third having not bettered their bottom lines from COVID-infused Q1 of 2021, the median year-over-year increase of the 399 constituents having reported positive earnings in both Q1s is +9.7%. But clearly that's not been good enough to move the P/E needle back down to normality, (although by the graphic it looks well en route toward getting there as is its historical wont).
Indeed for those of you scoring at home, if we arbitrarily assign a median year-over-year earnings increase of +10%, at today's S&P level of 4123, that only lowers the P/E to 29.4x. Thus to meet today's mean of 22.3x, the S&P need drop to 2843, well below our aforementioned 3587-3198 structural support zone. (Too much math perhaps, but with the summer BBQ season soon setting in, you'll need to be able to expound upon all this to keep your neighbours in awe). Have a great day.
Further -- albeit hardly aiding the state of earnings going forward -- is the Federal Reserve's seemingly adamant stance to continue interest rate increases, even as REAL Gross Domestic Product has shrunk for three consecutive quarters, (see the scary graphical depiction in last week's missive "Gold's Lower Grind and the Fed's REAL Bind").
Moreover, 'twas a bum week for the Economic Barometer. Of the 14 incoming Econ Baro metrics, only three improved. And March's Consumer Credit hit its highest level for the 25 years we've been recording data, even as American's are "quitting" their jobs in droves. That is not good. And how about Q1's Productivity declining -7.5% --- with Unit Labor Costs rising +11.6% --- OUCH! Here's the Baro:
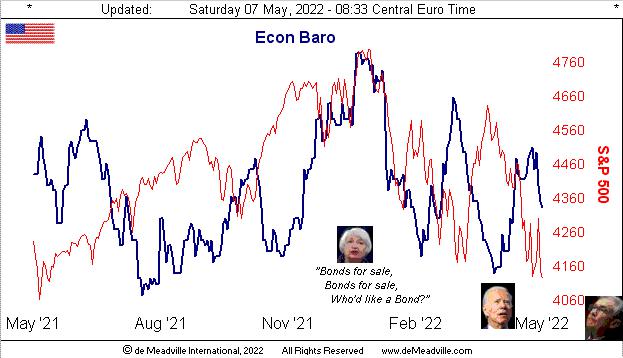
"But mmb, why work when you can sit home and day trade..."
Again, Squire, that is the quintessential sign of a market top!
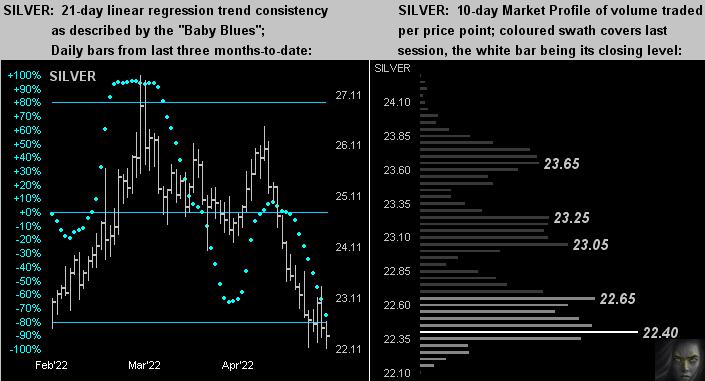
'Course, far from its top (2089) -- let alone its valuation level (4132) -- is Gold as we next see on the left in the three-month panel of daily bars, the baby blue dots of trend consistency in full cascade. Whereas on the right in Gold's 10-day Market Profile, price at least made some headway from the low (1850) traded earlier in the week:
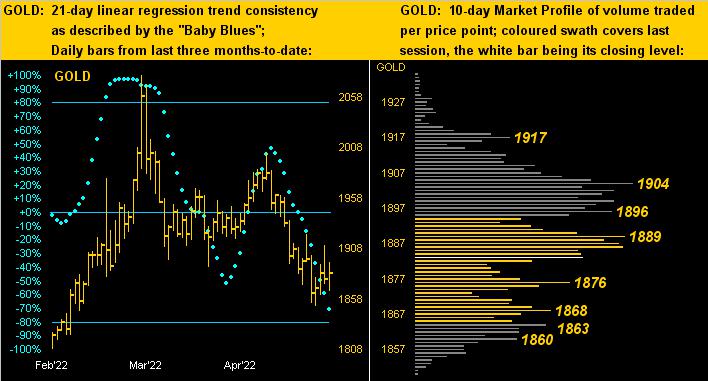
Silver naturally hasn't had nearly the respect accorded Gold (the Gold/Silver ratio earlier noted). Friday saw price hits its lowest level (22.11) in three full months per the rightmost bar below left, whilst in the Profile below right, 'tis still the basement for poor ole Sister Silver:
Peeking ahead at next week's Econ Baro gathering of 10 incoming metrics, there's a bit of further down-side bias based upon "consensus" versus "prior period". Inflation data highlights the week with that at the Retail level on Wednesday, then that for the Wholesale level come Thursday. And some highlighted upside Gold grind against stocks' decline would be most welcome!
Read Full Story »»»
DiscoverGold
COT - Commitments of Traders in Metals Futures Market Reports
By: Software North | May 6, 2022
Gold
Silver
Read Full Story »»»
DiscoverGold
Gold Miners: An Intense Rally Now?
By: Morris Hubbartt | May 7, 2022


SG60 Key Charts, Signals, & Video Analysis


Once the jobs report smoke clears, I’m expecting a possible rally in growth stocks and crypto, but our main positioning is commodities and the gold and silver miners… and here the rally could be huge!
SGT Key Charts, Signals, & Video Analysis


SGJ Key Charts, Signals, & Video Analysis


Read Full Story »»»
DiscoverGold
Very soon people will realize gold silver and miners are the best place to be.
The Ord Oracle: GDX Update
By: Tim Ord | May 4, 2022
SPX Monitoring Purposes: Long SPX on 3/25/22 at 4543.06.
Monitoring Purposes GOLD: Long GDX on 10/9/20 at 40.78.
Long Term SPX Monitor Purposes: Neutral.

We updated this chart from past reports, which is the monthly Inflation/Deflation ratio. We pointed out earlier this year that the monthly Bollinger bands are pinching on this ratio, suggesting a large move is nearing. Since then, the monthly Bollinger Bands are just starting to expand, suggesting this large move is beginning. Notice also that the ratio has closed above its trend line, connecting the high going back to 2016, which is a breakout. The top window is the RSI for this ratio, which is above 50, showing this ratio is in an uptrend. Another bullish factor is that the ratio is above its mid-monthly Bollinger Band. The monthly chart remains bullish and, according to the studies on this page, the rally is in the early stages of a bullish move.
Tim Ord,
Editor
Read Full Story »»»
DiscoverGold
$GDX Daily. #GDX big day tomorrow w/ #FOMC
By: ReciKnows | May 4, 2022
• $GDX Daily. #GDX big day tomorrow w/ #FOMC.

Read Full Story »»»
DiscoverGold
David Lin of Kitco, and his boss lovely Michele, 2 very smart people, do interviews of some of the top financial people and corporate CEOs in north america, very smart people getting other very smart people to give their opinions of the metals sector, gold and silver and the economy
About 4 out of 5 of their guests say america is gonna get whacked to pieces, clevered in two with a machete, over the next year or so. Guest after guest. And most say gold and silver will also get smashed to hades.
It is time to close the stock account, sit on the sidelines, and wait.
Earnings Previews: Barrick Gold Corp. (NYSE: GOLD)
By: 24/7 Wall St. | May 3, 2022
• Here is a look at four companies set to report results on Wednesday or Thursday.
Barrick Gold
Over the past 12 months, the price of gold has increased by about 3.8%. Barrick Gold Corp. (NYSE: GOLD) has seen its share price rise by about 8.2% over the same period. Barrick reports quarterly results before Wednesday’s opening bell.
The current geopolitical tensions pushed gold futures to a high in early March of around $2,000 and Barrick stock to a 52-week high at the same time. A strong dollar, a 10-year Treasury note carrying a 3% interest rate and an expected federal interest rate hike on Wednesday have combined to weigh on the price of gold in the past few weeks. Unlike the dollar and U.S. Treasuries, gold is a non-yielding asset that raises the opportunity cost of holding the yellow metal instead of dollars or Treasury notes.
Analysts remain bullish on Barrick stock, with 19 of 25 brokerages having a Buy or Strong Buy rating while the rest have a Hold rating. At a share price of around $22.20, the upside potential based on a median price target of $28 is about 26.1%. At the high price target of $31.75, the upside potential is 43%.
First-quarter revenue is forecast at $2.78 billion, down 15.9% sequentially and about 6.1% lower year over year. Adjusted EPS are forecast at $0.24, down 31.8% sequentially and down 17.2% year over year. For full fiscal 2022, estimates call for EPS of $1.15, down 0.6%, on sales of $12.05 billion, down 0.5%.
Barrick stock trades at 19.2 times expected 2022 earnings, 17.8 times estimated 2023 earnings of $1.24 and 18.2 times estimated 2024 earnings of $1.22 per share. The stock’s 52-week range is $17.27 to $26.07. Barrick pays an annual dividend of $0.37 (yield of 3.57%). Total shareholder return for the past year was 8.2%.
Read Full Story »»»
DiscoverGold
just finished taking a serious volume profit. Had a nice bounce from yesterday. I think tomorrow Jay Powell hits gold hard. guessing.
the first gap down was at 41, the second at 38, the third at 37, and then the 4th which was today, at 35. It's all here. I think this is a very safe entry, or rather, today was, at least for now...
we just saw an exhaustion early Monday morning freak out, with the fed meeting this Wednesday. It is all here, on the standard six month chart of the gdx.
I calculate 4 gap downs in gdx in the past several weeks, an unheard of thing, but it can happen....things go to excess on the upside too....still, my rule is often to buy the 3rd gap down....so today I bought the 4th one.....who knows.
it is possible that GDX is now at a bottom, a major bottom. It is likely, who really knows, nobody can pick a bottom but the gold price has pealed off 130 bucks in a month. Who really knows. provided gold stays above 1850, the companies in the gdx index will be making gobs of money.
been buying heavy here the last hour and a half, and it is rising. I think the gold stocks and gold itself is over done. Probably making a mistake....time will tell.
Agree Agree Agree!!!!!
Hate to rain on the rain on the futures short party, ISM and construction is ugly, it’s all too clear metals are the only value, period. Last warning, she is ready to blow.
Buy all u can right here, not only are the analyst clowns out in force, they don’t have a clue that gold is technically and fundamentally way below where it should be. Futures shorts are the only down pressure all else is up.
Strong price pressure on gold, silver amid bearish "outside" forces
By: Jim Wyckoff | May 2, 2022
Gold and silver prices are sharply lower in early U.S. Trading Monday, with both notching around 2.5-month lows. The precious metals are getting hit early this week by the bearish outside market forces of a strong U.S. dollar index that is near a 20-year high, solidly lower U.S. crude oil prices and higher U.S. Treasury yields. June gold futures were last down $36.50 at $1,874.70 and May Comex silver was last down $0.40 at $22.66 an ounce.
Global stock markets were mostly lower overnight. Markets in China and Hong Kong were closed for a holiday. U.S. stock indexes are pointed toward lower openings when the New York day session begins. The U.S. stock indexes are extending April’s losses, which were the worst since the beginning of the pandemic.
Three major elements in the marketplace remain static but still prompting risk aversion among traders and investors: the Russia-Ukraine war, the Covid outbreak in China and problematic inflation around the globe.
China’s strict lockdowns to curb Covid-19 cases are taking a toll on the world’s second-largest economy and further disrupting global supply chains. China President Xi Jinping is under pressure to deliver on pledges to support economic growth. China’s manufacturing and services purchasing managers indexes (PMI)in April plunged to their worst levels since February of 2020.
The economic data point of the week in the U.S. Federal Reserve Open Market Committee (FOMC) meeting that begins Tuesday morning and ends Wednesday afternoon with a statement. It’s widely believed the Fed will raise the key U.S. interest rate by 0.5%, amid the highest inflation levels in 40 years. The monthly U.S. jobs report is also due out Friday morning.
The key outside markets today sees Nymex crude oil futures prices sharply lower and trading around $100.50 a barrel. The U.S. dollar index is solidly higher today and not far below last week’s 20-year high. The yield on the 10-year U.S. Treasury note is presently fetching 2.942%.
U.S. economic data due for release Monday includes the U.S. manufacturing PMI, the ISM report on business manufacturing, construction spending and the global manufacturing PMI.

Technically, the June gold futures bears have the overall near-term technical advantage. A downtrend line is in place on the daily bar chart. Bulls’ next upside price objective is to produce a close in April futures above solid resistance at $1,935.50. Bears' next near-term downside price objective is pushing futures prices below solid technical support at $1,850.00. First resistance is seen at $1,890.00 and then at $1,900.00. First support is seen at the April low of $1,870.90 and then at $1,860.00. Wyckoff's Market Rating: 4.0

May silver futures bears have the solid overall near-term technical advantage. Prices are trending sharply down on the daily bar chart. Silver bulls' next upside price objective is closing prices above solid technical resistance at $24.00 an ounce. The next downside price objective for the bears is closing prices below solid support at $22.00. First resistance is seen at the overnight high of $22.83 and then at $23.00. Next support is seen at $22.50 and then at $22.25. Wyckoff's Market Rating: 3.0.
Read Full Story »»»
DiscoverGold
Gold Forecast: Gold Working On Key Bottom
By: Jim Curry | May 1, 2022
Recapping Last week
Last week's trading saw Gold once again forming its high in Monday's session, here doing so with the tag of the 1935.50 figure. From there, a sharp decline was seen into Thursday, with the metal dropping all the way down to a low of 1870.90 - before bouncing off the same into Friday's session.
Gold Market, Short-Term
For the very short-term, as mentioned last weekend the next smaller-degree low was due to materialize - and coming from the 10 and 20-day cycles, with the 10-day wave shown again on the chart below:
With the action seen into Thursday/Friday, the probabilities now favor the 10 and 20-day cycles to have bottomed with the decline into the 1870.90 swing low - and with that are heading higher into the new trading week.
In terms of price, due to my rule that a cycle will revert back to a moving average of the same length better than 85% of the time, the odds should favor a rally back to the 10-day moving average, though a push on up to the higher 20-day moving average would be ideal, since the upward phase of the 20-day cycle is also deemed to be in progress.
Gold's Stepped-Back View
From the comments made in past articles, the last peak of significance came from the 72-day cycle for Gold:
From my 3/13/22 article: "With our 72-day 'oversold' indicator spiking below its lower reference line - and price well above the upper 72-day cycle band - this cycle is looking for its next peak to occur at anytime, and may have already formed with last week's tag of the 2078.80 figure. However, that has yet to actually be confirmed - by taking out a key level that we are watching in our Gold Wave Trader report. Once this 72-day wave does top, a decent correction into early-April is expected to play out, one which sees the 72-day moving average and/or lower 72-day cycle band acting as the magnet."
As mentioned back in March, the last key peak was due to materialize, coming from our 72-day time cycle, which is shown again on the chart below:
In terms of time, this 72-day cycle had been projecting weakness into the mid-April timeframe or later. In terms of price - once again following my rule that a cycle will revert back to a moving average of the same length - the favored path called for a drop back to the 72-day moving average and/or the lower 72-day cycle band, each of which has now been achieved with the action into last week.
As mentioned in prior articles, in order to set up the next good buy signal for Gold, I would like to see our 72-day 'oversold' indicator spiking above its upper reference line, in addition to a daily close below our lower 72-day cycle band. Ideally, I would like to see both of these occurring on the same trading day.
With the above said and noted, though we did get a daily close below our 72-day cycle band with the recent action, we have yet to see a spike above the upper 72-day 'oversold' line, something we might expect to see as this 72-day wave troughs.
With our 72-day cycle at or into normal bottoming range, it may well have already seen its anticipated low. However, that is too early to be confirmed, by a key upside reversal number that we are watching - with the precise details always noted in our Gold Wave Trader market report.
Even said, we did take a long position in the GLD into the most recent weakness, with the idea that - whether or not our 72-day wave has already bottomed - a decent short-term rally was set to play out, coming from the aforementioned 10 and 20-day time cycles.
For the mid-term picture, from whatever low that is seen with the 72-day wave, the path is looking for the next upward phase of this cycle to take the metal back above the March highs into the Summer of this year. That move - if seen as expected - should end up topping a larger tracked 310-day cycle, for what is expected to be another good decline phase, playing out into later this year. More as that as we continue to move forward.
Read Full Story »»»
DiscoverGold
GDX At Support - Market Analysis for Apr 28th, 2022
By: Avi Gilburt | April 28, 2022
As you can see from the chart, silver is right at support wherein a=c. We will need to see a rally begin imminently in silver or else we will likely have to move into the alternative count I outlined over the weekend.
As far as GC is concerned, it did not move through the pivot, though it tried many times, and has since found support at the 1.382 extension. It seems to have developed a 5-wave rally off that support this morning. So, as long as it holds the 1.382 extension, I can consider the c-wave as completed. But, clearly, if that breaks, then we likely see the low 1800’s before this downside completes.
As far as GDX is concerned, I really do not have a reliable count, but I am assuming it is at support as well. Although this is a reasonable count, I still do not have a lot of confidence in the structure in GDX.
So, as you can see, we are at support across the complex. Any further weakness below these supports can open the door to a deeper pullback in the coming week or two.

GC5min

GDX60min

Silver-144min
Read Full Story »»»
DiscoverGold
Jack Chan: Gold Price Exclusive Update
By: Jack Chan | April 30, 2022

Our proprietary cycle indicator is DOWN.
To public readers of our updates, our cycle indicator is one of the most effective timing tool for traders and investors. It is not perfect, because periodically the market can be more volatile and can result in short term whipsaws. But overall, the cycle indicator provides us with a clear direction how we should be speculating.
Investors
During a major buy signal, investors can accumulate positions by cost averaging at cycle bottoms, ideally when prices are at or near the daily 200ema.
During a major sell signal, investors should be hedged or in cash.
Traders
Simply cost average in at cycle bottoms when prices are at or near the daily 200ema; and cost average out at cycle tops when prices are above the daily 50ema.

Gold sector is on a new long term BUY signal, suggesting that the correction since 2020 has been completed.
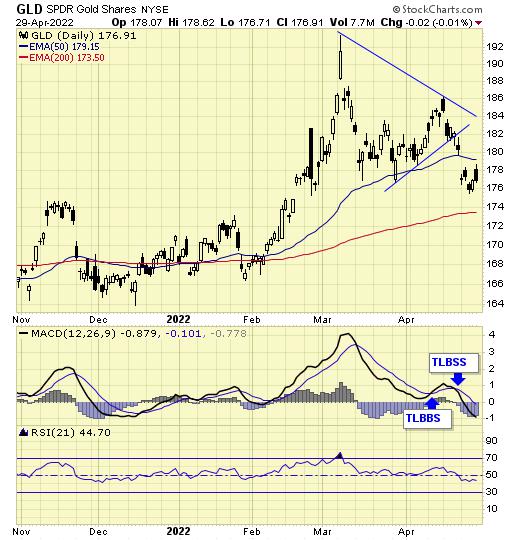
GLD is on short term sell signal.
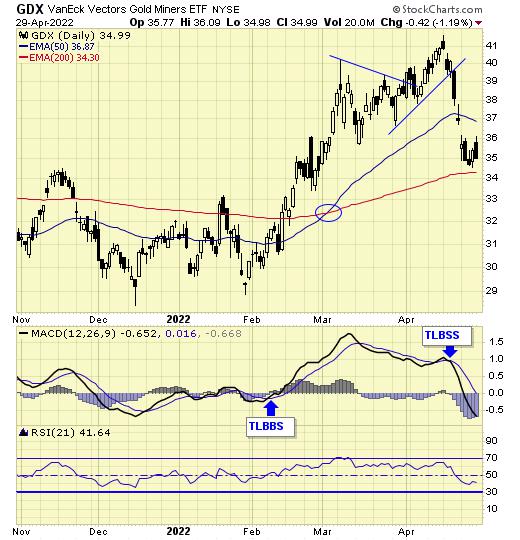
GDX is on short term sell signal.

XGD.to is on short term sell signal.
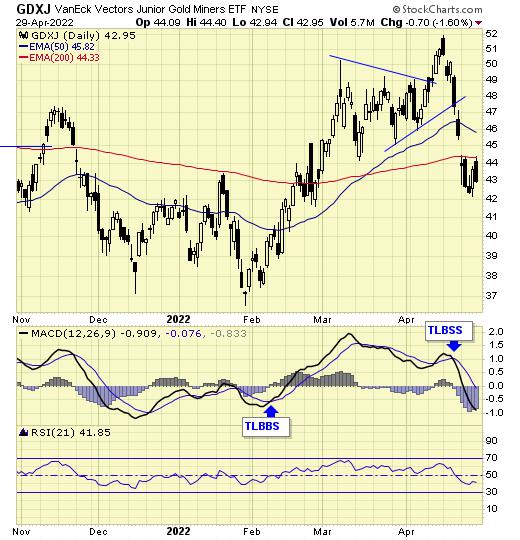
GDXJ is on short term sell signal.
Analysis

Our ratio is on sell signal.
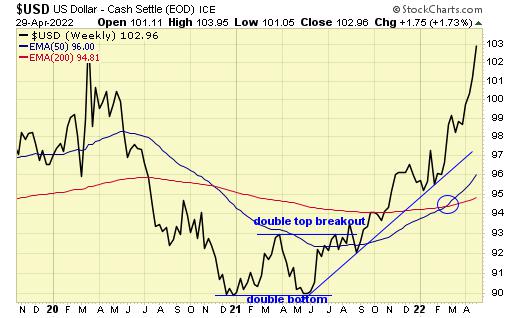
Trend is up for the dollar.
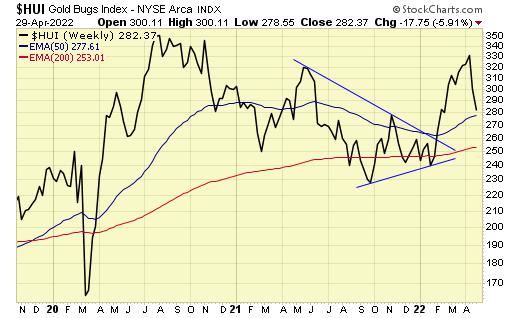
Trend is up for gold stocks.

Trend for gold is up.
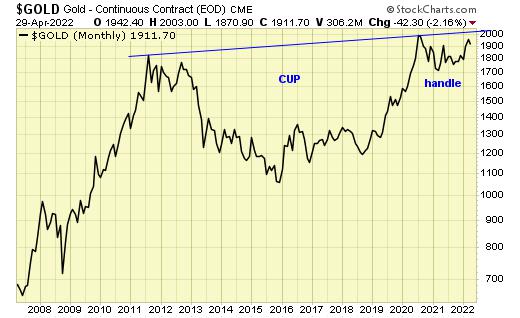
The multi year “cup with handle” is in progress.
Summary
Long term – on BUY signal.
Short term – on sell signals.
Gold sector cycle is DOWN.
A correction is in progress.
$$$ We are holding a core position and will be a buyer again at the next cycle bottom.
Read Full Story »»»
DiscoverGold
NY Gold Futures »» Weekly Summary Analysis
By: Marty Armstrong | April 30, 2022
NY Gold Futures closed today at 191170 and is trading up about 4.54% for the year from last year's settlement of 182860. Caution is now required for this market is starting to suggest it may rally further on a monthly level. Up to now, this market has been rising for 7 months going into April suggesting that this has been a bull market trend on the monthly time level. As we stand right now, this market has made a new low breaking beneath the previous month's low reaching thus far 187090 yet it is trading below last month's close of 195400.
ECONOMIC CONFIDENCE MODEL CORRELATION
Here in NY Gold Futures, we do find that this particular market has correlated with our Economic Confidence Model in the past. The Last turning point on the ECM cycle low to line up with this market was 2015. The Last turning point on the ECM cycle high to line up with this market was 2020 and 2011 and 1996.
MARKET OVERVIEW
NEAR-TERM OUTLOOK
The historical perspective in the NY Gold Futures included a rally from 2015 moving into a major high for 2020, the market has been consolidating since the major high with the last significant reaction low established back in 2015. The market is still holding above last year's low. The last Yearly Reversal to be elected was a Bullish at the close of 2020.
This market remains in a positive position on the weekly to yearly levels of our indicating models.
Solely focusing on only the indicating ranges on the Daily level in the NY Gold Futures, this market remains moderately bearish position at this time with the overhead resistance beginning at 191220 and support forming below at 189630. The market is trading closer to the resistance level at this time. An opening above this level in the next session will imply a bounce is unfolding.
On the weekly level, the last important high was established the week of March 7th at 207880, which was up 30 weeks from the low made back during the week of August 9th. We have been generally trading down for the past week, which has been a very dramatic move of 6.595% in a stark panic type decline.
Looking at this from a broader perspective, this last rally into the week of April 18th reaching 200300 failed to exceed the previous high of 207880 made back during the week of March 7th. That rally amounted to only three typical reaction weeks. Subsequently, the market has breached that low of the week of March 28th but has closed back above it and is holding for now. Right now, the market is below momentum on our weekly models casting a bearish cloud over the price action as well as trend, long-term trend, and cyclical strength. Looking at this from a wider perspective, this market has been trading up for the past 1 week overall.
INTERMEDIATE-TERM OUTLOOK
YEARLY MOMENTUM MODEL INDICATOR
Our Momentum Models are declining at this time with the previous high made 2020 while the last low formed on 2021. However, this market has rallied in price with the last cyclical high formed on 2020 and thus we have a divergence warning that this market is starting to run out of strength on the upside.
Interestingly, the NY Gold Futures has been in a bullish phase for the past 12 months since the low established back in March 2021.
Critical support still underlies this market at 175200 and a break of that level on a monthly closing basis would warn that a sustainable decline ahead becomes possible. Nevertheless, the market is trading below last month's low warning of weakness at this time.
DiscoverGold
my 2 cents: America should be seen collectively as a guy who was 45 years old not all that long ago.
He was named John.
The year was 2007, and housing -- like today -- was soaring, people were generally positive, but there was a problem. The 45 year old John had 3 kids and a wife who like the guy himself, could not find a job at all. Part time at a Walmart that was 13 miles away, they had some night time jobs restocking the merchandise, and people from other countries were getting all those jobs, but John was older, he had lived well most of his life. In fact, he lived in a beach neighborhood. Stocking shelves at night was really not his cup of tea.
The kids were young, Fortunately, the year being 2005, he had a house that was worth 1 million dollars. John had a small mortgage of $100,000 on it, and so he went in to see his banker and took a reverse mortgage, of $300,000 grand. The loan request was processed immediately and the 5 of them lived on that new money for 5 years. They kept all of their loans, the original 100 grand mortgage, a car loan and other expenses, -- which they had quit a few of, current. Plus they paid the taxes on the house faithfully. Their lifestyles were good and remember, the value of the house was inflating.
In 2012, with their house inflating, and the kids growing older -- not so tiny any more -- he and his wife went to see their banker again and said hey, our house just keeps going up, but we need another reverse mortgage. The banker said, "I agree, no problem. It would help if either of you were working, but I can still justify this second draw of $300,000 on your house." So the loan was made to the American, his wife and their 3 kids. With that second draw -- which his banker quickly approved -- John serviced the now expanding $600,000 reverse mortgage total, along with their other loans, and he also paid the real taxes so everything was pretty much ok. The family lived off the new bank draw quite nicely, all things considered.
In 2018, John went back (without his wife this time!) to his banker, and said:
"I am gonna need another loan, this time it will have to be $400,000 -- my kids are getting more expensive, the taxes on my house keep going higher, they go up it seems 15% every year, so too all my insurances, -- but my house thank god is worth so much these days! I had it appraised. The appraisal (he showed the banker a copy) came back at 1.4 million. When you approve this new loan, I will still have plenty of "equity." There will be just 1.1 million in total debt. I will still have 3 or 400 thousand dollars in additional 'equity.'"
The man's banker paused and said "you know, this would be a lot easier if you or your wife were working."
The man replied, "I know I know that but America has shipped out 60,000 factories to other countries the past 40 years. The TV news channels and government issued bulletins make no sense if you ask me.
"While CNBC and the government employees say there are a lot of jobs, the only thing I can get is a part time job down the street at the McDonalds. I will have to work with a bunch of kids. Even the smaller businesses have been closing up since the pandemic.. Please I need that loan. A lot of people are getting these loans you know."
The banker said, -- if you can get any sort of job, even this part time job at the McDonalds, I will also include your welfare income from the stimulus checks you got last year $1,200 month. With that I can make this last draw to you. Just show me you got that job, I don't care if pays only 8 grand per year, I will include it with the welfare checks you got last year."
John (listed on the loan application as "the borrower") got the McDonald's job, even though he was much older now, -- no longer 45, and his banker kindly did him a solid, The requested $400,000 draw was made. The man thanked his banker for such kindness, and the family lived on the new money for the next 5 years. Every bill was serviced, the family's living standards did not fall, -- well, only just a little, but everybody in his neighborhood was kind of doing the same thing. Nobody said much. In fact the family lived on the new loan for 6 years although things were very tight.
John and his wife knew the government politicians needed their votes, so they sort of figured, we can vote our politicians out of office if things really get bad. They are not gonna let us and our entire county go bankrupt! They will up our "stimulus" checks each month and we will get by. The entire Country can't go bankrupt."
Just recently this past week, April 26, 2022, John went in to see his banker. The request was the same, for 400,000 dollars. John had a new appraisal for him home, this time it was valued at 1.65 million, so the new loan would give him a total of 1.5 million in total debt. That was still 165 thousand in equity.
But the banker said no. He told john that the bank says that real estate has "peaked," and that because of the economy, the bank is saying that real estate probably won't go up much any longer, and it fact it may even level off. The Banker told John that too many people are in debt now, and real estate cannot just go up and up every year. He said "John, it is almost like a ponzi. Plus interest rates have climbed like crazy the last 6 months. Your payments are already very high, you are just eating through the loans we have been making to you that much faster."
John responded, "Ok Ok I get it, let's just make the loan for 200,000 dollars this time, that will leave plenty of equity. I still have great credit, you know that. We are never ever late on a payment, all of our expenses, but we are never late, we have excellent credit, that ought to be worth something!" But the banker said no, He said his own bosses would not permit any new reverse mortgage loans to John. Under no conditions. He gave John a lot of baloney and excuses. He told john that he already has 1.1 million, that the payments on the adjustable are skyrocketing, and he cannot even squeeze out a mere 100,000 loan.
The banker maintained, "You don't have the income, and for all "the Bank knows" real estate might actually go down somewhat. Plus "Your taxes keep climbing, they are three times what they used to be. All of your family's expenses have gone through the roof." (a direct quote!). "...John we might be going into a severe contraction. Have you seen the stock market lately? It looks bad."
John started to flip out right there in the bank's office, where the customers in the nearby bank teller lines could hear him clean as day, "but everybody is like me" he started to raise his voice and yell..,"this county has 50,000 people like me, probably a lot more."
But still the banker said no. No more loans, there was nothing he could do.
John said, "I never expected this, What are me and my wife gonna do for income, plus my 3 kids? Plus one of them now has a baby herself, and she isn't even working at all? What is the baby gonna do? I am gonna be out of my house without any loan of any sort whatsoever. You gotta give me a loan for chrissakes. What am I gonna do?"
The banker said nothing,
Well actually he said the bank is thinking of stopping its reverse mortgage business. He said the bank is having a lot of customers now being late on their home loans. "We've got people who have quit even paying." He said he might be out of a job himself.
|
Followers
|
150
|
Posters
|
|
|
Posts (Today)
|
3
|
Posts (Total)
|
5618
|
|
Created
|
06/29/08
|
Type
|
Free
|
| Moderators DiscoverGold trunkmonk | |||

http://www.vaneck.com/index.cfm?cat=3192&tkr=GDX&LN=3-02
The Gold Miners ETF seeks to replicate as closely as possible, before fees and expenses, the price and yield performance of the NYSE Arca Gold Miners Index. The Index provides exposure to publicly traded companies worldwide involved primarily in the mining for gold, representing a diversified blend of small-, mid- and large-capitalization stocks. As such, the Fund is subject to the risks of investing in this sector.
| ||||||||||||||||||||||||||||||||||||||||||||||||||||||||||||||||||||||||||||||||||||||||||||||||||||||
| DAILY |
| WEEKLY |
| Volume | |
| Day Range: | |
| Bid Price | |
| Ask Price | |
| Last Trade Time: |


