


| Followers | 679 |
| Posts | 140848 |
| Boards Moderated | 36 |
| Alias Born | 03/10/2004 |
Sunday, May 01, 2022 1:32:52 PM
By: Jim Curry | May 1, 2022
Recapping Last week
Last week's trading saw Gold once again forming its high in Monday's session, here doing so with the tag of the 1935.50 figure. From there, a sharp decline was seen into Thursday, with the metal dropping all the way down to a low of 1870.90 - before bouncing off the same into Friday's session.
Gold Market, Short-Term
For the very short-term, as mentioned last weekend the next smaller-degree low was due to materialize - and coming from the 10 and 20-day cycles, with the 10-day wave shown again on the chart below:
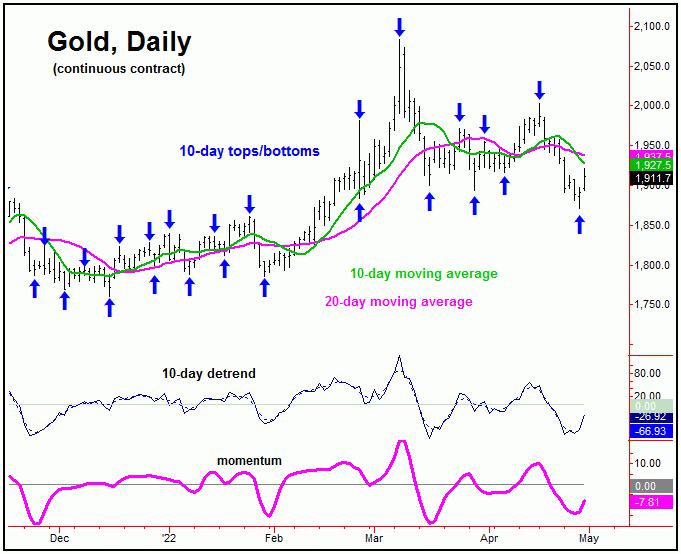
With the action seen into Thursday/Friday, the probabilities now favor the 10 and 20-day cycles to have bottomed with the decline into the 1870.90 swing low - and with that are heading higher into the new trading week.
In terms of price, due to my rule that a cycle will revert back to a moving average of the same length better than 85% of the time, the odds should favor a rally back to the 10-day moving average, though a push on up to the higher 20-day moving average would be ideal, since the upward phase of the 20-day cycle is also deemed to be in progress.
Gold's Stepped-Back View
From the comments made in past articles, the last peak of significance came from the 72-day cycle for Gold:
From my 3/13/22 article: "With our 72-day 'oversold' indicator spiking below its lower reference line - and price well above the upper 72-day cycle band - this cycle is looking for its next peak to occur at anytime, and may have already formed with last week's tag of the 2078.80 figure. However, that has yet to actually be confirmed - by taking out a key level that we are watching in our Gold Wave Trader report. Once this 72-day wave does top, a decent correction into early-April is expected to play out, one which sees the 72-day moving average and/or lower 72-day cycle band acting as the magnet."
As mentioned back in March, the last key peak was due to materialize, coming from our 72-day time cycle, which is shown again on the chart below:
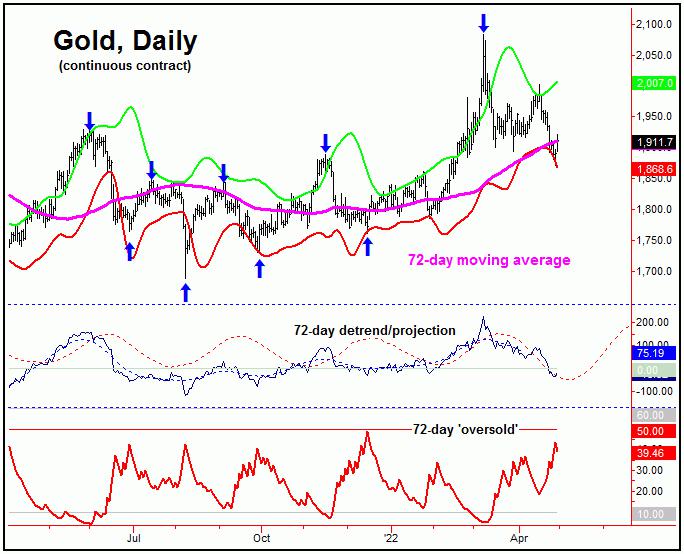
In terms of time, this 72-day cycle had been projecting weakness into the mid-April timeframe or later. In terms of price - once again following my rule that a cycle will revert back to a moving average of the same length - the favored path called for a drop back to the 72-day moving average and/or the lower 72-day cycle band, each of which has now been achieved with the action into last week.
As mentioned in prior articles, in order to set up the next good buy signal for Gold, I would like to see our 72-day 'oversold' indicator spiking above its upper reference line, in addition to a daily close below our lower 72-day cycle band. Ideally, I would like to see both of these occurring on the same trading day.
With the above said and noted, though we did get a daily close below our 72-day cycle band with the recent action, we have yet to see a spike above the upper 72-day 'oversold' line, something we might expect to see as this 72-day wave troughs.
With our 72-day cycle at or into normal bottoming range, it may well have already seen its anticipated low. However, that is too early to be confirmed, by a key upside reversal number that we are watching - with the precise details always noted in our Gold Wave Trader market report.
Even said, we did take a long position in the GLD into the most recent weakness, with the idea that - whether or not our 72-day wave has already bottomed - a decent short-term rally was set to play out, coming from the aforementioned 10 and 20-day time cycles.
For the mid-term picture, from whatever low that is seen with the 72-day wave, the path is looking for the next upward phase of this cycle to take the metal back above the March highs into the Summer of this year. That move - if seen as expected - should end up topping a larger tracked 310-day cycle, for what is expected to be another good decline phase, playing out into later this year. More as that as we continue to move forward.
Read Full Story »»»
 DiscoverGold
Information posted to this board is not meant to suggest any specific action, but to point out the technical signs that can help our readers make their own specific decisions. Caveat emptor!
• DiscoverGold
Recent GDX News
- YieldMax GDXY Name Change • GlobeNewswire Inc. • 01/25/2024 04:22:00 PM
- Surging S&P 500 Breadth • ValueWalk • 07/19/2023 03:16:37 PM
- S&P 500 Corrects In Breadth • ValueWalk • 07/18/2023 03:08:49 PM
- If The USDX Fell So Much, Why Didn’t Gold Truly Soar? • ValueWalk • 07/17/2023 05:16:20 PM
- USD’s Decline That’s… Bearish For Gold?! • ValueWalk • 07/12/2023 02:38:08 PM
- S&P 500 Late Day Reversal Worry • ValueWalk • 07/10/2023 03:17:34 PM
- Massive Gaming Celebrates Global Launch of House of Blackjack with USDC Earning Race • ValueWalk • 07/10/2023 02:44:17 PM
- Breathers In Mining Stocks Are Not Real Rallies • ValueWalk • 07/06/2023 05:20:55 PM
- S&P 500 Character Changes • ValueWalk • 07/06/2023 03:10:06 PM
- S&P 500 – As Bullish As It Gets • ValueWalk • 07/03/2023 04:01:21 PM
- The Great Gold Migration: How Asia Is Dominating The Global Gold Landscape • ValueWalk • 06/30/2023 05:07:35 PM
- S&P 500 Dip Buying And Tame PCE • ValueWalk • 06/30/2023 03:34:13 PM
- The Bullish Reversal In Gold Is Coming • ValueWalk • 06/29/2023 04:00:44 PM
- Insufficient S&P 500 Rotations • ValueWalk • 06/27/2023 02:41:42 PM
- Failing S&P 500 Rotations • ValueWalk • 06/23/2023 03:09:19 PM
- Countdown to S&P 500 Downleg • ValueWalk • 06/19/2023 01:49:20 PM
- Now THAT Was The Game-Changer For The Price Of Gold! • ValueWalk • 06/15/2023 04:40:35 PM
- S&P 500 Manages To Recover Initial Decline • ValueWalk • 06/15/2023 03:30:07 PM
- S&P 500 Manages To Recover From Tech-Driven Decline • ValueWalk • 06/15/2023 03:30:07 PM
- S&P 500 Withstands The Initial Selling – No Hike Tomorrow • ValueWalk • 06/13/2023 03:15:19 PM
- Roadmap For Mining Stocks – Courtesy Of The Stock Market • ValueWalk • 06/06/2023 03:17:49 PM
- Stocks To Still Extend S&P 500 Upswing • ValueWalk • 06/05/2023 03:31:02 PM
- AI, Stocks, And Gold Stocks – Connected After All • ValueWalk • 05/31/2023 03:29:15 PM
- Could Gold Miners Finally Stop Sliding?! • ValueWalk • 05/26/2023 08:42:37 PM
- S&P 500 Fine Selling Initiative • ValueWalk • 05/24/2023 03:06:00 PM
FEATURED Cannabix's Breath Logix Alcohol Device Delivers Positive Impact to Private Monitoring Agency in Montana, USA • Apr 25, 2024 8:52 AM
Bantec Reports an Over 50 Percent Increase in Sales and Profits in Q1 2024 from Q1 2023 • BANT • Apr 25, 2024 10:00 AM
Kona Gold Beverages, Inc. Announces Name Change to NuVibe, Inc. and Initiation of Ticker Symbol Application Process • KGKG • Apr 25, 2024 8:30 AM
Axis Technologies Group and Carbonis Forge Ahead with New Digital Carbon Credit Technology • AXTG • Apr 24, 2024 3:00 AM
North Bay Resources Announces Successful Equipment Test at Bishop Gold Mill, Inyo County, California • NBRI • Apr 23, 2024 9:41 AM
Epazz, Inc.: CryObo, Inc. solar Bitcoin operations will issue tokens • EPAZ • Apr 23, 2024 9:20 AM

