


| Followers | 687 |
| Posts | 142406 |
| Boards Moderated | 35 |
| Alias Born | 03/10/2004 |
Monday, May 09, 2022 8:06:42 AM
By: Jim Curry | May 8, 2022
Recapping Last week
Last week's trading saw Gold dropping sharply to start the week, with the metal hitting a bottom of 1849.70 - made in Tuesday's session. From there, a sharp rally was seen post-fed, here running up to a Thursday high of 1910.70 - before selling down off the same into early in Friday's session.
Gold Cycles, Short-Term
As mentioned last weekend, it looked like we had a 10 and 20-day cycle trough in place, with Gold spiking up to a recent high of 1921.30. However, this rally did not make it back to the 10 and 20-day moving averages - something which will be seen 85% of the time or better, on the upward phase of these two waves.
The chart below shows the smaller 10-day cycle component:
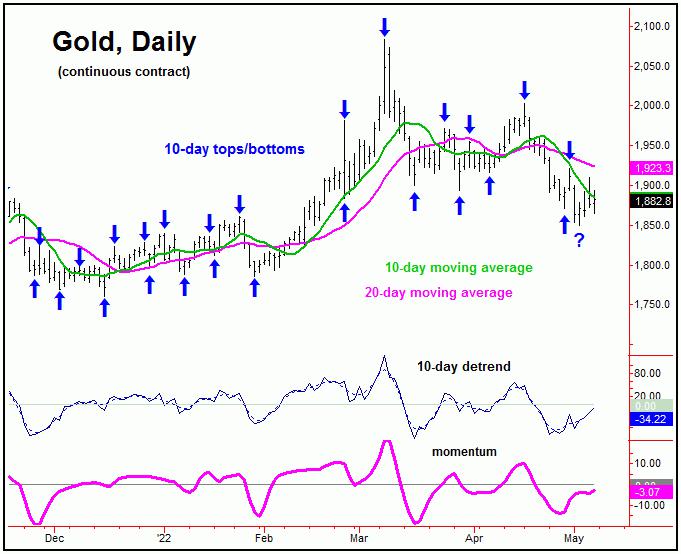
While the most push up to the 1921 figure (June, 2022 contract) did come within earshot of the 10-day moving average, it fell well short of the higher 20-day moving average. With that, the downward phase of the 20-day cycle is still seen as in force, though it may well have bottomed out at the 1849.70 swing low from last week.
With the above said and noted, if the 20-day cycle did bottom out last week, the ideal path would be for another try at the 20-day moving average in the days ahead. Until proven otherwise, however, that move seems favored to end up as a countertrend affair, against the downward phase of the larger 72-day cycle.
Gold's 72-Day Cycle Still Looking for Low
Since the March 8, 2022 peak of 2083.70, Gold has fallen some 11.2% into the most recent swing low, its largest decline of 2022. With that, the next bottom of significance is expected to come from Gold's 72-day cycle, which is shown again on the chart below:
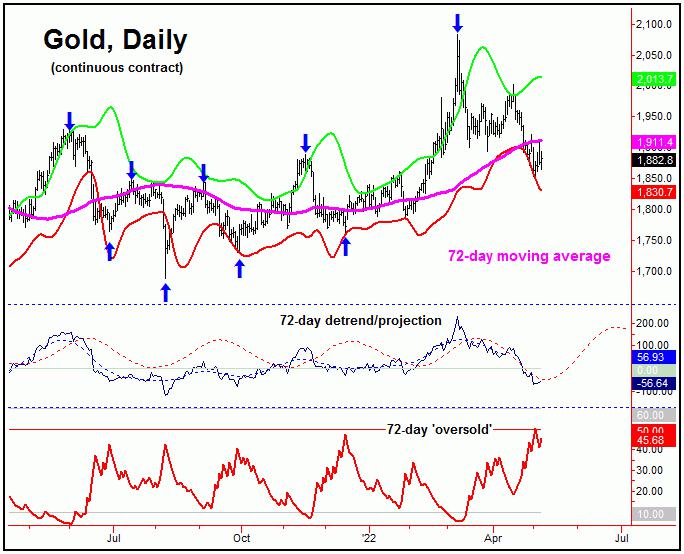
In terms of time, we are at or into the range where the red (dashed) detrend indicator is projecting the next 72-day cycle to bottom. Having said that, we know that bottoms (or tops) can arrive early - or late - and with that we can't always rely on the detrend's estimate of where this wave is going to trough.
From the comments made in recent articles, in order for the next really good buy trigger to be seen with Gold, I would like to see our 72-day 'oversold' indicator (which moves inversely to price - similar to the VIX, vs. the U.S. stock market) spiking above its upper reference line - which the recent action has now seen.
I would also like to see daily close below our lower 72-day cycle band indicator, with the combination of the above ideally seen on the same trading day. This particular pattern/setup is often seen near key lows with this 72-day cycle.
With the above said and noted, we could see another short-term rally phase for Gold (with the 10 and 20-day cycles), but would have to lean the odds in favor of a lower low still out there for this 72-day component. However, once this 72-day cycle bottom is in place, then the probabilities will favor another sharp rally phase in the months to follow, ideally playing out into mid-Summer of this year.
With our 72-day cycle at or into normal bottoming range, its next low is due to materialize at anytime. With that, Gold needs to take out a key upside 'reversal point' for price - an exact number which we are watching closely in the days ahead, with the precise details noted in our Gold Wave Trader report.
Gold, Mid-Term View
For the mid-term picture, the next rally with the 72-day cycle should take Gold up into the Summer of this year, then to top a larger 310-day cycle that we track, which is shown again on the next chart:
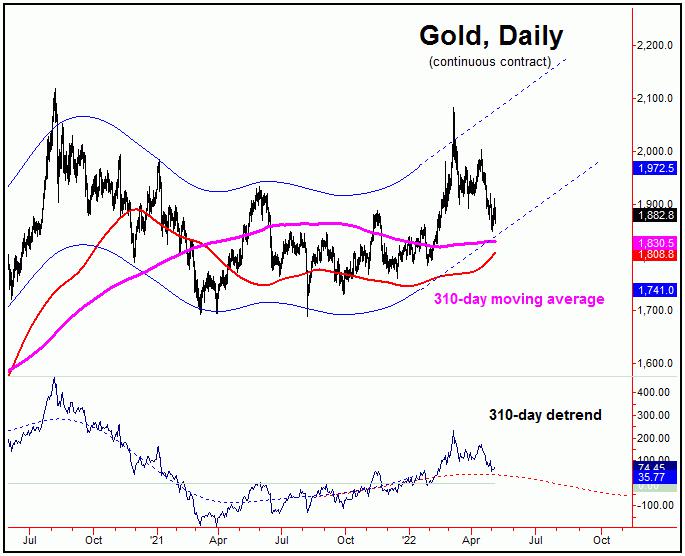
Should a lower low still be out there for our 72-day cycle, then key support looks to be around the 1830's for Gold - which is near our lower (and rising) 310-day cycle channel. This 1830's level (plus or minus) ideally needs to contain the correction phase with that 72-day wave - if higher highs are still out there for the metal into the Summer of this year, with the larger 310-day component. Stay tuned.
Read Full Story »»»
 DiscoverGold
Information posted to this board is not meant to suggest any specific action, but to point out the technical signs that can help our readers make their own specific decisions. Caveat emptor!
• DiscoverGold
Recent GDX News
- YieldMax GDXY Name Change • GlobeNewswire Inc. • 01/25/2024 04:22:00 PM
- Surging S&P 500 Breadth • ValueWalk • 07/19/2023 03:16:37 PM
- S&P 500 Corrects In Breadth • ValueWalk • 07/18/2023 03:08:49 PM
- If The USDX Fell So Much, Why Didn’t Gold Truly Soar? • ValueWalk • 07/17/2023 05:16:20 PM
- USD’s Decline That’s… Bearish For Gold?! • ValueWalk • 07/12/2023 02:38:08 PM
- S&P 500 Late Day Reversal Worry • ValueWalk • 07/10/2023 03:17:34 PM
- Massive Gaming Celebrates Global Launch of House of Blackjack with USDC Earning Race • ValueWalk • 07/10/2023 02:44:17 PM
- Breathers In Mining Stocks Are Not Real Rallies • ValueWalk • 07/06/2023 05:20:55 PM
- S&P 500 Character Changes • ValueWalk • 07/06/2023 03:10:06 PM
Freedom Holdings Corporate Update; Announces Management Has Signed Letter of Intent • FHLD • Jul 3, 2024 9:00 AM
EWRC's 21 Moves Gaming Studios Moves to SONY Pictures Studios and Green Lights Development of a Third Upcoming Game • EWRC • Jul 2, 2024 8:00 AM
BNCM and DELEX Healthcare Group Announce Strategic Merger to Drive Expansion and Growth • BNCM • Jul 2, 2024 7:19 AM
NUBURU Announces Upcoming TV Interview Featuring CEO Brian Knaley on Fox Business, Bloomberg TV, and Newsmax TV as Sponsored Programming • BURU • Jul 1, 2024 1:57 PM
Mass Megawatts Announces $220,500 Debt Cancellation Agreement to Improve Financing and Sales of a New Product to be Announced on July 11 • MMMW • Jun 28, 2024 7:30 AM
VAYK Exited Caribbean Investments for $320,000 Profit • VAYK • Jun 27, 2024 9:00 AM

