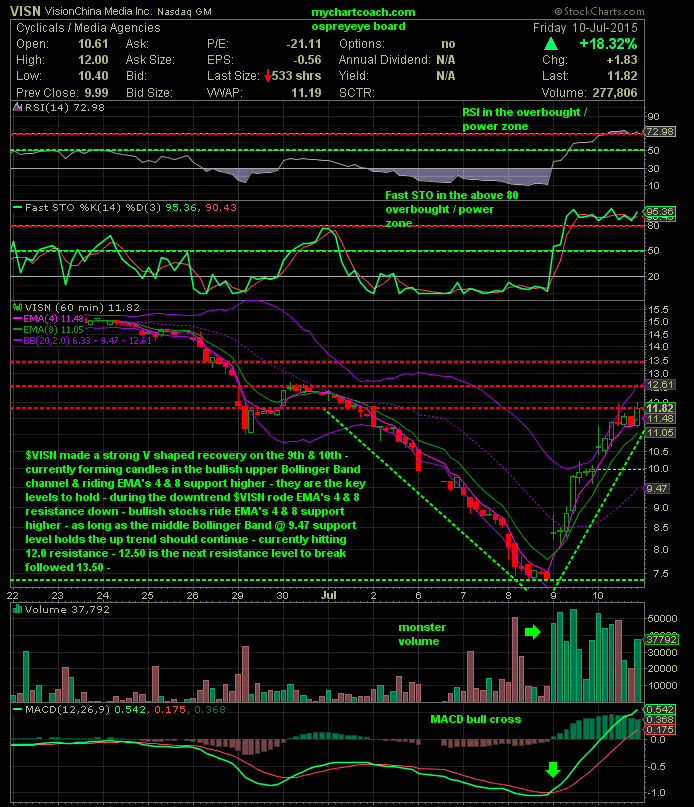
$VISN 60 min. Chart – this is a 60 min. chart – each candle represents 60 min.’s of trading – $VISN made a strong V shaped reversal on the 9th & 10th – the candles have been riding EMA’s 4 & 8 support higher – as this chart shows the candles were riding EMA’s 4 & 8 resistance lower during the downtrend – bullish stocks forming candles in the bullish upper Bollinger Band channel between upper BB resistance & middle BB support while riding EMA’s 4 & 8 support higher – 12.00 is the next resistance level to break –
 Market Data
  Markets