Hi SteveO, I would not go as far as to count them out 8^) Still, upper income households (depending on what you consider to be "upper income") is a small portion of total households. For arguments sake, we will say $100K+ = upper income...
Here is a chart and stats from FY2000 which shows the breakdown of household income:
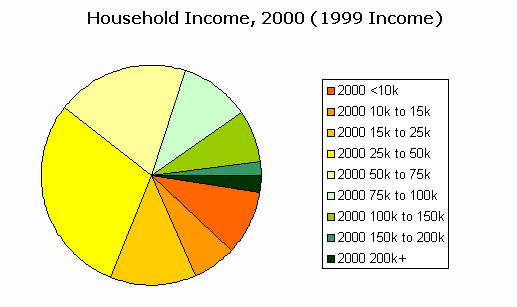
           Household Income, 2000 (1999 Income)
                          Number    % of Total Households
   Total Households    105,539,122       100.00%
 Less than    $9,999    10,067,027         9.54%
 $10,000  -  $14,999     6,657,228         6.31%
 $15,000  -  $24,999    13,536,965        12.83%
 $25,000  -  $34,999    13,519,242        12.81%
 $35,000  -  $49,999    17,446,272        16.53%
 $50,000  -  $74,999    20,540,604        19.46%
 $75,000  -  $99,999    10,799,245        10.23%
 $100,000 - $149,999     8,147,826         7.72%
 $150,000 - $199,999     2,322,038         2.20%
 $200,000 and above      2,502,675         2.37%
$100K+ = approx. 13M of 105M Households or 12.29% of US Total Household Income
Now I know what you might be saying; that this data is from 2000, how about the last 5 years? Well 2001 was a recession, 2002-2003 and 2003-2004 saw no change in real median household income (see link):
US Census Bureau Press Release - 8.30.2005
http://www.census.gov/Press-Release/www/releases/archives/income_wealth/005647.html
Therefore, the argument that I am making is that upper income households could not spend anywhere near the amount that the other 87.71% of US households do, which just so happens to be the middle to lower income classes.
 Market Data
  Markets


