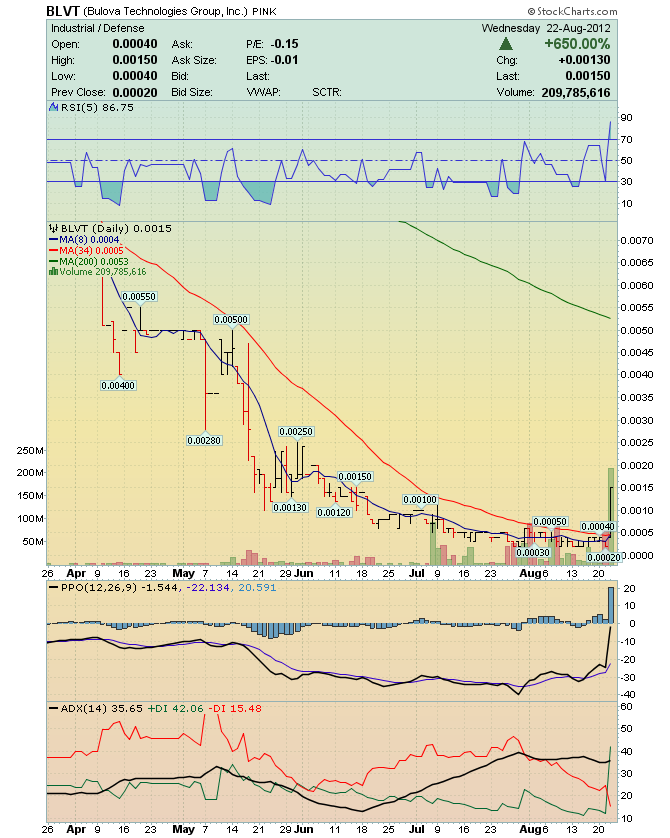
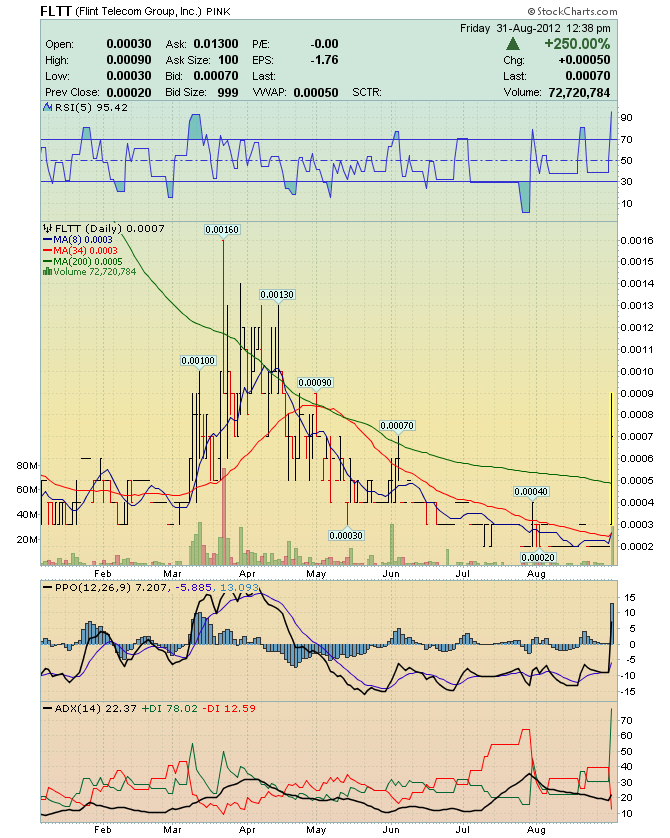
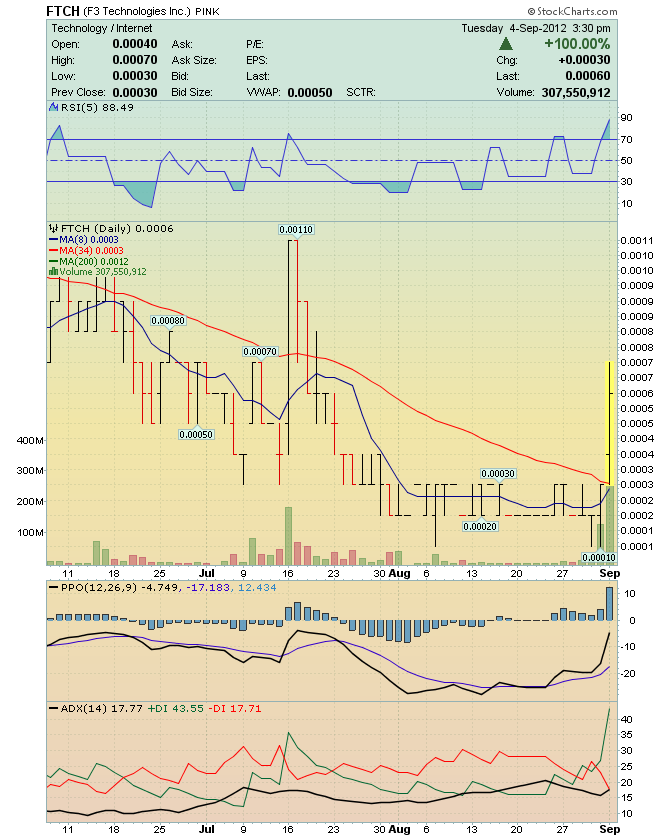
"The Planned Trade" - It's all about finding a "particular stock pattern", that exists in a 3-month "timeframe".
How I find "Winning Stocks that are ready to Buy".
1.) I'm looking for an "Elliott Wave" 5-Wave decline pattern.
2.) I want stocks that have at least 3 - "Breakaway Gaps".
3.) A "Bullish Divergence" must exist.
4.) I'm only interested in Buying stocks, > when the price and Moving Averages are trending sideways, > when the Blue 8-day M.A. is under the Red 34-day M.A., > when the "price" is under the "8-day Moving Average". > when the price is under a "Key support" level.
EXAMPLES: See the Embedded Charts below These pictured chart examples show you what you will want your stock pick to look like, before the move-up happens.
 Market Data
  Markets