reality hits again, finally.. well, PPT failed to intervene today.. no new money or new buying in the market after a couple weeks of consolidation. Time to take a nose dive and give back some gains.
Hi 3X! On a short term Renko, recent SPY waves can be easily counted.
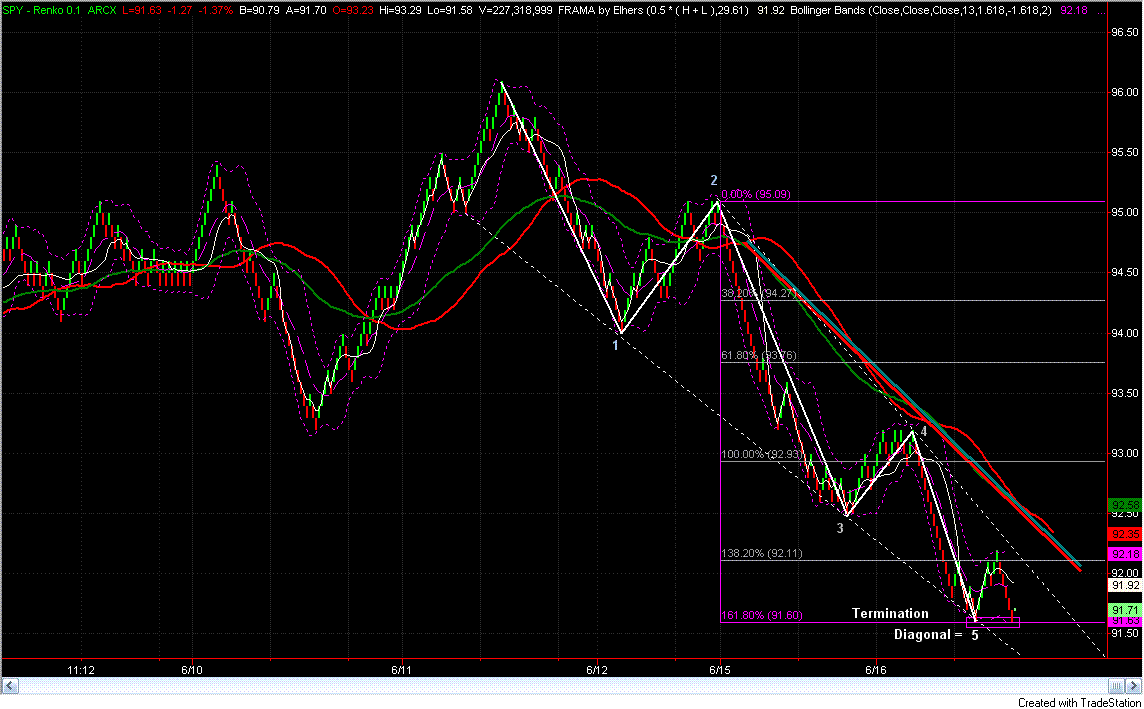
Chart 1 = bullish count. The Fibonacci price extension lines were projected from the trip of waves 1 - 2. Wave 5 is finished with a double bottom precisely at the 161.8% extension. This one is simple and clear. I like it.
Chart 2 = bearish count. An additional series of Fibonacci price extension lines were projected from the trip of waves 3 - 4. Note the interesting overlap of the two support lines, from the two extension series, at the closing value of today, 6/16... = maybe a strong support. An approximate ab = cd marked the transition to a long down trend. Wave 5 can have much lower targets, but not lower than 90.6, to stay < wave 3.
Tomorrow’s opening should discriminate between these two counts and therefore it is important both for longer term investments and for OE positions.
well its not that brave, i think im just following the overall trend of the last months. you remember the second week of may, everybody started talking that the rally is over and its time for a pullback etc...
i think the same is happening now. we peaked last week and went down strongly for two days now. i think we will see some sidewaystrading for a week or two now and hope to see a new peak after it.
 Market Data
  Markets