MPtrader - Gold Prices Headed Higher by Mike Paulenoff - Jan 16, 2009 - 01:54 PM The Market Oracle
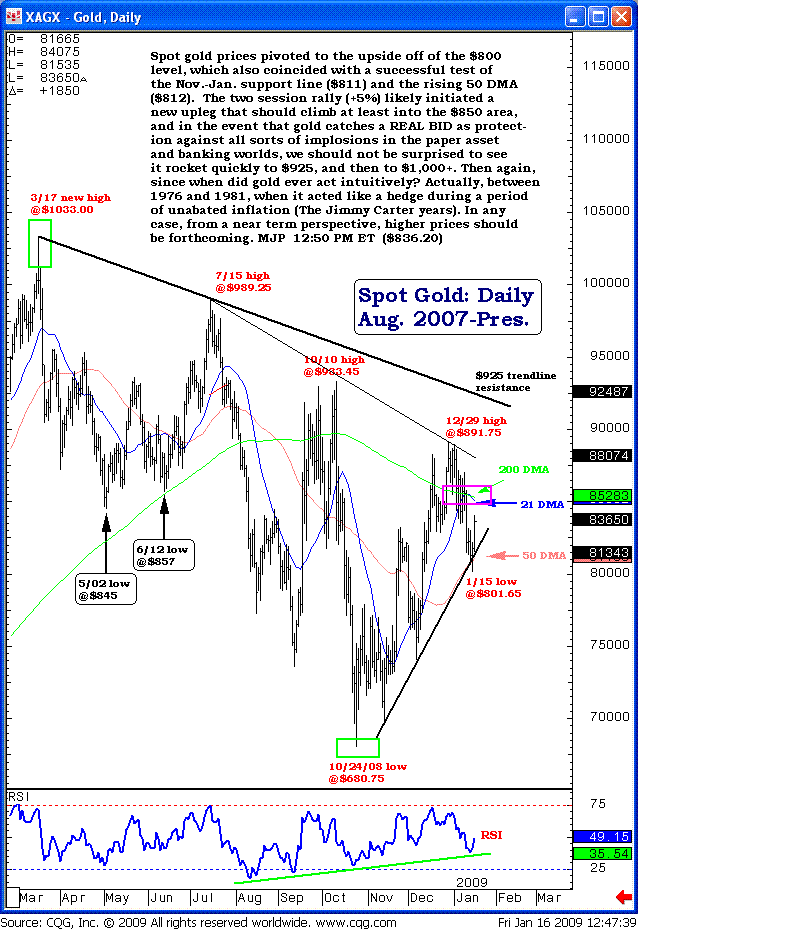
While the banks stocks implode, let's have a look at the pattern developing in spot gold, which is 10 times the price of SPDR Gold Shares ETF (NYSE: GLD). Spot gold prices pivoted to the upside off of the $800 level, which also coincided with a successful test of the Nov.-Jan. support line ($811) and the rising 50 DMA ($812). The two session rally (+5%) likely initiated a new upleg that should climb at least into the $850 area, and in the event that gold catches a REAL BID as protection against all sorts of implosions in the paper asset and banking worlds, we should not be surprised to see it rocket quickly to $925, and then to $1,000+. Then again, since when did gold ever act intuitively? Actually, between 1976 and 1981, when it acted like a hedge during a period of unabated inflation (The Jimmy Carter years). In any case, from a near term perspective, higher prices should be forthcoming. MJP 12:50 PM ET ($836.20)
Mike Paulenoff is author of the MPTrader.com (www.mptrader.com) , a real-time diary of Mike Paulenoff's trading ideas and technical chart analysis of Exchange Traded Funds (ETFs) that track equity indices, metals, energy commodities, currencies, Treasuries, and other markets. It is for traders with a 3-30 day time horizon, who use the service for guidance on both specific trades as well as general market direction
George.
Click on "In reply to", to see any past commentary.
MPtrader by Mike Paulenoff - Jan 20, 2009 - 01:54 PM UltraShort TBT ETF Benefiting from U.S. Treasuries Decline The Market Oracle
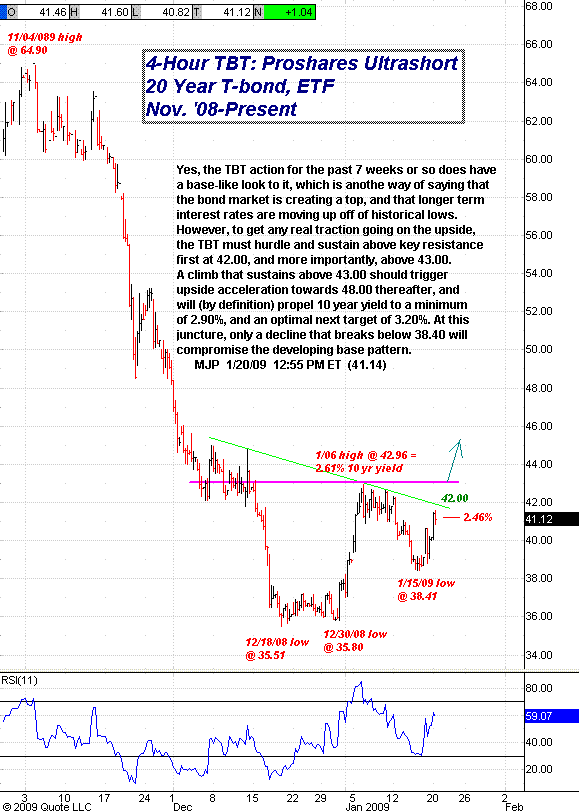
The long end of the bond market, and the TLT's (Barclay's 20+ Year T-bond, ETF), are getting hurt today, despite a climbing US dollar. The TBT's (Proshares Ultrashort T-bond, ETF) is benefiting from the price action. Looking at the 4-hour chart, the TBT action for the past 7 weeks or so does have the a base-like look to it, which is another way of saying that the bond market is creating a top, and that longer-term interest rates are moving up off of historical lows. However, to get any real traction going on the upside, the TBT must hurdle and sustain above key resistance first at 42.00 and more importantly above 43.00. A climb that sustains above 43.00 should trigger upside acceleration towards 48.00 thereafter and will (by definition) propel 10-year yield to a minimum of 2.90% and an optimal next target of 3.20%. At this juncture, only a decline that breaks below 38.40 will compromise the developing base pattern.
Mike Paulenoff is author of the MPTrader.com (www.mptrader.com) , a real-time diary of Mike Paulenoff's trading ideas and technical chart analysis of Exchange Traded Funds (ETFs) that track equity indices, metals, energy commodities, currencies, Treasuries, and other markets. It is for traders with a 3-30 day time horizon, who use the service for guidance on both specific trades as well as general market direction.
George.
Click on "In reply to", to see any past commentary.


 Market Data
  Markets


 AI
AI