Posted by: Bill Panetta Date: Tuesday, January 08, 2008 9:53:33 PM In reply to: None Post # of 14684 50% RULE HEAD-FAKE (new article) 01-08-2008
Let me walk you through one of my latest trades using the stock SOEN.
In this 3 part example we are going analyze and make it clear, you have to use closing prices and not intra-day action.
There seems to be confusion among traders, do i use closing price or intra-day. I am gonna show you where its better to go with the closing price to stay in a trade.
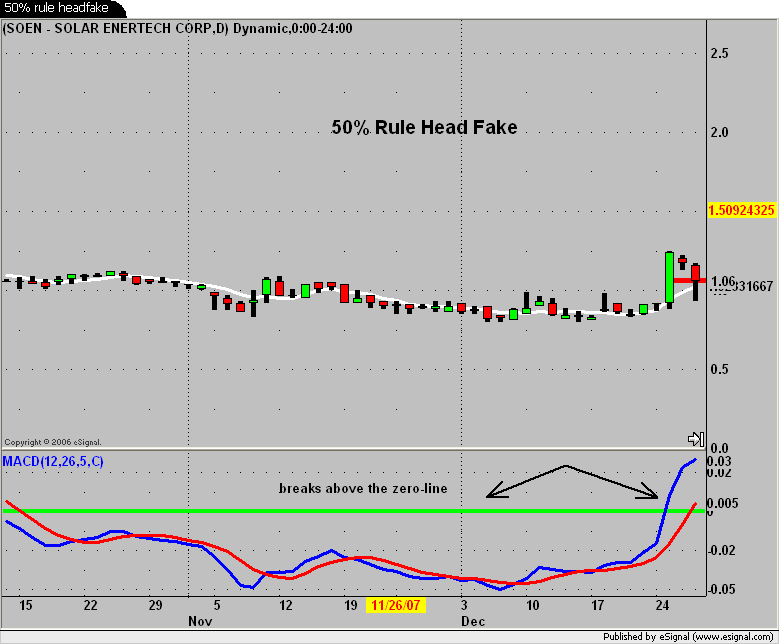
Lets look at the first chart:
I took the trade on the big green candle day on the chart 12-26-2007. I love big green candles because you use them as your guide. My average was .98 the first day.
The next day was OK, it was a small inside day, there was no violation of the 50% rule, it was holding up really nice. Then the next day all hell broke loose. I will go into money management at the end of this article to explain what i did on the first day.
3rd day : (12-28-2007) We had a hard pullback and we violated the 50% rule on a intra-day basis (key word intra-day basis) we also violated the 5 day moving average which is a very critical moving average for momentum. Now as a trader or investor there are decisions to make because basically all of you gains were taking away temporarily ( money management later).
At this point your upset, discouraged, your saying i suck as a trader, but wait a minute, my secret weapon is still there to guide me through this volatility. What am i talking about thats right the MACD, the trend indicator the measure of strength in the trend.
If you look at the chart you will see that the MACD breaks above the green line which we call the zero-line (the MOMO line). The green line represents real power, a strong trend.
As you can see, we made that hard pull back on 12-28-2007 the MACD my life saver was clearly above the zero-line (green line) on the chart. This is why we use the closing prices not inta-day action. We hit a bottom that day and we came all the way back and closed right at the 50% rule of the big green candle, But in conjunction with this reversal we got back to the 5 day moving average. HUGE reversal the followed.
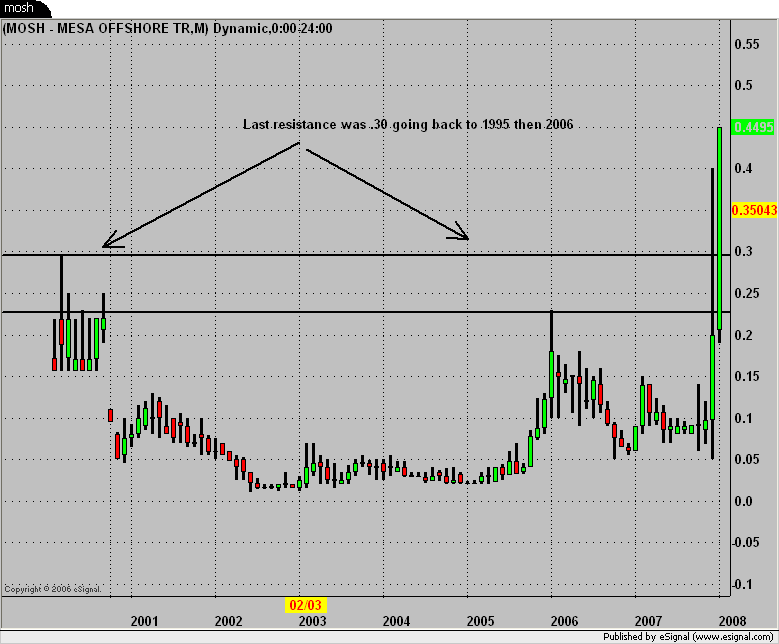
Lets go to the 2nd chart and see what accrued in the days ahead.
As you can see after the reversal day the stock explodes 3 days in a row for higher prices and turns into a great trade. 3 days in a row the 50% rule keeps you in for max profits. very clear on the chart what happened.
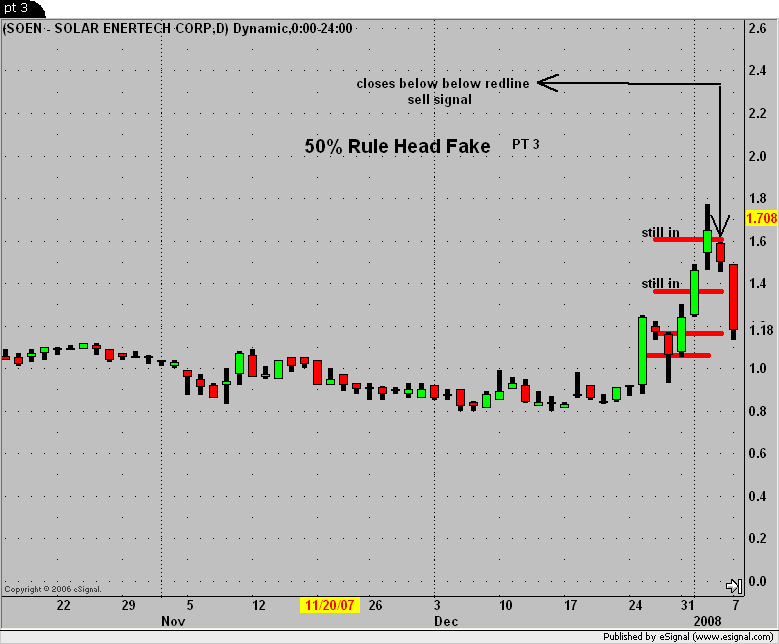
Lets go to the 3rd chart and wrap this study up
The 4th day SOEN gaps below the 50% rule of the previous day and its time to lock in profits. You can clearly see the close is below the red-line, it had been a great trade its time to take profit.
We used 3 key indicators in this article to teach you how to read into momentum in a stock. 50% rule, 5 day moving average and a basic indicator the MACD. Master these 3 and you will do fine trading Mico-Cap and Small-Cap Stocks.
Last thing, Money Management: When I trade stocks like SOEN my entry was a .98 average the close that day was 1.24ish. At the end of the day i sold a portion of my position.Why? because of what can happen in these stocks. If the stock goes up i am good if the stock comes down and gets real volatile I had some profits locked in. You hear traders say sell 1/2 when you double your money, I say sell a portion when you have good profit that way you take out the emotions out of trading. also if it comes back down to your original entry point , you didn't blow the trade completely.
There's a lot more to trading and investing but this will give you a great start for momentum trading.
 Market Data
  Markets