InvestorsHub Logo

trader53

08/02/20 5:53 AM

#169277 RE: trader53 #169276

VRUS - Buy after a EW 5-Wave Decline


I'll Alert you of stocks to Buy,
before the Run happens !


________________________________________________________________


The Elliott Wave 5-Waves Sequence

A Basic "A,B,C Corrective Wave"


https://www.metatrader5.com/en/terminal/help/objects/elliott/elliott_theory


________________________________________________________________


Elliott Wave Basics
http://www.acrotec.com/ewt.htm

Elliott Wave Theory
http://ta.mql4.com/elliott_wave_theory

Buy after an Elliott Wave,
5-Wave decline sequence !


A Basic "A,B,C Corrective Wave"

Buy, ONLY when the stocks price,
is trading under the Blue 8-day M.A.
when the Blue 8-day M.A. is under the Red 34-day M.A.


________________________________________________________________


Live! Charts


_______________________________________________________________


Buy, ONLY when the stocks price,
is trading under the Blue 8-day M.A.
when the Blue 8-day M.A. is under the Red 34-day M.A.


________________________________________________________________


Buy, ONLY when the stocks price,
is trading under the Blue 8-day M.A.
when the Blue 8-day M.A. is under the Red 34-day M.A.


________________________________________________________________


Sell after a EW 5-Wave Advance


The Elliott Wave 5-Waves Sequence

A Basic "A,B,C Corrective Wave"


https://www.metatrader5.com/en/terminal/help/objects/elliott/elliott_theory


________________________________________________________________


Elliott Wave Basics
http://www.acrotec.com/ewt.htm

Elliott Wave Theory
http://ta.mql4.com/elliott_wave_theory

Buy after an Elliott Wave,
5-Wave decline sequence !


A Basic "A,B,C Corrective Wave"

Buy, ONLY when the stocks price,
is trading under the Blue 8-day M.A.
when the Blue 8-day M.A. is under the Red 34-day M.A.


_________________________________________________________________


Live! Charts


________________________________________________________________


Buy, ONLY when the stocks price,
is trading under the Blue 8-day M.A.
when the Blue 8-day M.A. is under the Red 34-day M.A.


_________________________________________________________________


Buy, ONLY when the stocks price,
is trading under the Blue 8-day M.A.
when the Blue 8-day M.A. is under the Red 34-day M.A.


_________________________________________________________________


Sell after a EW 5-Wave Advance


________________________________________________________________


The Elliott Wave 5-Waves Sequence

A Basic "A,B,C Corrective Wave"


https://www.metatrader5.com/en/terminal/help/objects/elliott/elliott_theory

________________________________________________________________


________________________________________________________________


Impulse Wave 1 - The Accumulation Stage
the Wave right after a prolonged downtrend.
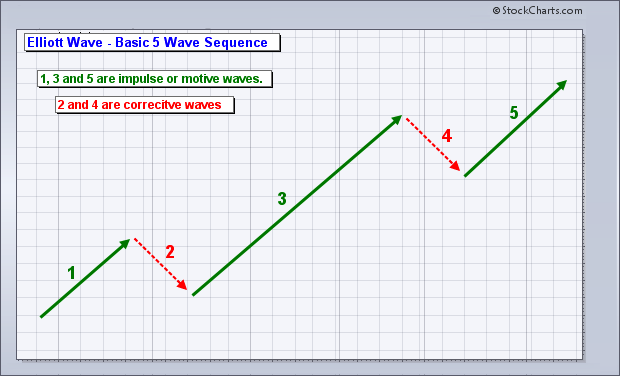


Wave 1

The stock makes its initial move upwards.
This is usually caused
by a relatively small number of people
that all of the sudden
(for a variety of reasons, real or imagined)
feel that the price of the stock is cheap
so it’s a perfect time to buy.
This causes the price to rise.


Wave 2 - Stock Declines

At this point,
enough people who were in the original wave
consider the stock overvalued and take profits.
This causes the stock to go down.
However, the stock will not make it to its previous lows
before the stock is considered a bargain again


Wave 3

This is usually the longest and strongest wave.
The stock has caught the attention of the mass public.
More people find out about the stock and want to buy it.
This causes the stock’s price to go higher and higher.
This wave usually exceeds the high created at the end of Wave 1.


Wave 4

Traders take profits
because the stock is considered expensive again
.

This Wave tends to be weak
because there are usually more people
that are still bullish on the stock
and are waiting to “buy on the dips.”


Wave 5

This is the point that most people get in on the stock,
and is mostly driven by hysteria.

You usually start seeing the CEO of the company
on the front page of major magazines
as the Person of the Year.
Traders and investors start coming up with
ridiculous reasons to buy the stock
and try to choke you when you disagree with them.

This is when the stock becomes the most overpriced.
Contrarians start shorting the stock
which starts the ABC pattern.


________________________________________________________________


trader53

08/02/20 6:00 AM

#169278 RE: trader53 #169276

VRUS 0.0026 - Ready to Leave the Station!


I'll Alert you of stocks to Buy,
before the Run happens !


_______________________________________________________________


Trader53's Wealth Strategy


* Buy 2 Million Shares of every 0.00 that you like !

* Many 0.00's will climb to $0.01 and Higher


________________________________________________________________


Traders - It's Time To Get Loaded!


* Buy 2 Million Shares of every 0.00 that you like !


________________________________________________________________


"Point of Maximum Financial Opportunity"!

* Load All that you can Now, or Regret !

* Epic Move-Up is Coming !

________________________________________________________________


_________________________________________________________________


Live! Charts


_______________________________________________________________


price_and_volume

08/02/20 6:03 AM

#169279 RE: trader53 #169276

Almost completely off-topic

Would possibly be useful or interesting if you LABELED all those VRUS charts w/ your wave-count.

Fwiw...

Backstabbed

08/02/20 7:48 AM

#169281 RE: trader53 #169276

Nice analysis! Good to have you with us! $0.02+ here we some!

trader53

08/05/20 4:18 AM

#169665 RE: trader53 #169276

VRUS 0.0024 - Targets $0.014 / $0.018

https://www.otcmarkets.com/stock/VRUS/security


How Targets are Calculated

Fibonacci Numbers and Retrace Targets: Explained


________________________________________________________________


Fibonacci Numbers

http://www.stockta.com/cgi-bin/school.pl?page=fib

Fibonacci Retracements

* Golden 61.8% Retracements

* Moderate 38.2% Retracements

* Common 38.2% Retracements


Fibonacci Retracements

http://stockcharts.com/school/doku.php?id=chart_school:chart_analysis:fibonacci_retracemen


________________________________________________________________


Fibonacci Numbers
are commonly used in Technical Analysis
with or without a knowledge of Elliot Wave Analysis
to determine potential support, resistance,
and price objectives.

The most popular Fibonacci Retracements are
61.8% and 38.2%


61.8% retracements
imply a new trend is establishing itself.

38.2% retracements
usually imply that the prior trend will continue

38.2% retracements
are considered natural retracements in a healthy trend.

Fibonacci Retracements
can be applied after a decline
to forecast the length of a counter-trend bounce.


________________________________________________________________

The 50% retracement is not based on a Fibonacci number.
Instead, this number stems from Dow Theory's assertion
that the Averages often retrace half their prior move.

50% retracement
implies indecision.

________________________________________________________________


________________________________________________________________


Buy after an Elliott Wave 5-Wave Decline


_________________________________________________________________


________________________________________________________________


Buy after an Elliott Wave 5-Wave Decline


Live! Chart


________________________________________________________________


Buy after an Elliott Wave 5-Wave Decline


Live! Charts


________________________________________________________________


Buy after an Elliott Wave 5-Wave Decline


Live! Charts


________________________________________________________________