Are You Watching Energy Stocks? By Greg Schnell | June 3, 2017
Energy stocks have been declining since December for the most part. This would be one of the best clues that the investors do not like the trends inside the industry. Now the Bullish Percent Index for Energy is under 20%. Here is the good news. The sector can stay down here for a while, but eventually, these stocks will come to life. As a matter of fact, there is a nice rhythm in the momentum for energy stocks. Let me put a few charts up to whet your appetite for a little black wine sometime later this year.
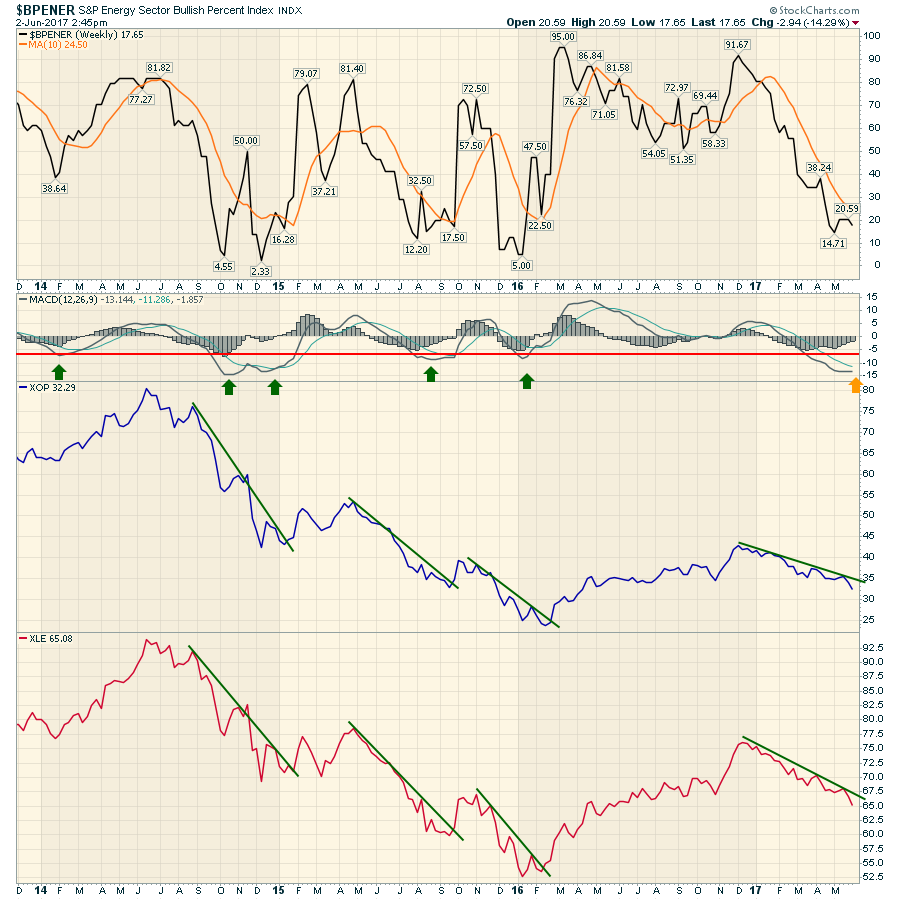
First of all, here is the Bullish Percent Index for Energy ($BPENER). We can see the Index is near the lowest levels of the last few years. The level around 15% to 20% is usually where meaningful bottoms are built. We can also see the momentum shown by the MACD is very low. The MACD is also flattening out here. So, the first clue for us is that the downside momentum is waning somewhat but that does not mean the bottom is in for energy stocks. You can see that looking at the Exploration and Production ETF (XOP) as well as the Energy Sector ETF (XLE).
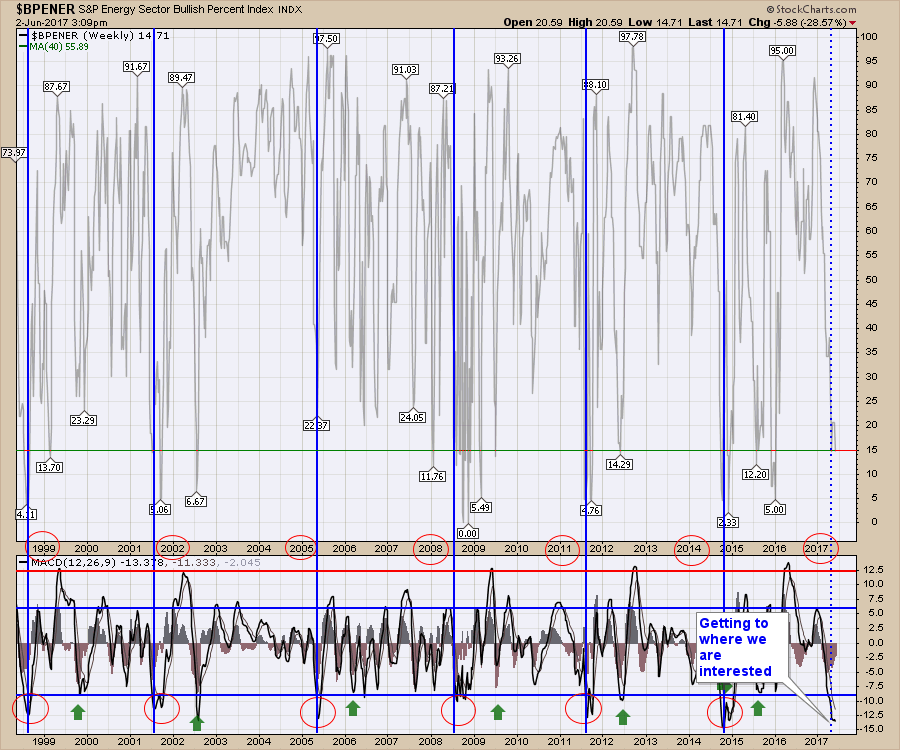
If we take the $BPENER chart and show the last 18 years, you can see a low momentum cycle roughly every 3 years. Why I think this is particularly interesting is that we are at one of the lowest readings already.
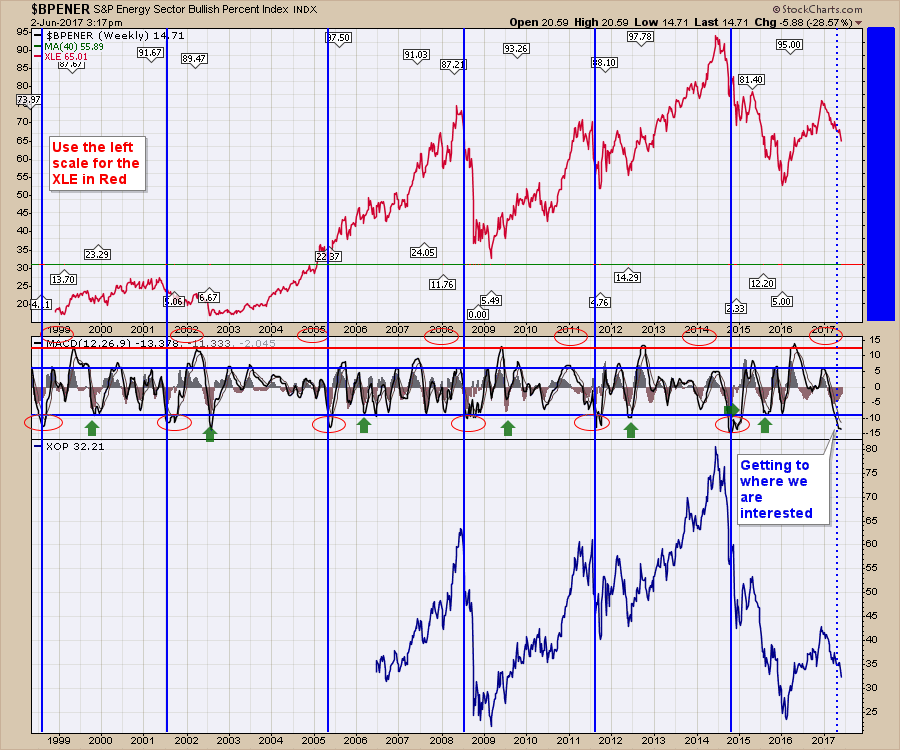
On the next chart I could have set the $BPENER data to 'invisible' or by setting Opacity to zero to hide it. After doing that, I still want to keep the MACD for the $BPENER and input the XLE and XOP data. The result is below. We have more history for XLE than XOP. In most cases the bottom shows up a few months later. You can always click on these charts to see the settings used.
 Market Data
  Markets