sorry, didn't explain why. I see alot of these(The doji and spinning top show indecision and are generally considered neutral. These non-reversal patterns indicate decreased buying pressure, but no noticeable increase in selling pressure. For an advance to continue, new buyers must be willing to pay higher prices. As noted by the spinning top and doji, a standoff shows lack of conviction among buyers and a possible resistance level.)on weekly charts paired with negative MACD Histograms and Falling volume. Daily charts I see fallin new high-new low indicators and rising put/call ratio. Check what happens when the correlation hits 0 as the macd comes up from below.
Hope the neck is doing better, we here at ATM seem to like beating ourselves up it seems!
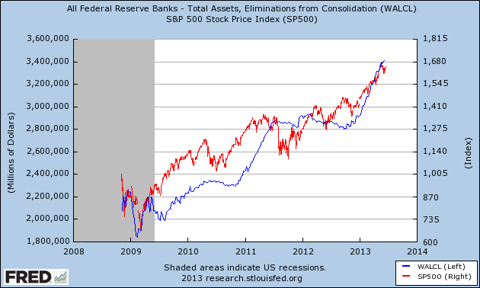
Charts, to me seem to agree somewhat but I'm still kind of torn.. Especially when seeing this kind of stuff.
From the Chicago Mercantile Exchange 2012 10-K:
Customer Base
Our customer base includes professional traders, financial institutions, institutional and individual investors, major corporations, manufacturers, producers and governments.
And from the Chicago Mercantile Exchange 2013 10-K:
Customer Base
Our customer base includes professional traders, financial institutions, institutional and individual investors, major corporations, manufacturers, producers, governments and central banks.


 Market Data
  Markets


 AI
AI