


Wednesday, August 07, 2013 8:51:31 AM
Records For Arctic Ice Melt, Greenhouse Gas Emissions In 2012 As World Continues To Warm: Report

Polar bear mother with two cubs on an ice flow in the Arctic ocean.
(Getty)
Posted: 08/06/2013 7:06 pm EDT | Updated: 08/06/2013 7:09 pm EDT
The year 2012 was a terrible time for the planet, according to a new report released by the American Meteorological Society this week [ http://www.climate.gov/news-features/understanding-climate/state-climate-2012-highlights ].
Edited by scientists at the National Oceanic and Atmospheric Administration, the 2012 State of the Climate report [ http://www.huffingtonpost.com/2013/08/06/2012-climate-change-repor_n_3715258.html (next below)] revealed that Arctic sea ice reached a record low, while sea levels and greenhouse gases from fossil fuel burning hit all-time highs last year.
2012 was also one of the top 10 warmest years on record globally, according to the report, which received input from hundreds of climate experts from more than 50 countries. The United States [ http://www.huffingtonpost.com/2013/01/08/2012-hottest-year-on-record_n_2433210.html ] and Argentina specifically experienced their hottest years ever.
"The findings are striking," said Kathryn Sullivan, acting administrator of the NOAA, according to the Agence France-Presse. "Our planet as a whole is becoming a warmer place [ http://www.google.com/hostednews/afp/article/ALeqM5h7u0w7h9VlYLxkL-a4VRR6dcIUAw?docId=CNG.8dfd1786d8171ba72c6e62b412951d8f.1e1 ; http://phys.org/news/2013-08-sea-ice-loss-greenhouse-gas.html ]."
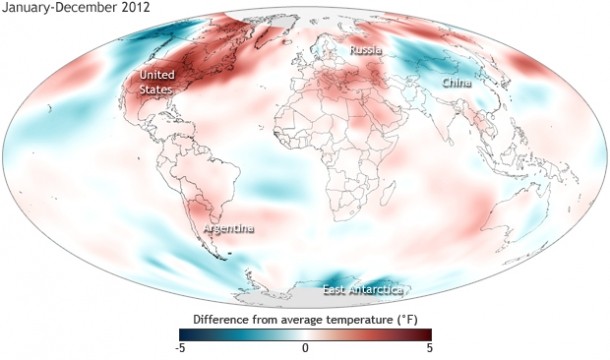
Surface temperatures in 2012 compared to the 1981-2010 average. NOAA map by Dan Pisut, NOAA Environmental Visualization Lab, based on Merged Land and Ocean Surface Temperature data from the National Climatic Data Center.
Sullivan told the Associated Press the report reveals "remarkable changes in key climate indicators," including the dramatic melting of Arctic and Greenland ice [ http://www.washingtonpost.com/politics/noaa-2012-shows-climate-change-with-record-sea-level-rise-arctic-melting-heated-up-oceans/2013/08/06/0de15ee2-fece-11e2-8294-0ee5075b840d_story.html ].
Per the media release that accompanied the report:
Conditions in the Arctic were a major story of 2012, with the region experiencing unprecedented change and breaking several records. Sea ice shrank to its smallest “summer minimum” extent since satellite records began 34 years ago. In addition, more than 97 percent of the Greenland ice sheet showed some form of melt during the summer, four times greater than the 1981–2010 average melt extent.
Greenhouse gases also continue to be a concern. "Major greenhouse gas concentrations, including carbon dioxide, methane, and nitrous oxide, continued to rise [last year]," the report said, pointing out that a new record for CO2 emissions from fossil fuel emissions has been estimated for 2012.
"It's hard to read the report and not be led to the conclusion that the task of reducing carbon emissions is now more urgent than ever,'' said Michael Mann, a climatologist at Pennsylvania State University, who was not involved in the research, according to AFP.
The report also pointed out that sea levels reached a record high last year, with sea surface temperatures climbing significantly.
"A lot of people like to say that global warming stopped in 1998, and that's said because temperatures have gone up pretty slowly," climatologist James Renwick, a co-author of the report, told the New Zealand Herald. "But ice has been melting more rapidly [ http://www.nzherald.co.nz/nz/news/article.cfm?c_id=1&objectid=10909078 ], more heat is going into the ocean and the sea level is rising faster. All of those things indicate that the climate system as a whole is continuing to warm up -- and warm up faster as we go along."
Go to the NOAA website to read a summary of the report [ http://www.noaanews.noaa.gov/stories2013/20130806_stateoftheclimate.html ]. The full report is available here [ http://www.ametsoc.org/2012stateoftheclimate.pdf ].
Copyright © 2013 TheHuffingtonPost.com, Inc.
http://www.huffingtonpost.com/2013/08/06/record-arctic-ice-melt_n_3715226.html [with (over 5,000) comments]
--
2012 Climate Change Report From NOAA Reveals Rising Seas, Snow Melt And More Warming

In this July 19, 2011 photo, a large melt pool forms in the Ilulissat ice fjord below the Jakobshavn Glacier, at the fringe of the vast Greenland ice sheet.
(AP Photo/Brennan Linsley)
By SETH BORENSTEIN
08/06/13 04:28 PM ET EDT
WASHINGTON -- A new massive federal study says the world in 2012 sweltered with continued signs of climate change. Rising sea levels, snow melt, heat buildup in the oceans, and melting Arctic sea ice and Greenland ice sheets, all broke or nearly broke records, but temperatures only sneaked into the top 10.
The National Oceanic and Atmospheric Administration on Tuesday issued a peer-reviewed 260-page report, which agency chief Kathryn Sullivan calls its annual "checking on the pulse of the planet." The report, written by 384 scientists around the world, compiles data already released, but it puts them in context of what's been happening to Earth over decades.
"It's critically important to compile a big picture," National Climatic Data Center director Tom Karl says. "The signs that we see are of a warming world."
Sullivan says what is noticeable "are remarkable changes in key climate indicators," mentioning dramatic spikes in ocean heat content, a record melt of Arctic sea ice in the summer, and whopping temporary melts of ice in most of Greenland last year. The data also shows a record-high sea level.
The most noticeable and startling changes seen were in the Arctic, says report co-editor Deke Arndt, climate monitoring chief at the data center. Breaking records in the Arctic is so common that it is becoming the new normal, says study co-author Jackie Richter-Menge of the U. S. Army Corps of Engineers' Cold Regions Research and Engineering Laboratory in Hanover, N.H.
Karl says when looked at together, all the indicators show a climate that is changing over the decades. Individually, however, the story isn't as simple.
Karl says surface temperatures haven't risen in the last 10 years, but he notes that is only a blip in time due to natural variability. When looking at more scientifically meaningful time frames of 30 years, 50 years and more than 100 years, temperatures are rising quite a bit, Karl said. Since records have been kept in 1880, all 10 of the warmest years ever have been in the past 15 years, NOAA records show.
Depending on which of four independent analyses are used, 2012 ranked the eighth or ninth warmest year on record, the report says. Last year was warmer than every year in the previous century, except for 1998 when a record El Nino spiked temperatures globally. NOAA ranks 2010 as the warmest year on record.
They don't have to be records every year, Karl says.
Overall the climate indicators "are all singing the same song that we live in a warming world," Arndt says. "Some indicators take a few years off from their increase. The system is telling us in more than one place we're seeing rapid change."
While the report purposely doesn't address why the world is warming, "the causes are primarily greenhouse gases, the burning of fossil fuels," Arndt says.
The study is being published in a special edition of the Bulletin of the American Meteorological Society.
Online:
The Climate of 2012 report: http://www.ncdc.noaa.gov/bams-state-of-the-climate/2012.php
© 2013 Associated Press
http://www.huffingtonpost.com/2013/08/06/2012-climate-change-repor_n_3715258.html [with comments]
Greensburg, KS - 5/4/07
"Eternal vigilance is the price of Liberty."
from John Philpot Curran, Speech
upon the Right of Election, 1790
F6
Discover What Traders Are Watching
Explore small cap ideas before they hit the headlines.


