


| Followers | 121 |
| Posts | 24039 |
| Boards Moderated | 0 |
| Alias Born | 02/20/2003 |
Sunday, February 24, 2013 12:43:19 PM
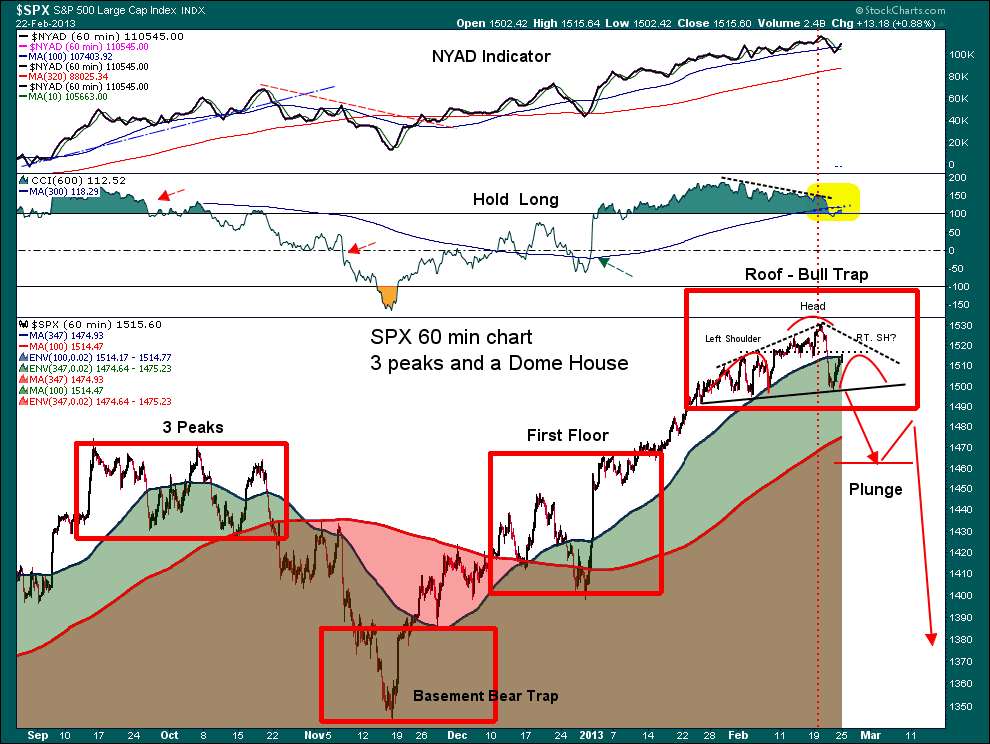
Feb 25th - Monday - Market Outlook - Possible 3 Peaks a Dome Top - Bull Trap - See the SPX chart on page 1 - rare occurance
The UK Bond Rating gets cut from AAA to Aa1 by Moody - 5 pm Friday - Good timing :) The Pound drops like a Rock
NEUTRAL SIGNAL - DISTRIBUTION PHASE - The markets did what they always do, take things to the limits in the Dow, SPX and Russell, with a nice bounce closing at resistance. The S&P 500 had a kiss of death at the close, as price kissed the back trend line. This last gasp up in my opinion is the professional shorting the market as price gets marked up. Volume on the Russell 2000 and the S&P 500 was pretty pathetic after huge price destruction on volume for 2 straight days. We are in the distribution phase so this is when it is generally a good time for day traders. The first chart on page 1 through the histogram illustrates the 9 month cycle low to cycle high which is coming up next week. The effect of downgrading the UK Bond Rating on the Pound vs. the $USD / EURO will be something to monitor. The EURO is sitting on major MA support and jumping the fence would cause a major rise in the US Dollar. The effect of a strong US Dollar has a negative effect on the Dow and stocks like AAPL who do a lot of business internationally. The US Dollar climbed 2 cents above the Nov. high at Friday's close, implying higher prices in the $USD. Friday's close of 1515 SPX makes a nice right shoulder of a Head and Shoulder formation. A break of Thursday's low will give us a target of 1464 See the chart on pg. 1. Another chart to look at is on pg. 2, the SPX Weekly chart and the relationship of the RSI 70 and tops. . The NASI indicator gave a major sell signal Thursday. The NAMO turned over Thursday and the Daily NYAD had a negative crossover. Leadership, which has been the banking sector, did some major distribution this past week, see the Banking chart on pg 2. I have put a few of the A-B & C-D charts along with the SPX Bearish Butterfly on Pg. 1 & 2. These have the projected down moves. Gold bounced a little today with the target met with the Symetrical Triange. This buying is likely the covering of shorts, and not real buying. Like the Indexes, anytime you have rapid price destruction, you generally have to wait for the moving averages to give support. The strong $USD effect on Gold is on page 2. If on Monday we spike higher with the $USD, Gold could break down hard. Take a look at the Unleaded chart on pg 2. The relationship between Tops in the market and unleaded gas tops are telling.
Euphoric stage: The AAII Sentiment Survey for Feb 21st Bulls 42% and Bears 32%. The Fund Managers Survey - NAAMI recorded an all time high two weeks ago with a 104%, net long response. Byron Wien from Blackstone said on 2/6 that he expects a 1st half correction of 200 points in the S&P 500 or 1300. Goldman downgraded its view on global equities over the next three months, to "neutral" from "overweight".
The leaders in the markets are the Russell 2000 and the Financial sector charts. I have these on page 1 showing buy and sell points using the SCTR indicator and what you should look for when you are buying or selling indexes like the Russell 2000 . Tops take a lot longer to form than bottoms, so this chart will help you trade. Financials have been leading since Ben announced the 85 Billion a month buy of MBS. To find the ratings click on "Free Charts Tab" and then click on SCTR on the right side of the page. The employment report and turn of month are next Friday.
The 1,5,15,30 minute charts are more for intraday trading only. Tradable Shorts or Long are not recommended to hold overnight.
DOW - Hold Short below 13957 - Tradable Long Above - Hold Long above13970
SPX - Hold Short below 1515 - Tradable Long Above - Hold Long above 1516 VIX - Euphoric
NASDAQ - Hold Short below 3166 - Tradable Long Above - Hold Long above 3180 NYUD - Sell Signal
QQQ - Hold Short below 67.24 - Tradable Long Above - Hold Long above 67.60 NYAD - Buy Signal
RUT - Hold Short below 917 - Tradable Long Above - Hold Long above 917 NAUD -Buy Signal
GLD - Hold Short below 153.01 Tradable Long Above - Hold Long above 157.38
Think Tank

Discover What Traders Are Watching
Explore small cap ideas before they hit the headlines.


