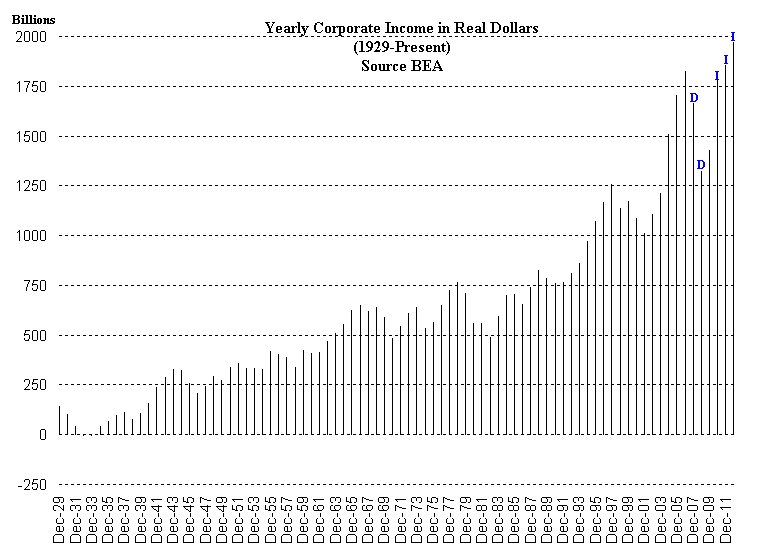
One of the main driving forces for the stock market is Corporate Income. The chart below shows Yearly Corporate Income since 1929 in real dollars. After trending downward in 2007 and 2008 (points D) Corporate Income began to rebound in 2009 and has increased significantly the past few years (points I) while making all time highs.
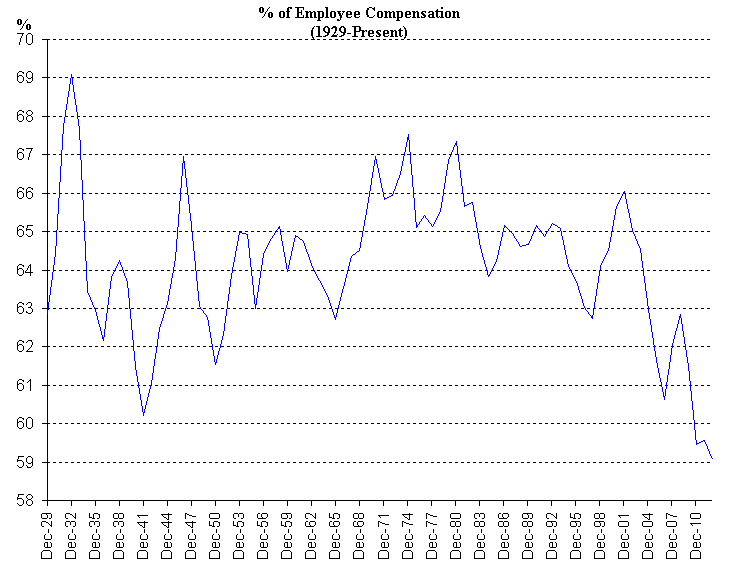
Meanwhile Employee Compensation as a % of Corporate Income has reached all time lows the past two years and has trended sharply downward since 2002. Thus it doesn't take a business degree from the Wharton School of Business to figure out how corporations have increased their profits. They have done it by substantially reducing labor costs.
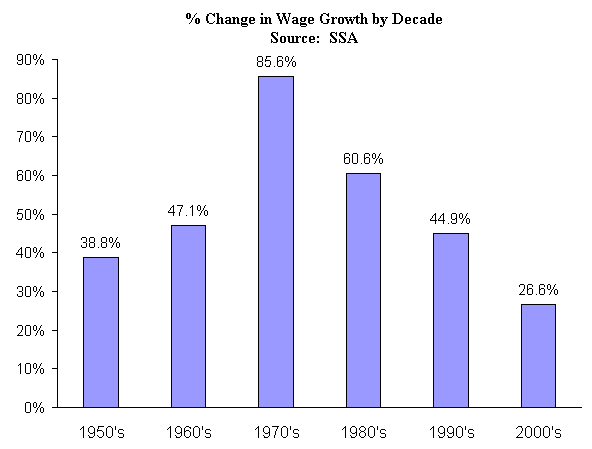
Furthermore the National Wage Index as calculated by the Social Security Administration clearly shows how Wage Growth has been steadily declining after peaking in the 1970's.
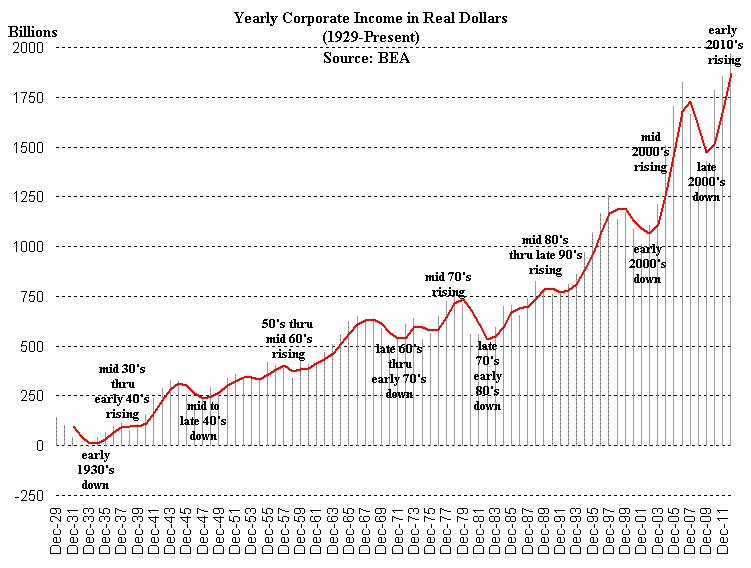
The question at this point is the current increase in Corporate Income sustainable? Since the late 1920's companies have seen Incomes go though a series of up and down cycles. The red line is a simple 3 Year Moving Average of Income.
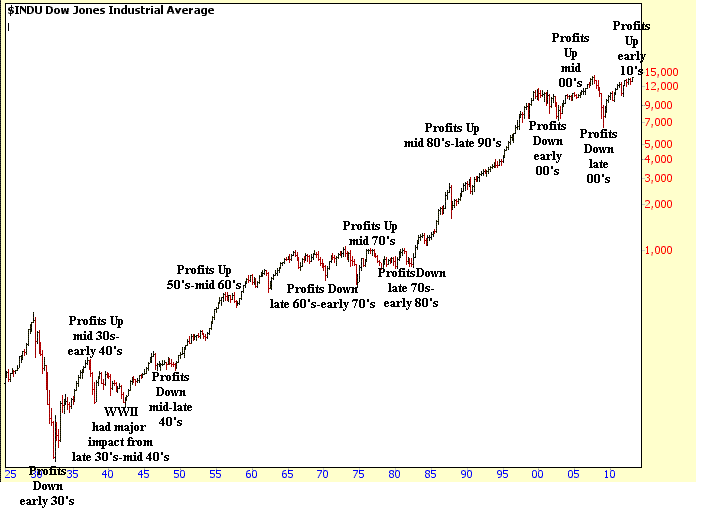
Meanwhile when you look at a long term chart of the Dow you can clearly see how these up and down cycles in Corporate Income has affected the market both negatively and positively. Outside of World War II the market has pretty much trended with the Income Cycles which have become more volatile the last decade.