


Wednesday, October 24, 2012 1:48:03 PM
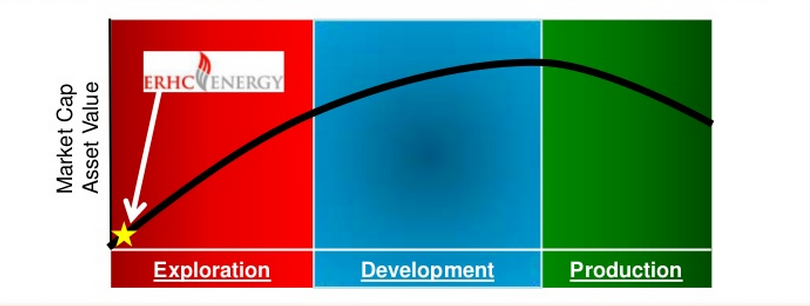
Yes, I agree the chart is simplified to illustrate a point. That from the start of the exploration phase to the peak pre-drill can have a very strong share price rise, all without a drop of oil discovered.
Along the way there will have to be all the normal puzzle pieces, as you correctly mention; Capital raised, Gravity and Magnetic Studies, Seismic studies, promising leads, JV partners, good drilling targets, rigs on their way to drill, and so on.
What was also mentioned in the Value Proposition and all my posts, is that the second rally in the blue Development phase is dependent on discoveries, with dry wells giving the opposite result which is not shown on that graph. It would be good to have a second chart showing this, or just look at the ERHE shareprice from 90 cents to today as an example of an Exploration phase that doesn't result in a Development phase.
Thus it is important to consider taking profits during the more probable Red Exploration Phase Rally, which doesn't require a drop of oil to be discovered. While the Blue Development Phase Rally can also occur, it may be less steep, or be a decline if the wells come up dry. That is the point of the Value Proposition.
The chart is also smoothed, say from 10 cents to 90 cent. The real share price could be more choppy, and as there are now multiple exploration assets active, Chad and Kenya, and with more being bid for, and the EEZ moving forward, there could be a more complex and elaborate curve with several exploration rallies.
But let's look at actual history ERHE price action on just one asset, the exploration rally of 2009. From 10 cents to 90 cents, without a drop of oil discovered and a nearly vertical share price increase of 900%.

The Chart of the Value Proposition smooths out the daily and intra-day swings, but it looks very much like prior ERHE exploration run-ups.
Here is the actual 2009 monthly price chart displayed as a line on close. Again, a near vertical move from 10 cents to 90 cents. A 900% increase in the share price.
This chart also shows what happens when there is no development stage as there is no discovery. The Share Price sells off.
That was the whole point of the Value Proposition, to show that the Exploration phase was the better and safer bet, and that the Development phase rally was often smaller, or a sell off if no discovery was made.
ERHE is once again available for 10 cents, and once again an Exploration phase is starting. Only this time there are at least two active assets so a double exploration phase, and they are onshore, so quicker and cheaper to explore. Plus more are being bid for.
Each step along the Exploration phase, it will be more expensive to buy in, for those who prefer to wait for the good news first. But they may be chasing a rising share price if and when the Exploration phase rally occurs. For those who take the Value Proposition, they can still get in below 20 cents.

Along the way there will have to be all the normal puzzle pieces, as you correctly mention; Capital raised, Gravity and Magnetic Studies, Seismic studies, promising leads, JV partners, good drilling targets, rigs on their way to drill, and so on.
What was also mentioned in the Value Proposition and all my posts, is that the second rally in the blue Development phase is dependent on discoveries, with dry wells giving the opposite result which is not shown on that graph. It would be good to have a second chart showing this, or just look at the ERHE shareprice from 90 cents to today as an example of an Exploration phase that doesn't result in a Development phase.
Thus it is important to consider taking profits during the more probable Red Exploration Phase Rally, which doesn't require a drop of oil to be discovered. While the Blue Development Phase Rally can also occur, it may be less steep, or be a decline if the wells come up dry. That is the point of the Value Proposition.

The chart is also smoothed, say from 10 cents to 90 cent. The real share price could be more choppy, and as there are now multiple exploration assets active, Chad and Kenya, and with more being bid for, and the EEZ moving forward, there could be a more complex and elaborate curve with several exploration rallies.
But let's look at actual history ERHE price action on just one asset, the exploration rally of 2009. From 10 cents to 90 cents, without a drop of oil discovered and a nearly vertical share price increase of 900%.

The Chart of the Value Proposition smooths out the daily and intra-day swings, but it looks very much like prior ERHE exploration run-ups.
Here is the actual 2009 monthly price chart displayed as a line on close. Again, a near vertical move from 10 cents to 90 cents. A 900% increase in the share price.
This chart also shows what happens when there is no development stage as there is no discovery. The Share Price sells off.
That was the whole point of the Value Proposition, to show that the Exploration phase was the better and safer bet, and that the Development phase rally was often smaller, or a sell off if no discovery was made.
ERHE is once again available for 10 cents, and once again an Exploration phase is starting. Only this time there are at least two active assets so a double exploration phase, and they are onshore, so quicker and cheaper to explore. Plus more are being bid for.
Each step along the Exploration phase, it will be more expensive to buy in, for those who prefer to wait for the good news first. But they may be chasing a rising share price if and when the Exploration phase rally occurs. For those who take the Value Proposition, they can still get in below 20 cents.

We simply attempt to be fearful when others are greedy and to be greedy only when others are fearful. – Warrant Buffett


