


Sunday, August 12, 2012 2:05:37 AM
Climate change is here — and worse than we thought

[ http://www.washingtonpost.com/opinions/tom-toles-goes-green/2011/03/31/AFD04K0D_gallery.html ]
By James E. Hansen, Published: August 3, 2012
James E. Hansen directs the NASA Goddard Institute for Space Studies.
When I testified before the Senate in the hot summer of 1988 [ http://www.nytimes.com/1988/06/24/us/global-warming-has-begun-expert-tells-senate.html?pagewanted=all ], I warned of the kind of future that climate change would bring to us and our planet. I painted a grim picture of the consequences of steadily increasing temperatures, driven by mankind’s use of fossil fuels.
But I have a confession to make: I was too optimistic.
My projections about increasing global temperature have been proved true. But I failed to fully explore how quickly that average rise would drive an increase in extreme weather.
In a new analysis of the past six decades of global temperatures, which will be published Monday, my colleagues and I have revealed a stunning increase in the frequency of extremely hot summers, with deeply troubling ramifications for not only our future but also for our present.
This is not a climate model or a prediction but actual observations of weather events and temperatures that have happened. Our analysis shows that it is no longer enough to say that global warming will increase the likelihood of extreme weather and to repeat the caveat that no individual weather event can be directly linked to climate change. To the contrary, our analysis shows that, for the extreme hot weather of the recent past, there is virtually no explanation other than climate change.
The deadly European heat wave of 2003 [ http://www.washingtonpost.com/wp-dyn/articles/A26605-2004Dec1.html ], the fiery Russian heat wave of 2010 [ http://www.esrl.noaa.gov/psd/csi/events/2010/russianheatwave/ ] and catastrophic droughts in Texas and Oklahoma [ http://www.washingtonpost.com/blogs/capital-weather-gang/post/severe-us-drought-sets-another-record-costs-to-us-economy-upward-of-15-billion/2011/08/01/gIQA7cQbpI_blog.html ] last year can each be attributed to climate change. And once the data are gathered in a few weeks’ time, it’s likely that the same will be true for the extremely hot summer [ http://www.washingtonpost.com/national/health-science/drought-intensifies-in-most-parched-areas-of-us/2012/08/02/gJQAc334RX_story.html ] the United States is suffering through right now.
These weather events are not simply an example of what climate change could bring. They are caused by climate change. The odds that natural variability created these extremes are minuscule, vanishingly small. To count on those odds would be like quitting your job and playing the lottery every morning to pay the bills.
Twenty-four years ago, I introduced the concept of “climate dice” to help distinguish the long-term trend of climate change from the natural variability of day-to-day weather. Some summers are hot, some cool. Some winters brutal, some mild. That’s natural variability.
But as the climate warms, natural variability is altered, too. In a normal climate without global warming, two sides of the die would represent cooler-than-normal weather, two sides would be normal weather, and two sides would be warmer-than-normal weather. Rolling the die again and again, or season after season, you would get an equal variation of weather over time.
But loading the die with a warming climate changes the odds. You end up with only one side cooler than normal, one side average, and four sides warmer than normal. Even with climate change, you will occasionally see cooler-than-normal summers or a typically cold winter. Don’t let that fool you.
Our new peer-reviewed study, published by the National Academy of Sciences, makes clear that while average global temperature has been steadily rising due to a warming climate (up about 1.5 degrees Fahrenheit in the past century), the extremes are actually becoming much more frequent and more intense worldwide.
When we plotted the world’s changing temperatures on a bell curve, the extremes of unusually cool and, even more, the extremes of unusually hot are being altered so they are becoming both more common and more severe.
The change is so dramatic that one face of the die must now represent extreme weather to illustrate the greater frequency of extremely hot weather events.
Such events used to be exceedingly rare. Extremely hot temperatures covered about 0.1 percent to 0.2 percent of the globe in the base period of our study, from 1951 to 1980. In the last three decades, while the average temperature has slowly risen, the extremes have soared and now cover about 10 ?percent of the globe.
This is the world we have changed, and now we have to live in it — the world that caused the 2003 heat wave in Europe that killed more than 50,000 people and the 2011 drought in Texas that caused more than $5 billion in damage [ http://money.cnn.com/2011/09/08/news/economy/damages_texas_wildfires/index.htm ]. Such events, our data show, will become even more frequent and more severe.
There is still time to act and avoid a worsening climate, but we are wasting precious time. We can solve the challenge of climate change with a gradually rising fee on carbon collected from fossil-fuel companies, with 100?percent of the money rebated to all legal residents on a per capita basis. This would stimulate innovations and create a robust clean-energy economy with millions of new jobs. It is a simple, honest and effective solution.
The future is now. And it is hot.
© 2012 The Washington Post
http://www.washingtonpost.com/opinions/climate-change-is-here--and-worse-than-we-thought/2012/08/03/6ae604c2-dd90-11e1-8e43-4a3c4375504a_story.html [with comments]
===
Study Finds More of Earth Is Hotter and Says Global Warming Is at Work

A Texas State Park police officer walked across the lake bed of O.C. Fisher Lake in San Angelo, Texas. A new scientific paper says that the drought and other recent extreme weather events have been caused by global warming.
Tony Gutierrez/Associated Press

James E. Hansen, a NASA scientist, led a study that says it is nearly certain that recent extremes wouldn't have occurred without the release of greenhouse gas.
Mary Altaffer/Associated Press

Smog from peat fires outside Moscow hung over Red Square during a heat wave in 2010.
James Hill for The New York Times
By JUSTIN GILLIS
Published: August 6, 2012
The percentage of the earth’s land surface covered by extreme heat in the summer has soared in recent decades, from less than 1 percent in the years before 1980 to as much as 13 percent in recent years, according to a new scientific paper [ http://www.pnas.org/content/early/2012/07/30/1205276109.abstract ].
The change is so drastic, the paper says, that scientists can claim with near certainty that events like the Texas heat wave last year [ http://www.nytimes.com/2011/07/22/us/22heatintro.html ], the Russian heat wave of 2010 [ http://www.nytimes.com/2010/07/31/world/europe/31russia.html ] and the European heat wave of 2003 [ http://www.nytimes.com/2003/08/06/world/europe-sizzles-and-suffers-in-a-summer-of-merciless-heat.html ] would not have happened without the planetary warming caused by the human release of greenhouse gases.
Those claims, which go beyond the established scientific consensus about the role of climate change [ http://topics.nytimes.com/top/news/science/topics/globalwarming/index.html ] in causing weather extremes, were advanced by James E. Hansen [ http://topics.nytimes.com/top/reference/timestopics/people/h/james_e_hansen/index.html ], a prominent NASA [ http://topics.nytimes.com/top/reference/timestopics/organizations/n/national_aeronautics_and_space_administration/index.html ] climate scientist, and two co-authors in a scientific paper [ http://www.pnas.org/content/early/2012/07/30/1205276109.abstract ] published online on Monday in the Proceedings of the National Academy of Sciences [ http://topics.nytimes.com/top/reference/timestopics/organizations/p/proceedings_of_the_national_academy_of_sciences/index.html ].
“The main thing is just to look at the statistics and see that the change is too large to be natural,” Dr. Hansen said in an interview. The findings [ http://www.nasa.gov/topics/earth/features/warming-links.html ] provoked an immediate split among his scientific colleagues, however.
Some experts said he had come up with a smart new way of understanding the magnitude of the heat extremes that people around the world are noticing. Others suggested that he had presented a weak statistical case for his boldest claims and that the rest of the paper contained little that had not been observed in the scientific literature for years.
The divide is characteristic of the strong reactions that Dr. Hansen has elicited playing dual roles in the debate over climate change and how to combat it. As the head of the Goddard Institute for Space Studies in Manhattan [ http://www.giss.nasa.gov/ ], he is one of NASA’s principal climate scientists and the primary custodian of its records of the earth’s temperature. Yet he has also become an activist who marches in protests to demand new government policies on energy and climate.
The latter role — he has been arrested four times at demonstrations, always while on leave from his government job — has made him a hero to the political left, and particularly to college students involved in climate activism. But it has discomfited some of his fellow researchers, who fear that his political activities may be sowing unnecessary doubts about his scientific findings and climate science in general.
Climate-change skeptics routinely accuse Dr. Hansen of manipulating the temperature record to make global warming seem more serious, although there is no proof that he has done so and the warming trend has repeatedly been confirmed by other researchers.
Scientists have long believed that the warming — roughly 2.5 degrees Fahrenheit over land in the past century, with most of that occurring since 1980 — was caused largely by the human release of greenhouse gases from burning fossil fuels. Such emissions have increased the likelihood of heat waves and some other types of weather extremes, like heavy rains and snowstorms, they say.
But researchers have struggled with the question of whether any particular heat wave or storm can be definitively linked to human-induced climate change.
In the new paper, titled “Perception of Climate Change,” Dr. Hansen and his co-authors compared the global climate of 1951 to 1980, before the bulk of global warming had occurred, with the climate of the years 1981 to 2011.
They computed how much of the earth’s land surface in each period was subjected in June, July and August to heat that would have been considered particularly extreme in the period from 1951 to 1980. In that era, they found, only 0.2 percent of the land surface was subjected to extreme summer heat. But from 2006 to 2011, extreme heat covered from 4 to 13 percent of the world, they found.
“It confirms people’s suspicions that things are happening” to the climate, Dr. Hansen said in the interview. “It’s just going to get worse.”
The findings led his team to assert that the big heat waves and droughts of recent years were a direct consequence of climate change. The authors did not offer formal proof of the sort favored by many climate scientists, instead presenting what amounted to a circumstantial case that the background warming was the only plausible cause of those individual heat extremes.
Dr. Hansen said the heat wave and drought afflicting the country this year were also a likely consequence of climate change.
Some experts said they found the arguments persuasive. Andrew J. Weaver [ http://climate.uvic.ca/people/weaver/ ], a climate scientist at the University of Victoria in British Columbia who reviewed the paper before publication, compared the warming of recent years to a measles outbreak popping up in different places. As with a measles epidemic, he said, it makes sense to suspect a common cause.
“You can actually start to see these patterns emerging whereby in any given year more and more of the globe is covered by anomalously warm events,” Dr. Weaver said.
But some other scientists described the Hansen paper as a muddle. Claudia Tebaldi [ http://www.image.ucar.edu/~tebaldi/research.html ], a scientist with an organization called Climate Central [ http://www.climatecentral.org/ ] that seeks to make climate research accessible to the public, said she felt that the paper was on solid ground in asserting a greater overall likelihood of heat waves as a consequence of global warming, but that the finding was not new. The paper’s attribution of specific heat waves to climate change was not backed by persuasive evidence, she said.
Martin P. Hoerling [ http://www.esrl.noaa.gov/psd/people/martin.hoerling/ ], a researcher with the National Oceanic and Atmospheric Administration who studies the causes of weather extremes, said he shared Dr. Hansen’s general concern about global warming. But he has in the past criticized Dr. Hansen for, in his view, exaggerating the connection between global warming and specific weather extremes. In an interview, he said he felt that Dr. Hansen had done so again.
Dr. Hoerling has published research suggesting that the 2010 Russian heat wave was largely a consequence of natural climate variability, and a forthcoming study he carried out on the Texas drought of 2011 also says natural factors were the main cause.
Dr. Hoerling contended that Dr. Hansen’s new paper confuses drought, caused primarily by a lack of rainfall, with heat waves.
“This isn’t a serious science paper,” Dr. Hoerling said. “It’s mainly about perception, as indicated by the paper’s title. Perception is not a science.”
*
Related
The Agenda: Planet: How to Parse Climate Change and Extreme Weather? (August 7, 2012)
http://green.blogs.nytimes.com/2012/08/07/how-to-parse-climate-change-and-extreme-weather/
Weather Extremes Leave Parts of U.S. Grid Buckling (July 26, 2012)
http://www.nytimes.com/2012/07/26/us/rise-in-weather-extremes-threatens-infrastructure.html
*
© 2012 The New York Times Company
http://www.nytimes.com/2012/08/07/science/earth/extreme-heat-is-covering-more-of-the-earth-a-study-says.html
===
July 2012: hottest month on record for contiguous United States
Drought expands to cover nearly 63% of the Lower 48; wildfires consume 2 million acres
State of the Climate
National Oceanic and Atmospheric Administration
National Climatic Data Center
The average temperature for the contiguous U.S. during July was 77.6°F, 3.3°F above the 20th century average, marking the hottest July and the hottest month on record for the nation. The previous warmest July for the nation was July 1936 when the average U.S. temperature was 77.4°F. The warm July temperatures contributed to a record-warm first seven months of the year and the warmest 12-month period the nation has experienced since recordkeeping began in 1895.
Precipitation totals were mixed during July, with the contiguous U.S. as a whole being drier than average. The nationally averaged precipitation total of 2.57 inches was 0.19 inch below average. Near-record dry conditions were present for the middle of the nation, with the drought footprint expanding to cover nearly 63 percent of the Lower 48, according the U.S. Drought Monitor [ http://www.drought.gov/ ].

Significant climate events for July 2012. Click here [ http://www.ncdc.noaa.gov/sotc/national/2012/7 ] for the National Overview.
Note: The July Monthly Climate Report for the United States has several pages of supplemental information and data [ http://www.ncdc.noaa.gov/sotc/national/2012/7/supplemental ] regarding some of the exceptional events from the month and season.
U.S. climate highlights: July
• Higher-than-average temperatures engulfed much of the contiguous U.S. during July, with the largest temperature departures from the 20th century average occurring across most of the Plains, the Midwest, and along the Eastern Seaboard. Virginia had its warmest July on record, with a statewide temperature 4.0°F above average. In total, 32 states had July temperatures among its ten warmest, with seven states having their second warmest July on record.
• Drier-than-average conditions continued across the Central Plains and Midwest during July. Nebraska, Iowa, Illinois, and Missouri had July precipitation totals ranking among their ten driest. Maine had its fifth driest July on record.
• An active storm pattern in the Southwest contributed to California having its fifth wettest July on record and Nevada having its eighth wettest. Wetter-than-average conditions were also observed through the rest of the Southwest, along the western Gulf Coast, and through the Ohio Valley where West Virginia had its tenth wettest July.
• The warm and dry conditions over a large portion of the country were associated with ideal wildfire conditions. Over 2 million acres were burned nationwide during July due to wildfires, nearly half a million acres above average, and the fourth most on record since 2000.
• A list of select July temperature and precipitation records can be found here [ http://www1.ncdc.noaa.gov/pub/data/cmb/images/us/2012/jul/jul2012-monthly-extre.pdf ].
Drought conditions update
• The May-July months, an important period for agriculture, was the second warmest and 12th driest such three-months for the Lower 48, contributing to rapid expansion of drought. The central regions of the country were hardest hit by the drought, where ten states had three-month precipitation totals among their ten driest, including Nebraska, Kansas, and Arkansas which were record dry.
• According to the July 31, 2012, U.S. Drought Monitor (USDM), 62.9 percent of the contiguous U.S. was experiencing moderate to exceptional drought at the end of July. This is an increase of about 6.9 percent compared to the end of June. The maximum value of 63.9 percent reached on July 24 is a record in the 13-year history of the USDM.
• The area of the country in the worst drought categories (extreme to exceptional drought) doubled from 10 percent last month to 22 percent this month. The extreme dryness and excessive heat devastated crops and livestock from the Great Plains to Midwest.
• The Primary Corn and Soybean Agricultural Belt, hard hit by drought, experienced its eighth driest July, third driest June-July, and sixth driest April-July (growing season) in the 1895-2012 record.
• According to the Palmer Drought Severity Index, whose record spans the 20th century, about 57 percent of the contiguous U.S. was experiencing moderate-to-extreme drought in July. The last drought this extensive was in December 1956 when about 58 percent of the nation was in moderate-to-extreme drought.
Year-to-date: January-July

Year-to-date temperature, by month, for 2012 (red), compared to the other 117 years on record for the contiguous U.S., with the five ultimately warmest years (orange) and five ultimately coolest years (blue) noted. The 2012 data are still preliminary. Please click here [ http://www.ncdc.noaa.gov/sotc/national/2012/7/supplemental/page-5 ] for a more thorough explanation.
• The January-July period was the warmest first seven months of any year on record for the contiguous United States. The national temperature of 56.4°F was 4.3°F above the long-term average. Most of the contiguous U.S. was record and near-record warm for the seven-month period, except the Pacific Northwest, which was near average.
• The first seven months of 2012 were drier than average, ranking as 15th driest January-July on record. Below-average precipitation totals were observed for a large portion of the country, with 12 states having January-July precipitation totals among their ten driest. Above-average precipitation was observed for the Upper Midwest and the Pacific Northwest.
• The U.S. Climate Extremes Index (USCEI), an index that tracks the highest and lowest 10 percent of extremes in temperature, precipitation, drought and tropical cyclones across the contiguous U.S., was a record-large 46 percent during the January-July period, over twice the average value, and surpassing the previous record large CEI of 42 percent which occurred in 1934. Extremes in warm daytime temperatures (83 percent) and warm nighttime temperatures (74 percent) both covered record large areas of the nation, contributing to the record high year-to-date USCEI value.
12-month period: August 2011-July 2012

The ten warmest 12-month periods of the U.S. record. Click here [ http://www.ncdc.noaa.gov/sotc/national/2012/6/supplemental/page-4 ] for expanded information.
• The August 2011-July 2012 period was the warmest 12-month period of any 12-months on record for the contiguous U.S., narrowly surpassing the record broken last month for the July 2011-June 2012 period by 0.07°F. The nationally averaged temperature of 56.1°F was 3.3°F above the long term average. Except Washington, which was near average, every state across the contiguous U.S. had warmer than average temperatures for the period.
[currently at] http://www.ncdc.noaa.gov/sotc/ ; full July 2012 report at http://www.ncdc.noaa.gov/sotc/national/2012/7
===
Antarctica sunburn…And you think global warming is bad now?

Alarming: if Antarctica ever became as warm again, sea levels could rise 60 metres
02 August 2012
Palm trees swayed on the green shores of Antarctica 50 million years ago while temperatures soared above 20C, a study [ http://www.nature.com/nature/journal/v488/n7409/full/nature11300.html ] has shown.
The discovery provides a startling glimpse of what might be in store for the world in centuries to come if global warming continues unchecked.
If Antarctica ever became as warm again, sea levels could rise 60 metres (197 feet), swamping major coastal cities such as New York, Sydney and Hong Kong.
Scientists drilled a kilometre into the ocean floor to collect samples of fossilised pollen that have lain undisturbed for millions of years.
They revealed a vastly different version of Antarctica than exists today.
During the Eocene epoch, between 48 and 55 million years ago, high levels of greenhouse gas in the atmosphere forced up temperatures.
The UK was, on average, 15C warmer than it is today and a steaming rainforest covered the site of London.
But the most dramatic effect of the Eocene "greenhouse world" was seen at the poles, according to the new evidence.
Detailed examination of fossil-rich Antarctic sediments has not been possible before, since any remaining on land have been destroyed by glaciation or buried under thousands of metres of ice.
The new research involved an expedition to drill off Wilkes Land on the east coast of Antarctica.
Members of the 2010 Integrated Ocean Drilling Research Programme dropped a string of drill pipes through four kilometres of water to bore into the ocean floor.
Dr James Bendle, from the University of Glasgow, said: "The Eocene sediment samples are the first detailed evidence we have of what was happening on the Antarctic during this vitally important time.
"We conducted the drilling expedition against a backdrop of freezing temperatures, huge ocean swells, calving glaciers, snow-covered mountains and icebergs.
"It's amazing to imagine a time-traveller, arriving at the same coastline in the early Eocene, could paddle in pleasantly warm waters lapping at a lush forest."
Pollen from plants living in two different environments were found in the sediment cores.
One was a lowland, warm rainforest, dominated by tree-ferns, palms and trees belonging to the bombacaceae family.
Modern bombacaceae include the baobab tree of Madagascar, also known as the "tree of life" because it holds water in its thick trunk.
The other environment was an upland, mountain forest region with beech trees and conifers.
Pollen from both regions would have been washed, blown or transported by insects onto the shallow coastal shelf. Here, it settled in the mud and was preserved for 50 million years.
The pollen shows that average Eocene temperatures on the Antarctic coast were around 16C and summers reached a balmy 21C, the scientists reported in the journal Nature.
Winters were warmer than 10C even during the coldest and darkest months of the year. At this time in history Antarctica was almost in the same position it occupies today, covering the South Pole.
The winter months would have been dark, as they are today, but the weather was far warmer.
Organic molecules preserved from Eocene soil bacteria confirmed the temperature readings derived from pollen.
Dr Bendle added: "Our work carries a sobering message. Carbon dioxide levels were naturally high in the early Eocene, but today CO2 levels are rising rapidly through human combustion of fossil fuels and deforestation.
"We haven't reached Eocene levels yet but we are increasing at a rate faster than any time in Earth's history.
"Atmospherically speaking, we are heading rapidly back in time towards the Eocene. Already CO2 levels are at a peak not seen since the Pliocene warm period 3.5 million years ago.
"The biggest threat lies in the fact that Antarctica today is covered with ice, enough to potentially raise global sea-levels by 60 metres if the continent once again reaches Eocene temperatures, which would have devastating effects all over the world."
Lead author Professor Jvrg Pross, from Goethe University in Frankfurt, Germany, said: "If the current CO2 emissions continue unabated due to the burning of fossil fuels, CO2 concentrations in the atmosphere, as they existed in the distant past, are likely to be achieved within a few hundred years.
"By studying naturally-occurring climate warming periods in the geological past, our knowledge of the mechanisms and processes in the climate system increases. This contributes enormously to improving our understanding of current human-induced global warming."
© 2012 ES London Limited
http://www.standard.co.uk/news/world/antarctica-sunburnand-you-think-global-warming-is-bad-now-8000854.html [no comments yet]
--
Jungles in Antarctica? High CO2 levels contributed to tropical conditions on the icy continent 50M years ago
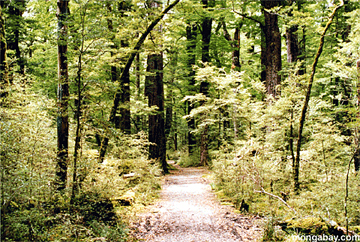
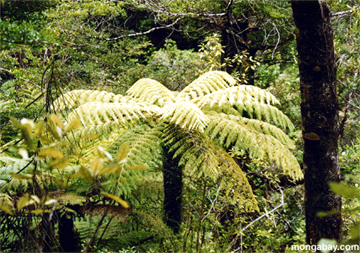
Temperate (top) and subtropical (bottom) vegetation in New Zealand.
Photos by Rhett A. Butler
mongabay.com
August 02, 2012
Tropical vegetation grew along the coast of Antarctica 52 million years ago, an indication to dramatic climate shifts linked to elevated carbon dioxide levels in the atmosphere, report [ http://www.nature.com/nature/journal/v488/n7409/full/nature11300.html ] scientists in Nature.
The research, led by a team from the Goethe University and the Biodiversity and Climate Research Centre in Frankfurt, Germany, is based on drill cores from the seafloor near Antarctica. The cores turned up evidence of tropical and sub-tropical species, including palms and relatives of Baobab trees, which thrived in a period when atmospheric CO2 levels were more than twice current levels. The authors used this data, together with signatures of soil bacteria, to reconstruct vegetation communities for parts of the icy continent.
The scientists say the findings are important given the current trend in CO2 levels, which are rising due to burning of fossil fuels.
“If the current CO2 emissions continue unabated due to the burning of fossil fuels, CO2 concentrations in the atmosphere, as they existed in the distant past, are likely to be achieved within a few hundred years”, said Pross, a paleoclimatologist at the Goethe University and member of the Biodiversity and Climate Research Centre, in a statement. “By studying naturally occurring climate warming periods in the geological past, our knowledge of the mechanisms and processes in the climate system increases. This contributes enormously to improving our understanding of current human-induced global warming.”
The research suggests the presence of tropical and subtropical rainforests in costal regions of Antarctica, with temperate rainforests similar to those in present-day New Zealand in the cooler interior. The forests survived despite the three months of polar night annually.
But it wasn't only elevated CO2 levels that drove the mild conditions in Antarctica.
“Another important factor was the transfer of heat via warm ocean currents that reached Antarctica,” said Pross.
"When the warm ocean current collapsed and the Antarctic coast came under the influence of cooler ocean currents, the tropical rainforests including palms and Baobab relatives also disappeared," concluded the statement from Goethe University.
CITATION: Pross, J., Contreras, L., Bijl, P.K., Greenwood, D.R., Bohaty, S.M., Schouten, S., Bendle, J.A., Röhl, U., Tauxe, L., Raine, J.I., Huck, C.E., van de Flierdt, T., Jamieson, S.S.R., Stickley, C.E., van de Schootbrugge, B., Escutia, C., Brinkhuis, H., IODP Expedition 318 Scientists (2012): Persistent near-tropical warmth on the Antarctic continent during the early Eocene epoch. Nature, DOI: 10.1038/nature11300 [ http://www.nature.com/nature/journal/v488/n7409/full/nature11300.html ]
Copyright mongabay 2012
http://news.mongabay.com/2012/0802-jungles-antarctica.html [no comments yet]
===
Rare snowfall stuns much of South Africa

A man slides down a hill after a rare snowfall in Johannesburg, South Africa, on Tuesday, Aug. 7, 2012. Temperatures dropped to below freezing Tuesday morning as snow flurries blew through South Africa's commercial hub Johannesburg, dusting the city in white as residents poured into the streets to watch the snowflakes fall.
(AP Photo/Themba Hadebe)
By JON GAMBRELL
Associated Press
Aug 7, 5:06 PM EDT
JOHANNESBURG (AP) -- People slowly came outside despite the cold wind Tuesday across South Africa, pointed their mobile phone cameras to the sky and opened their mouths to taste a rare snowfall that fell on much of the country.
The snow began Tuesday morning, part of an extreme cold snap now biting into a nation still in its winter months. By mid-afternoon, officials recorded snowfall across most of South Africa. However, forecasters acknowledged snow remains so unusual that they typically aren't prepared to provide details about snowfall in the nation.
The snow closed some roads and at least one high-altitude pass. The snowfall also closed several border posts in the country.
As the snow fell, workers at offices in Johannesburg rushed outside. Some twirled and danced as the flakes fell. One man rushed to the top of a snow-covered hill and slid down, using a cardboard box as an improvised toboggan. Despite the cold and the snow, beggars who line traffic lights in the city continued to ask passing motorists for cash.
The snow grew heavier in the afternoon in Johannesburg, covering rooftops and slicking roads. Snowflakes are a rare commodity in Johannesburg, even during winter. South African Weather Service records show it has snowed in Johannesburg on only 22 other days in the last 103 years. The last snow fell there in June 2007.
In Pretoria, the country's capital, flurries filled the sky during a visit by U.S. Secretary of State Hillary Rodham Clinton. It was the first snowfall there since 1968, the weather service said.
The cold weather is expected to last a few days.
*
Online:
South African Weather Service: http://www.weathersa.co.za
© 2012 The Associated Press
http://hosted.ap.org/dynamic/stories/A/AF_SOUTH_AFRICA_SNOW?SITE=AP&SECTION=HOME&TEMPLATE=DEFAULT&CTIME=2012-08-07-17-06-15
--
In pictures: Rare snow in Johannesburg
7 August 2012 Last updated at 14:24 ET


[more at] http://www.bbc.co.uk/news/world-africa-19163119
===
(linked in):
http://investorshub.advfn.com/boards/read_msg.aspx?message_id=73648242 and following
http://investorshub.advfn.com/boards/read_msg.aspx?message_id=78389915 and preceding and following

[ http://www.washingtonpost.com/opinions/tom-toles-goes-green/2011/03/31/AFD04K0D_gallery.html ]
By James E. Hansen, Published: August 3, 2012
James E. Hansen directs the NASA Goddard Institute for Space Studies.
When I testified before the Senate in the hot summer of 1988 [ http://www.nytimes.com/1988/06/24/us/global-warming-has-begun-expert-tells-senate.html?pagewanted=all ], I warned of the kind of future that climate change would bring to us and our planet. I painted a grim picture of the consequences of steadily increasing temperatures, driven by mankind’s use of fossil fuels.
But I have a confession to make: I was too optimistic.
My projections about increasing global temperature have been proved true. But I failed to fully explore how quickly that average rise would drive an increase in extreme weather.
In a new analysis of the past six decades of global temperatures, which will be published Monday, my colleagues and I have revealed a stunning increase in the frequency of extremely hot summers, with deeply troubling ramifications for not only our future but also for our present.
This is not a climate model or a prediction but actual observations of weather events and temperatures that have happened. Our analysis shows that it is no longer enough to say that global warming will increase the likelihood of extreme weather and to repeat the caveat that no individual weather event can be directly linked to climate change. To the contrary, our analysis shows that, for the extreme hot weather of the recent past, there is virtually no explanation other than climate change.
The deadly European heat wave of 2003 [ http://www.washingtonpost.com/wp-dyn/articles/A26605-2004Dec1.html ], the fiery Russian heat wave of 2010 [ http://www.esrl.noaa.gov/psd/csi/events/2010/russianheatwave/ ] and catastrophic droughts in Texas and Oklahoma [ http://www.washingtonpost.com/blogs/capital-weather-gang/post/severe-us-drought-sets-another-record-costs-to-us-economy-upward-of-15-billion/2011/08/01/gIQA7cQbpI_blog.html ] last year can each be attributed to climate change. And once the data are gathered in a few weeks’ time, it’s likely that the same will be true for the extremely hot summer [ http://www.washingtonpost.com/national/health-science/drought-intensifies-in-most-parched-areas-of-us/2012/08/02/gJQAc334RX_story.html ] the United States is suffering through right now.
These weather events are not simply an example of what climate change could bring. They are caused by climate change. The odds that natural variability created these extremes are minuscule, vanishingly small. To count on those odds would be like quitting your job and playing the lottery every morning to pay the bills.
Twenty-four years ago, I introduced the concept of “climate dice” to help distinguish the long-term trend of climate change from the natural variability of day-to-day weather. Some summers are hot, some cool. Some winters brutal, some mild. That’s natural variability.
But as the climate warms, natural variability is altered, too. In a normal climate without global warming, two sides of the die would represent cooler-than-normal weather, two sides would be normal weather, and two sides would be warmer-than-normal weather. Rolling the die again and again, or season after season, you would get an equal variation of weather over time.
But loading the die with a warming climate changes the odds. You end up with only one side cooler than normal, one side average, and four sides warmer than normal. Even with climate change, you will occasionally see cooler-than-normal summers or a typically cold winter. Don’t let that fool you.
Our new peer-reviewed study, published by the National Academy of Sciences, makes clear that while average global temperature has been steadily rising due to a warming climate (up about 1.5 degrees Fahrenheit in the past century), the extremes are actually becoming much more frequent and more intense worldwide.
When we plotted the world’s changing temperatures on a bell curve, the extremes of unusually cool and, even more, the extremes of unusually hot are being altered so they are becoming both more common and more severe.
The change is so dramatic that one face of the die must now represent extreme weather to illustrate the greater frequency of extremely hot weather events.
Such events used to be exceedingly rare. Extremely hot temperatures covered about 0.1 percent to 0.2 percent of the globe in the base period of our study, from 1951 to 1980. In the last three decades, while the average temperature has slowly risen, the extremes have soared and now cover about 10 ?percent of the globe.
This is the world we have changed, and now we have to live in it — the world that caused the 2003 heat wave in Europe that killed more than 50,000 people and the 2011 drought in Texas that caused more than $5 billion in damage [ http://money.cnn.com/2011/09/08/news/economy/damages_texas_wildfires/index.htm ]. Such events, our data show, will become even more frequent and more severe.
There is still time to act and avoid a worsening climate, but we are wasting precious time. We can solve the challenge of climate change with a gradually rising fee on carbon collected from fossil-fuel companies, with 100?percent of the money rebated to all legal residents on a per capita basis. This would stimulate innovations and create a robust clean-energy economy with millions of new jobs. It is a simple, honest and effective solution.
The future is now. And it is hot.
© 2012 The Washington Post
http://www.washingtonpost.com/opinions/climate-change-is-here--and-worse-than-we-thought/2012/08/03/6ae604c2-dd90-11e1-8e43-4a3c4375504a_story.html [with comments]
===
Study Finds More of Earth Is Hotter and Says Global Warming Is at Work

A Texas State Park police officer walked across the lake bed of O.C. Fisher Lake in San Angelo, Texas. A new scientific paper says that the drought and other recent extreme weather events have been caused by global warming.
Tony Gutierrez/Associated Press

James E. Hansen, a NASA scientist, led a study that says it is nearly certain that recent extremes wouldn't have occurred without the release of greenhouse gas.
Mary Altaffer/Associated Press

Smog from peat fires outside Moscow hung over Red Square during a heat wave in 2010.
James Hill for The New York Times
By JUSTIN GILLIS
Published: August 6, 2012
The percentage of the earth’s land surface covered by extreme heat in the summer has soared in recent decades, from less than 1 percent in the years before 1980 to as much as 13 percent in recent years, according to a new scientific paper [ http://www.pnas.org/content/early/2012/07/30/1205276109.abstract ].
The change is so drastic, the paper says, that scientists can claim with near certainty that events like the Texas heat wave last year [ http://www.nytimes.com/2011/07/22/us/22heatintro.html ], the Russian heat wave of 2010 [ http://www.nytimes.com/2010/07/31/world/europe/31russia.html ] and the European heat wave of 2003 [ http://www.nytimes.com/2003/08/06/world/europe-sizzles-and-suffers-in-a-summer-of-merciless-heat.html ] would not have happened without the planetary warming caused by the human release of greenhouse gases.
Those claims, which go beyond the established scientific consensus about the role of climate change [ http://topics.nytimes.com/top/news/science/topics/globalwarming/index.html ] in causing weather extremes, were advanced by James E. Hansen [ http://topics.nytimes.com/top/reference/timestopics/people/h/james_e_hansen/index.html ], a prominent NASA [ http://topics.nytimes.com/top/reference/timestopics/organizations/n/national_aeronautics_and_space_administration/index.html ] climate scientist, and two co-authors in a scientific paper [ http://www.pnas.org/content/early/2012/07/30/1205276109.abstract ] published online on Monday in the Proceedings of the National Academy of Sciences [ http://topics.nytimes.com/top/reference/timestopics/organizations/p/proceedings_of_the_national_academy_of_sciences/index.html ].
“The main thing is just to look at the statistics and see that the change is too large to be natural,” Dr. Hansen said in an interview. The findings [ http://www.nasa.gov/topics/earth/features/warming-links.html ] provoked an immediate split among his scientific colleagues, however.
Some experts said he had come up with a smart new way of understanding the magnitude of the heat extremes that people around the world are noticing. Others suggested that he had presented a weak statistical case for his boldest claims and that the rest of the paper contained little that had not been observed in the scientific literature for years.
The divide is characteristic of the strong reactions that Dr. Hansen has elicited playing dual roles in the debate over climate change and how to combat it. As the head of the Goddard Institute for Space Studies in Manhattan [ http://www.giss.nasa.gov/ ], he is one of NASA’s principal climate scientists and the primary custodian of its records of the earth’s temperature. Yet he has also become an activist who marches in protests to demand new government policies on energy and climate.
The latter role — he has been arrested four times at demonstrations, always while on leave from his government job — has made him a hero to the political left, and particularly to college students involved in climate activism. But it has discomfited some of his fellow researchers, who fear that his political activities may be sowing unnecessary doubts about his scientific findings and climate science in general.
Climate-change skeptics routinely accuse Dr. Hansen of manipulating the temperature record to make global warming seem more serious, although there is no proof that he has done so and the warming trend has repeatedly been confirmed by other researchers.
Scientists have long believed that the warming — roughly 2.5 degrees Fahrenheit over land in the past century, with most of that occurring since 1980 — was caused largely by the human release of greenhouse gases from burning fossil fuels. Such emissions have increased the likelihood of heat waves and some other types of weather extremes, like heavy rains and snowstorms, they say.
But researchers have struggled with the question of whether any particular heat wave or storm can be definitively linked to human-induced climate change.
In the new paper, titled “Perception of Climate Change,” Dr. Hansen and his co-authors compared the global climate of 1951 to 1980, before the bulk of global warming had occurred, with the climate of the years 1981 to 2011.
They computed how much of the earth’s land surface in each period was subjected in June, July and August to heat that would have been considered particularly extreme in the period from 1951 to 1980. In that era, they found, only 0.2 percent of the land surface was subjected to extreme summer heat. But from 2006 to 2011, extreme heat covered from 4 to 13 percent of the world, they found.
“It confirms people’s suspicions that things are happening” to the climate, Dr. Hansen said in the interview. “It’s just going to get worse.”
The findings led his team to assert that the big heat waves and droughts of recent years were a direct consequence of climate change. The authors did not offer formal proof of the sort favored by many climate scientists, instead presenting what amounted to a circumstantial case that the background warming was the only plausible cause of those individual heat extremes.
Dr. Hansen said the heat wave and drought afflicting the country this year were also a likely consequence of climate change.
Some experts said they found the arguments persuasive. Andrew J. Weaver [ http://climate.uvic.ca/people/weaver/ ], a climate scientist at the University of Victoria in British Columbia who reviewed the paper before publication, compared the warming of recent years to a measles outbreak popping up in different places. As with a measles epidemic, he said, it makes sense to suspect a common cause.
“You can actually start to see these patterns emerging whereby in any given year more and more of the globe is covered by anomalously warm events,” Dr. Weaver said.
But some other scientists described the Hansen paper as a muddle. Claudia Tebaldi [ http://www.image.ucar.edu/~tebaldi/research.html ], a scientist with an organization called Climate Central [ http://www.climatecentral.org/ ] that seeks to make climate research accessible to the public, said she felt that the paper was on solid ground in asserting a greater overall likelihood of heat waves as a consequence of global warming, but that the finding was not new. The paper’s attribution of specific heat waves to climate change was not backed by persuasive evidence, she said.
Martin P. Hoerling [ http://www.esrl.noaa.gov/psd/people/martin.hoerling/ ], a researcher with the National Oceanic and Atmospheric Administration who studies the causes of weather extremes, said he shared Dr. Hansen’s general concern about global warming. But he has in the past criticized Dr. Hansen for, in his view, exaggerating the connection between global warming and specific weather extremes. In an interview, he said he felt that Dr. Hansen had done so again.
Dr. Hoerling has published research suggesting that the 2010 Russian heat wave was largely a consequence of natural climate variability, and a forthcoming study he carried out on the Texas drought of 2011 also says natural factors were the main cause.
Dr. Hoerling contended that Dr. Hansen’s new paper confuses drought, caused primarily by a lack of rainfall, with heat waves.
“This isn’t a serious science paper,” Dr. Hoerling said. “It’s mainly about perception, as indicated by the paper’s title. Perception is not a science.”
*
Related
The Agenda: Planet: How to Parse Climate Change and Extreme Weather? (August 7, 2012)
http://green.blogs.nytimes.com/2012/08/07/how-to-parse-climate-change-and-extreme-weather/
Weather Extremes Leave Parts of U.S. Grid Buckling (July 26, 2012)
http://www.nytimes.com/2012/07/26/us/rise-in-weather-extremes-threatens-infrastructure.html
*
© 2012 The New York Times Company
http://www.nytimes.com/2012/08/07/science/earth/extreme-heat-is-covering-more-of-the-earth-a-study-says.html
===
July 2012: hottest month on record for contiguous United States
Drought expands to cover nearly 63% of the Lower 48; wildfires consume 2 million acres
State of the Climate
National Oceanic and Atmospheric Administration
National Climatic Data Center
The average temperature for the contiguous U.S. during July was 77.6°F, 3.3°F above the 20th century average, marking the hottest July and the hottest month on record for the nation. The previous warmest July for the nation was July 1936 when the average U.S. temperature was 77.4°F. The warm July temperatures contributed to a record-warm first seven months of the year and the warmest 12-month period the nation has experienced since recordkeeping began in 1895.
Precipitation totals were mixed during July, with the contiguous U.S. as a whole being drier than average. The nationally averaged precipitation total of 2.57 inches was 0.19 inch below average. Near-record dry conditions were present for the middle of the nation, with the drought footprint expanding to cover nearly 63 percent of the Lower 48, according the U.S. Drought Monitor [ http://www.drought.gov/ ].

Significant climate events for July 2012. Click here [ http://www.ncdc.noaa.gov/sotc/national/2012/7 ] for the National Overview.
Note: The July Monthly Climate Report for the United States has several pages of supplemental information and data [ http://www.ncdc.noaa.gov/sotc/national/2012/7/supplemental ] regarding some of the exceptional events from the month and season.
U.S. climate highlights: July


• Higher-than-average temperatures engulfed much of the contiguous U.S. during July, with the largest temperature departures from the 20th century average occurring across most of the Plains, the Midwest, and along the Eastern Seaboard. Virginia had its warmest July on record, with a statewide temperature 4.0°F above average. In total, 32 states had July temperatures among its ten warmest, with seven states having their second warmest July on record.
• Drier-than-average conditions continued across the Central Plains and Midwest during July. Nebraska, Iowa, Illinois, and Missouri had July precipitation totals ranking among their ten driest. Maine had its fifth driest July on record.
• An active storm pattern in the Southwest contributed to California having its fifth wettest July on record and Nevada having its eighth wettest. Wetter-than-average conditions were also observed through the rest of the Southwest, along the western Gulf Coast, and through the Ohio Valley where West Virginia had its tenth wettest July.
• The warm and dry conditions over a large portion of the country were associated with ideal wildfire conditions. Over 2 million acres were burned nationwide during July due to wildfires, nearly half a million acres above average, and the fourth most on record since 2000.
• A list of select July temperature and precipitation records can be found here [ http://www1.ncdc.noaa.gov/pub/data/cmb/images/us/2012/jul/jul2012-monthly-extre.pdf ].
Drought conditions update
• The May-July months, an important period for agriculture, was the second warmest and 12th driest such three-months for the Lower 48, contributing to rapid expansion of drought. The central regions of the country were hardest hit by the drought, where ten states had three-month precipitation totals among their ten driest, including Nebraska, Kansas, and Arkansas which were record dry.
• According to the July 31, 2012, U.S. Drought Monitor (USDM), 62.9 percent of the contiguous U.S. was experiencing moderate to exceptional drought at the end of July. This is an increase of about 6.9 percent compared to the end of June. The maximum value of 63.9 percent reached on July 24 is a record in the 13-year history of the USDM.
• The area of the country in the worst drought categories (extreme to exceptional drought) doubled from 10 percent last month to 22 percent this month. The extreme dryness and excessive heat devastated crops and livestock from the Great Plains to Midwest.
• The Primary Corn and Soybean Agricultural Belt, hard hit by drought, experienced its eighth driest July, third driest June-July, and sixth driest April-July (growing season) in the 1895-2012 record.
• According to the Palmer Drought Severity Index, whose record spans the 20th century, about 57 percent of the contiguous U.S. was experiencing moderate-to-extreme drought in July. The last drought this extensive was in December 1956 when about 58 percent of the nation was in moderate-to-extreme drought.
Year-to-date: January-July

Year-to-date temperature, by month, for 2012 (red), compared to the other 117 years on record for the contiguous U.S., with the five ultimately warmest years (orange) and five ultimately coolest years (blue) noted. The 2012 data are still preliminary. Please click here [ http://www.ncdc.noaa.gov/sotc/national/2012/7/supplemental/page-5 ] for a more thorough explanation.
• The January-July period was the warmest first seven months of any year on record for the contiguous United States. The national temperature of 56.4°F was 4.3°F above the long-term average. Most of the contiguous U.S. was record and near-record warm for the seven-month period, except the Pacific Northwest, which was near average.
• The first seven months of 2012 were drier than average, ranking as 15th driest January-July on record. Below-average precipitation totals were observed for a large portion of the country, with 12 states having January-July precipitation totals among their ten driest. Above-average precipitation was observed for the Upper Midwest and the Pacific Northwest.
• The U.S. Climate Extremes Index (USCEI), an index that tracks the highest and lowest 10 percent of extremes in temperature, precipitation, drought and tropical cyclones across the contiguous U.S., was a record-large 46 percent during the January-July period, over twice the average value, and surpassing the previous record large CEI of 42 percent which occurred in 1934. Extremes in warm daytime temperatures (83 percent) and warm nighttime temperatures (74 percent) both covered record large areas of the nation, contributing to the record high year-to-date USCEI value.
12-month period: August 2011-July 2012

The ten warmest 12-month periods of the U.S. record. Click here [ http://www.ncdc.noaa.gov/sotc/national/2012/6/supplemental/page-4 ] for expanded information.
• The August 2011-July 2012 period was the warmest 12-month period of any 12-months on record for the contiguous U.S., narrowly surpassing the record broken last month for the July 2011-June 2012 period by 0.07°F. The nationally averaged temperature of 56.1°F was 3.3°F above the long term average. Except Washington, which was near average, every state across the contiguous U.S. had warmer than average temperatures for the period.
[currently at] http://www.ncdc.noaa.gov/sotc/ ; full July 2012 report at http://www.ncdc.noaa.gov/sotc/national/2012/7
===
Antarctica sunburn…And you think global warming is bad now?

Alarming: if Antarctica ever became as warm again, sea levels could rise 60 metres
02 August 2012
Palm trees swayed on the green shores of Antarctica 50 million years ago while temperatures soared above 20C, a study [ http://www.nature.com/nature/journal/v488/n7409/full/nature11300.html ] has shown.
The discovery provides a startling glimpse of what might be in store for the world in centuries to come if global warming continues unchecked.
If Antarctica ever became as warm again, sea levels could rise 60 metres (197 feet), swamping major coastal cities such as New York, Sydney and Hong Kong.
Scientists drilled a kilometre into the ocean floor to collect samples of fossilised pollen that have lain undisturbed for millions of years.
They revealed a vastly different version of Antarctica than exists today.
During the Eocene epoch, between 48 and 55 million years ago, high levels of greenhouse gas in the atmosphere forced up temperatures.
The UK was, on average, 15C warmer than it is today and a steaming rainforest covered the site of London.
But the most dramatic effect of the Eocene "greenhouse world" was seen at the poles, according to the new evidence.
Detailed examination of fossil-rich Antarctic sediments has not been possible before, since any remaining on land have been destroyed by glaciation or buried under thousands of metres of ice.
The new research involved an expedition to drill off Wilkes Land on the east coast of Antarctica.
Members of the 2010 Integrated Ocean Drilling Research Programme dropped a string of drill pipes through four kilometres of water to bore into the ocean floor.
Dr James Bendle, from the University of Glasgow, said: "The Eocene sediment samples are the first detailed evidence we have of what was happening on the Antarctic during this vitally important time.
"We conducted the drilling expedition against a backdrop of freezing temperatures, huge ocean swells, calving glaciers, snow-covered mountains and icebergs.
"It's amazing to imagine a time-traveller, arriving at the same coastline in the early Eocene, could paddle in pleasantly warm waters lapping at a lush forest."
Pollen from plants living in two different environments were found in the sediment cores.
One was a lowland, warm rainforest, dominated by tree-ferns, palms and trees belonging to the bombacaceae family.
Modern bombacaceae include the baobab tree of Madagascar, also known as the "tree of life" because it holds water in its thick trunk.
The other environment was an upland, mountain forest region with beech trees and conifers.
Pollen from both regions would have been washed, blown or transported by insects onto the shallow coastal shelf. Here, it settled in the mud and was preserved for 50 million years.
The pollen shows that average Eocene temperatures on the Antarctic coast were around 16C and summers reached a balmy 21C, the scientists reported in the journal Nature.
Winters were warmer than 10C even during the coldest and darkest months of the year. At this time in history Antarctica was almost in the same position it occupies today, covering the South Pole.
The winter months would have been dark, as they are today, but the weather was far warmer.
Organic molecules preserved from Eocene soil bacteria confirmed the temperature readings derived from pollen.
Dr Bendle added: "Our work carries a sobering message. Carbon dioxide levels were naturally high in the early Eocene, but today CO2 levels are rising rapidly through human combustion of fossil fuels and deforestation.
"We haven't reached Eocene levels yet but we are increasing at a rate faster than any time in Earth's history.
"Atmospherically speaking, we are heading rapidly back in time towards the Eocene. Already CO2 levels are at a peak not seen since the Pliocene warm period 3.5 million years ago.
"The biggest threat lies in the fact that Antarctica today is covered with ice, enough to potentially raise global sea-levels by 60 metres if the continent once again reaches Eocene temperatures, which would have devastating effects all over the world."
Lead author Professor Jvrg Pross, from Goethe University in Frankfurt, Germany, said: "If the current CO2 emissions continue unabated due to the burning of fossil fuels, CO2 concentrations in the atmosphere, as they existed in the distant past, are likely to be achieved within a few hundred years.
"By studying naturally-occurring climate warming periods in the geological past, our knowledge of the mechanisms and processes in the climate system increases. This contributes enormously to improving our understanding of current human-induced global warming."
© 2012 ES London Limited
http://www.standard.co.uk/news/world/antarctica-sunburnand-you-think-global-warming-is-bad-now-8000854.html [no comments yet]
--
Jungles in Antarctica? High CO2 levels contributed to tropical conditions on the icy continent 50M years ago


Temperate (top) and subtropical (bottom) vegetation in New Zealand.
Photos by Rhett A. Butler
mongabay.com
August 02, 2012
Tropical vegetation grew along the coast of Antarctica 52 million years ago, an indication to dramatic climate shifts linked to elevated carbon dioxide levels in the atmosphere, report [ http://www.nature.com/nature/journal/v488/n7409/full/nature11300.html ] scientists in Nature.
The research, led by a team from the Goethe University and the Biodiversity and Climate Research Centre in Frankfurt, Germany, is based on drill cores from the seafloor near Antarctica. The cores turned up evidence of tropical and sub-tropical species, including palms and relatives of Baobab trees, which thrived in a period when atmospheric CO2 levels were more than twice current levels. The authors used this data, together with signatures of soil bacteria, to reconstruct vegetation communities for parts of the icy continent.
The scientists say the findings are important given the current trend in CO2 levels, which are rising due to burning of fossil fuels.
“If the current CO2 emissions continue unabated due to the burning of fossil fuels, CO2 concentrations in the atmosphere, as they existed in the distant past, are likely to be achieved within a few hundred years”, said Pross, a paleoclimatologist at the Goethe University and member of the Biodiversity and Climate Research Centre, in a statement. “By studying naturally occurring climate warming periods in the geological past, our knowledge of the mechanisms and processes in the climate system increases. This contributes enormously to improving our understanding of current human-induced global warming.”
The research suggests the presence of tropical and subtropical rainforests in costal regions of Antarctica, with temperate rainforests similar to those in present-day New Zealand in the cooler interior. The forests survived despite the three months of polar night annually.
But it wasn't only elevated CO2 levels that drove the mild conditions in Antarctica.
“Another important factor was the transfer of heat via warm ocean currents that reached Antarctica,” said Pross.
"When the warm ocean current collapsed and the Antarctic coast came under the influence of cooler ocean currents, the tropical rainforests including palms and Baobab relatives also disappeared," concluded the statement from Goethe University.
CITATION: Pross, J., Contreras, L., Bijl, P.K., Greenwood, D.R., Bohaty, S.M., Schouten, S., Bendle, J.A., Röhl, U., Tauxe, L., Raine, J.I., Huck, C.E., van de Flierdt, T., Jamieson, S.S.R., Stickley, C.E., van de Schootbrugge, B., Escutia, C., Brinkhuis, H., IODP Expedition 318 Scientists (2012): Persistent near-tropical warmth on the Antarctic continent during the early Eocene epoch. Nature, DOI: 10.1038/nature11300 [ http://www.nature.com/nature/journal/v488/n7409/full/nature11300.html ]
Copyright mongabay 2012
http://news.mongabay.com/2012/0802-jungles-antarctica.html [no comments yet]
===
Rare snowfall stuns much of South Africa

A man slides down a hill after a rare snowfall in Johannesburg, South Africa, on Tuesday, Aug. 7, 2012. Temperatures dropped to below freezing Tuesday morning as snow flurries blew through South Africa's commercial hub Johannesburg, dusting the city in white as residents poured into the streets to watch the snowflakes fall.
(AP Photo/Themba Hadebe)
By JON GAMBRELL
Associated Press
Aug 7, 5:06 PM EDT
JOHANNESBURG (AP) -- People slowly came outside despite the cold wind Tuesday across South Africa, pointed their mobile phone cameras to the sky and opened their mouths to taste a rare snowfall that fell on much of the country.
The snow began Tuesday morning, part of an extreme cold snap now biting into a nation still in its winter months. By mid-afternoon, officials recorded snowfall across most of South Africa. However, forecasters acknowledged snow remains so unusual that they typically aren't prepared to provide details about snowfall in the nation.
The snow closed some roads and at least one high-altitude pass. The snowfall also closed several border posts in the country.
As the snow fell, workers at offices in Johannesburg rushed outside. Some twirled and danced as the flakes fell. One man rushed to the top of a snow-covered hill and slid down, using a cardboard box as an improvised toboggan. Despite the cold and the snow, beggars who line traffic lights in the city continued to ask passing motorists for cash.
The snow grew heavier in the afternoon in Johannesburg, covering rooftops and slicking roads. Snowflakes are a rare commodity in Johannesburg, even during winter. South African Weather Service records show it has snowed in Johannesburg on only 22 other days in the last 103 years. The last snow fell there in June 2007.
In Pretoria, the country's capital, flurries filled the sky during a visit by U.S. Secretary of State Hillary Rodham Clinton. It was the first snowfall there since 1968, the weather service said.
The cold weather is expected to last a few days.
*
Online:
South African Weather Service: http://www.weathersa.co.za
© 2012 The Associated Press
http://hosted.ap.org/dynamic/stories/A/AF_SOUTH_AFRICA_SNOW?SITE=AP&SECTION=HOME&TEMPLATE=DEFAULT&CTIME=2012-08-07-17-06-15
--
In pictures: Rare snow in Johannesburg
7 August 2012 Last updated at 14:24 ET


[more at] http://www.bbc.co.uk/news/world-africa-19163119
===
(linked in):
http://investorshub.advfn.com/boards/read_msg.aspx?message_id=73648242 and following
http://investorshub.advfn.com/boards/read_msg.aspx?message_id=78389915 and preceding and following
Greensburg, KS - 5/4/07
"Eternal vigilance is the price of Liberty."
from John Philpot Curran, Speech
upon the Right of Election, 1790
F6
Discover What Traders Are Watching
Explore small cap ideas before they hit the headlines.


