News Focus
News Focus
Followers 71
Posts 12229
Boards Moderated 1
Alias Born 04/01/2000

Re: ReturntoSender post# 9848

Sunday, 07/29/2012 12:04:58 PM

Sunday, July 29, 2012 12:04:58 PM

Post# of 12809
Amateur Investors Weekend Stock Market Analysis (7/28/12)

http://www.amateur-investor.net/Weekend_Market_Analysis_July_28_2012.htm

Although the market rallied strongly Thursday and Friday in anticipation of QE 3 being announced next week by the Federal Reserve we have a dangerous market environment in place. This week the criteria for a Hindenburg Omen occurred based on the old methodology however some have adjusted the rules to limit the number of false signals.

I use the following criteria to justify a signal:

1. The Number of new 52 Week Highs and Lows much be at least 2.5% of the number of issues traded on the NYSE.
2. The number of new 52 Week Highs must not be more than twice the number of new 52 Week Lows.
3. The McClellan Oscillator must be negative.
4. The NYSE 10 Week Moving Average must be rising.

Also there must be a second occurrence of the above mentioned criteria to get a confirmed Hindenburg Omen Signal within 30 trading days. Furthermore if we add a few additional rules shown below this narrows down the number of actual occurrences to 11 since the mid 1960's.

5. Shiller's PE Ratio is above 16
6. The S&P 500 must be above its 10 Month Moving Average.

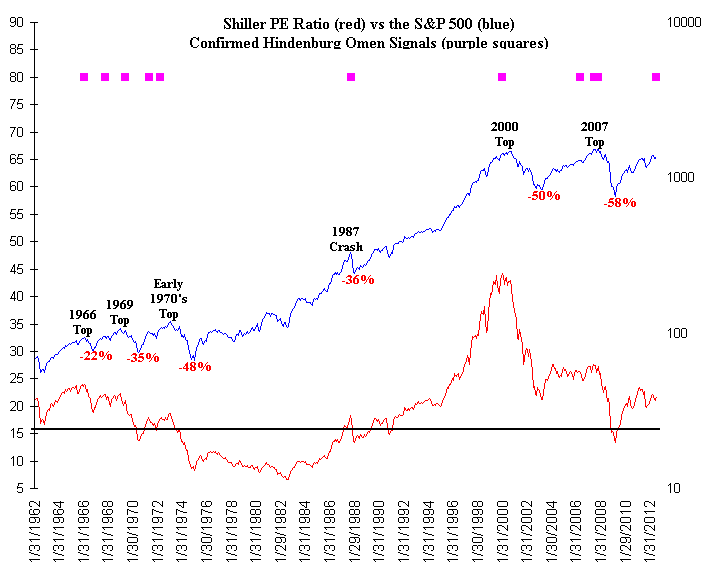
The chart below shows Shiller's PE Ratio (red) vs the S&P 500 (blue) along with the confirmed Hindenburg Omens (purple squares). As you can see confirmed Hindenburg Omen Signals occurred near the 2007 Top, 2000 Top, the 1987 Crash, the early 1970's Top, 1969 Top and the 1966 Top.


Meanwhile the table below gives a more detailed look at each confirmed Hindenburg Omen going back to the mid 1960's. The only events that weren't followed by a significant top were in April of 2006, May of 1971 and October of 1967, however, even these signals were followed by corrections ranging from 8% to 13%.

Signal Peak Peak Low Low %
Date Date Price Date Price Correction
7/24/2012 ? ? ? ? ?
10/18/2007 Oct-07 1576 Mar-09 667 -57.6 Major Top...S&P falls 58%
7/11/2007 Jul-07 1556 Aug-07 1371 -11.9 Precedes Major Top by 3 Months
4/17/2006 May-06 1327 Jun-06 1219 -8.1 Minor Correction
12/6/1999 Dec-99 1476 Feb-00 1325 -10.2 Precedes Major Top by 3 Months...S&P falls 50%
9/24/1987 Sep-87 322 Oct-87 216 -32.9 S&P drops 36% in 9 Weeks
3/23/1972 May-72 111 Jul-72 106 -4.5 Precedes late 1972 Top...S&P falls 48%
5/17/1971 May-71 104 Nov-71 90 -13.5 Minor Correction
5/26/1969 May-69 106 May-70 69 -34.9 Major Top...S&P falls 35%
10/13/1967 Oct-67 98 Mar-68 88 -10.2 Minor Correction
2/1/1966 Feb-66 94 Oct-66 73 -22.3 Major Top...S&P falls 22%

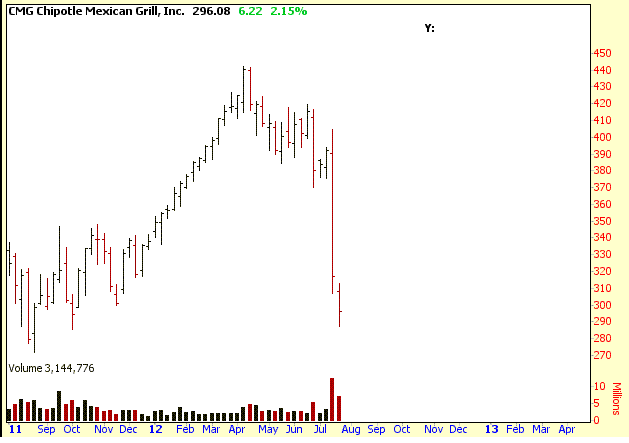
Thus as mentioned in the beginning this is a dangerous market environment and investors should pay close attention to their long term positions and not let things get out of hand. CMG provides an excellent example of how fast things can change as stocks typically go down a lot faster than they go up.


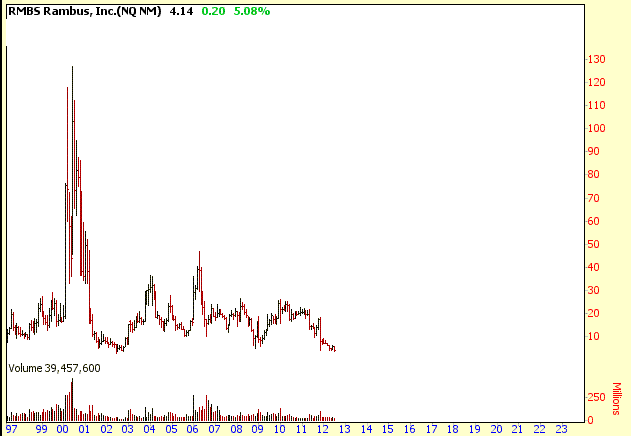
Also there is no guarantee that a stock will recover once it begins to sell off. Just ask the folks who bought RMBS back in 1999 and 2000. Notice it's still near all time lows a decade later.

Discover What Traders Are Watching

Explore small cap ideas before they hit the headlines.

Join Today