


Saturday, July 16, 2011 7:27:16 AM
CPI Adjusted Gold Price of $1,753
http://www.munknee.com/2011/01/true-inflation-adjusted-rate-means-gold-should-be-at-5467/
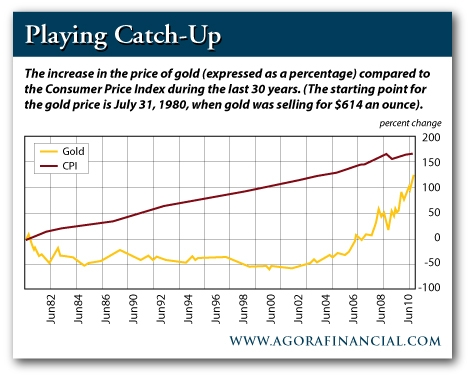
Let’s examine a brief history of the Gold Price relative to U.S. inflation. The Gold Price peaked in January 1980 at $850 per ounce but this peak was very brief… Probably a better reference point for the market top is the average price during 1980 as a whole. This was $615/oz. Since then, the Gold Price has increased only 125%. Over the same timespan, however, the government’s most widely quoted inflation gauge, the Consumer Price Index (CPI), has increased 185%. Therefore, if the Gold Price had increased as much as the CPI, it would be selling for $1753/oz today… but the official inflation figures might not be the real story.
ShadowStats Alternative Gold Price of $5,467 to $7,000
Using alternative inflation figures calculated by ShadowStats.com, consumer prices have soared an astounding 789% since 1980, which means that the inflation- adjusted Gold Price would be $5,467/oz.
Substantiation For ShadowStat Inflation Data
Interestingly, if we look at the market bottoms for gold – 1970 and 2001 – instead of the market tops, the ShadowStats data seem to provide a much more accurate inflation gauge than the CPI. For example, in January 1970 – before gold’s 10-year bull run – the price of gold was just $35/oz. Thirty-one years later – after soaring to more than $800 an ounce in 1980 – the big bear market in gold bottomed out at $256/oz. – and the average price for 2001 was $271/oz. Therefore, during this 31-year period – through gold’s full bull and bear market cycle – the Gold Price advanced 674%. Over the same timeframe, the ShadowStats inflation measure advanced a nearly identical 688%. By contrast, the CPI increased only 370% during this period. In other words, the cumulative CPI readings from 1970 to 2001 failed to account for all the inflation indicated by the rising Gold Price. The ShadowStats figures, on the other hand, were pretty much bang on target.
http://www.munknee.com/2011/01/true-inflation-adjusted-rate-means-gold-should-be-at-5467/
Let’s examine a brief history of the Gold Price relative to U.S. inflation. The Gold Price peaked in January 1980 at $850 per ounce but this peak was very brief… Probably a better reference point for the market top is the average price during 1980 as a whole. This was $615/oz. Since then, the Gold Price has increased only 125%. Over the same timespan, however, the government’s most widely quoted inflation gauge, the Consumer Price Index (CPI), has increased 185%. Therefore, if the Gold Price had increased as much as the CPI, it would be selling for $1753/oz today… but the official inflation figures might not be the real story.
ShadowStats Alternative Gold Price of $5,467 to $7,000

Using alternative inflation figures calculated by ShadowStats.com, consumer prices have soared an astounding 789% since 1980, which means that the inflation- adjusted Gold Price would be $5,467/oz.
Substantiation For ShadowStat Inflation Data
Interestingly, if we look at the market bottoms for gold – 1970 and 2001 – instead of the market tops, the ShadowStats data seem to provide a much more accurate inflation gauge than the CPI. For example, in January 1970 – before gold’s 10-year bull run – the price of gold was just $35/oz. Thirty-one years later – after soaring to more than $800 an ounce in 1980 – the big bear market in gold bottomed out at $256/oz. – and the average price for 2001 was $271/oz. Therefore, during this 31-year period – through gold’s full bull and bear market cycle – the Gold Price advanced 674%. Over the same timeframe, the ShadowStats inflation measure advanced a nearly identical 688%. By contrast, the CPI increased only 370% during this period. In other words, the cumulative CPI readings from 1970 to 2001 failed to account for all the inflation indicated by the rising Gold Price. The ShadowStats figures, on the other hand, were pretty much bang on target.

$ 14 , 2 9 4 , 0 0 0 , 0 0 0 , 0 0 0 . 0 0-current US limit

Recent SLV News
- Form 424I - • Edgar (US Regulatory) • 03/31/2026 08:36:29 PM
- Form 8-K - Current report • Edgar (US Regulatory) • 03/31/2026 01:49:45 AM
- Form 10-K - Annual report [Section 13 and 15(d), not S-K Item 405] • Edgar (US Regulatory) • 02/27/2026 06:44:38 PM
- Form IRANNOTICE - Notice of disclosure filed pursuant to Section 219 of the Iran Threat Reduction and Syria Human Rights Act of 2012 (Exchange Act Section 13(r)). • Edgar (US Regulatory) • 02/27/2026 06:37:04 PM
- U.S. Silver Mining Stocks Climb as Metal Prices Reach Two-Week Peak • IH Market News • 02/23/2026 01:38:01 PM
- Form FWP - Filing under Securities Act Rules 163/433 of free writing prospectuses • Edgar (US Regulatory) • 11/13/2025 05:23:49 PM
- Form 10-Q - Quarterly report [Sections 13 or 15(d)] • Edgar (US Regulatory) • 08/05/2025 08:50:26 PM
- Form 10-Q - Quarterly report [Sections 13 or 15(d)] • Edgar (US Regulatory) • 05/07/2025 09:08:35 PM


