



 AI
AI







CCI-48/70 Indicator usage....with ChiOsc - OBV usage
whatzzzzz up **D*A**.....ur chart looks good
the CCI-48 is trying to break....of course the CCI-70 should break along side the CCI-48
Fib waves can appear with this set up once CCI-70 sets up
OBV/ChiuOsc should follow ....IMVHO
What Does On-Balance Volume - OBV Mean?
A method used in technical analysis to detect momentum, the calculation of which relates volume to price change. OBV provides a running total of volume and shows whether this volume is flowing in or out of a given security. This indicator was developed by Joe Granville.
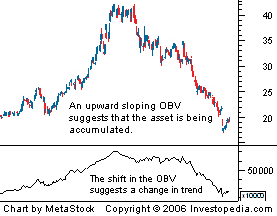
On-Balance Volume - OBV
OBV attempts to detect when a financial instrument (stock, bond, etc.) is being accumulated by a large number of buyers or sold by many sellers. Traders will use an upward sloping OBV to confirm an uptrend, while a downward sloping OBV is used to confirm a downtrend. Finding a downward sloping OBV while the price of an asset is trending upward can be used to suggest that the "smart" traders are starting to exit their positions and that a shift in trend may be coming
OBV - Divergences


The Chaikin Oscillator
is simply the Moving Average Convergence Divergence indicator (MACD) applied to the Accumulation/Distribution Line. The formula is the difference between the 3-day exponential moving average and the 10-day exponential moving average of the Accumulation/Distribution Line. Just as the MACD-Histogram is an indicator to predict moving average crossovers in MACD, the Chaikin Oscillator is an indicator to predict changes in the Accumulation/Distribution Line.
Many of the same signals that apply to MACD are also applicable to the Chaikin Oscillator. Keep in mind though, that these signals relate to the Accumulation/Distribution Line, not directly to the stock itself
Bullish Signals
There are two bullish signals that can be generated from the Chaikin Oscillator: positive divergences and centerline crossovers. Because the Chaikin Oscillator is an indicator of an indicator, it is prudent to look for confirmation of a positive divergence (a bullish moving average crossover, for example) before counting this as a bullish signal. The chart for Coca-Cola (KO) is an excellent example of a positive divergence that has been confirmed by a centerline crossover

1.The positive divergence was sharp and pronounced. (When using an indicator of an indicator, it is preferable to take only strong signals. Note the steepness of the positive divergence.)
2.The bullish centerline crossover occurred in the Chaikin Oscillator before the Accumulation/Distribution Line broke to a new reaction high.
3.At the point of the centerline crossover (green dotted line), the stock also broke resistance and the bullish signal was further validated.
Bearish Signals
There are, also, two bearish signals that can be generated from the Chaikin Oscillator: a negative divergence and a bearish centerline crossover. Allow a negative divergence to be confirmed by a bearish centerline crossover before a bearish signal is rendered. The chart for Merck (MRK) shows a recent bearish signal that coincided with a support break in the stock:

1.The negative divergence is not as sharp and pronounced as the positive divergence in Coca-Cola (KO), but it is detectable, nonetheless. Divergences that cover long time spans are sometimes difficult to time for a trade.
2.It is easy to see the effects of price action on the Chaikin Oscillator and the Accumulation/Distribution Line in this example. The blue lines mark a period when the stock traded basically flat for 13 days. However, many of the Closes for this period were below the midway point, and some were near the intraday Lows. Note the action of the Chaikin Oscillator and Accumulation/Distribution Line during this period; both declined markedly.
3.The bearish centerline crossover to confirm the divergence occurred just recently and coincided with a break of support in the stock and a trend line break in the Accumulation/Distribution Line.
Chart by **D*A**.......link back

c
whatzzzzz up **D*A**.....ur chart looks good
the CCI-48 is trying to break....of course the CCI-70 should break along side the CCI-48
Fib waves can appear with this set up once CCI-70 sets up
OBV/ChiuOsc should follow ....IMVHO
What Does On-Balance Volume - OBV Mean?
A method used in technical analysis to detect momentum, the calculation of which relates volume to price change. OBV provides a running total of volume and shows whether this volume is flowing in or out of a given security. This indicator was developed by Joe Granville.
On-Balance Volume - OBV
OBV attempts to detect when a financial instrument (stock, bond, etc.) is being accumulated by a large number of buyers or sold by many sellers. Traders will use an upward sloping OBV to confirm an uptrend, while a downward sloping OBV is used to confirm a downtrend. Finding a downward sloping OBV while the price of an asset is trending upward can be used to suggest that the "smart" traders are starting to exit their positions and that a shift in trend may be coming
OBV - Divergences


The Chaikin Oscillator
is simply the Moving Average Convergence Divergence indicator (MACD) applied to the Accumulation/Distribution Line. The formula is the difference between the 3-day exponential moving average and the 10-day exponential moving average of the Accumulation/Distribution Line. Just as the MACD-Histogram is an indicator to predict moving average crossovers in MACD, the Chaikin Oscillator is an indicator to predict changes in the Accumulation/Distribution Line.
Many of the same signals that apply to MACD are also applicable to the Chaikin Oscillator. Keep in mind though, that these signals relate to the Accumulation/Distribution Line, not directly to the stock itself
Bullish Signals
There are two bullish signals that can be generated from the Chaikin Oscillator: positive divergences and centerline crossovers. Because the Chaikin Oscillator is an indicator of an indicator, it is prudent to look for confirmation of a positive divergence (a bullish moving average crossover, for example) before counting this as a bullish signal. The chart for Coca-Cola (KO) is an excellent example of a positive divergence that has been confirmed by a centerline crossover

1.The positive divergence was sharp and pronounced. (When using an indicator of an indicator, it is preferable to take only strong signals. Note the steepness of the positive divergence.)
2.The bullish centerline crossover occurred in the Chaikin Oscillator before the Accumulation/Distribution Line broke to a new reaction high.
3.At the point of the centerline crossover (green dotted line), the stock also broke resistance and the bullish signal was further validated.
Bearish Signals
There are, also, two bearish signals that can be generated from the Chaikin Oscillator: a negative divergence and a bearish centerline crossover. Allow a negative divergence to be confirmed by a bearish centerline crossover before a bearish signal is rendered. The chart for Merck (MRK) shows a recent bearish signal that coincided with a support break in the stock:

1.The negative divergence is not as sharp and pronounced as the positive divergence in Coca-Cola (KO), but it is detectable, nonetheless. Divergences that cover long time spans are sometimes difficult to time for a trade.
2.It is easy to see the effects of price action on the Chaikin Oscillator and the Accumulation/Distribution Line in this example. The blue lines mark a period when the stock traded basically flat for 13 days. However, many of the Closes for this period were below the midway point, and some were near the intraday Lows. Note the action of the Chaikin Oscillator and Accumulation/Distribution Line during this period; both declined markedly.
3.The bearish centerline crossover to confirm the divergence occurred just recently and coincided with a break of support in the stock and a trend line break in the Accumulation/Distribution Line.
Chart by **D*A**.......link back
c

Discover What Traders Are Watching
Explore small cap ideas before they hit the headlines.



