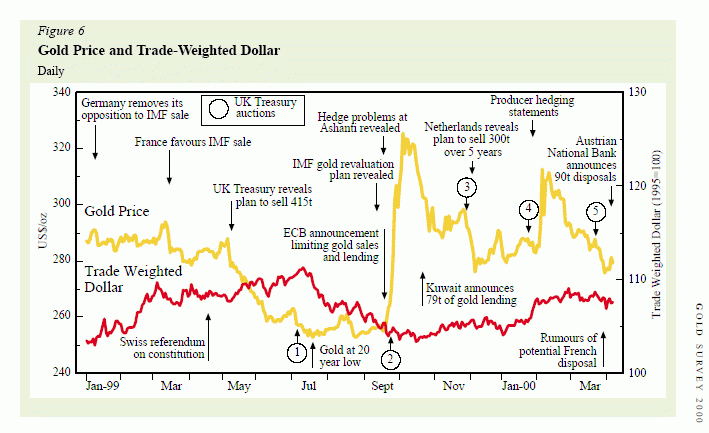
'scuse me Dan, references date from 2000 and 2001. If you look at the chart, this was the bottom. Talking of price suppression when an ounce sells $250 is one thing. Using the same 2001 arguments to prove a price suppression today in 2004 while an ounce has risen 60%?
FYI, this was the chart published in 2000 by the GFMS, shacky and suspicious. Today gold is outside the chart, above. The Trade Wheighted Dollar is outside the chart, below.
lvlamb a k a Louis V. Lambrecht
Whenever you find that you are on the side of the majority, it is time to reform. (Mark Twain)
 Market Data
  Markets