News Focus
News Focus
Followers 71
Posts 12229
Boards Moderated 1
Alias Born 04/01/2000

Re: ReturntoSender post# 6781

Saturday, 02/28/2009 6:30:56 PM

Saturday, February 28, 2009 6:30:56 PM

Post# of 12809
Amateur Investors Weekend Stock Market Analysis (2/28/09)

http://www.amateur-investor.net/Weekend_Market_Analysis_Feb_28_09.htm

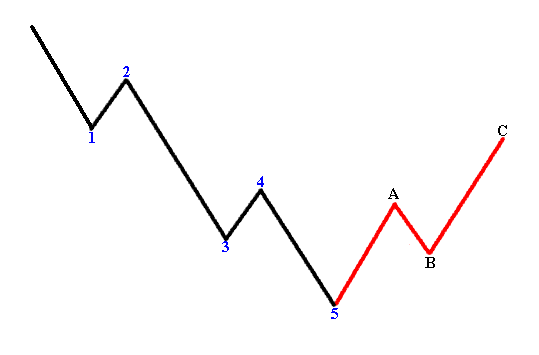
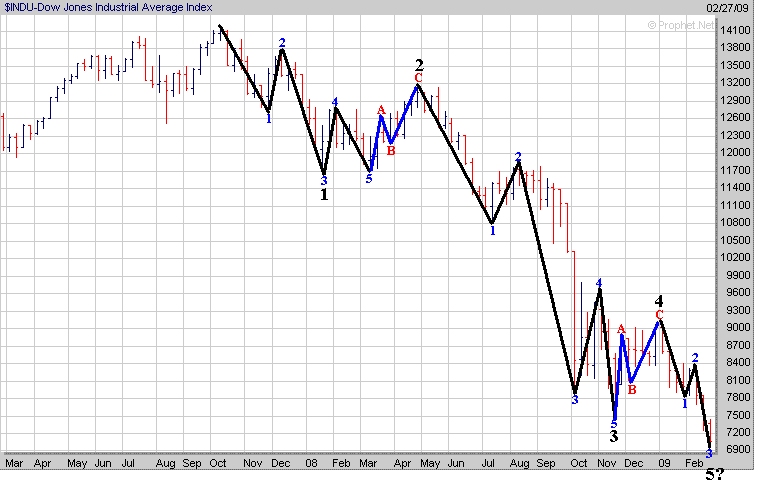
The market had another bad week as all three major averages are now exhibiting their final 5th Wave down in association with a longer term Elliott 5 wave pattern that began in October of 2007. A classic looking Elliott 5 Wave pattern is shown below. Keep in mind once the 5th Wave down ends this should be followed by a substantial "ABC" type corrective rally that may last several months.


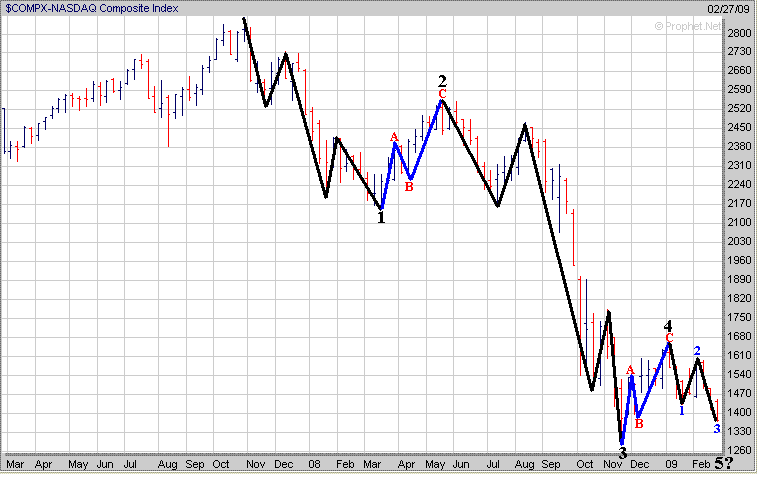
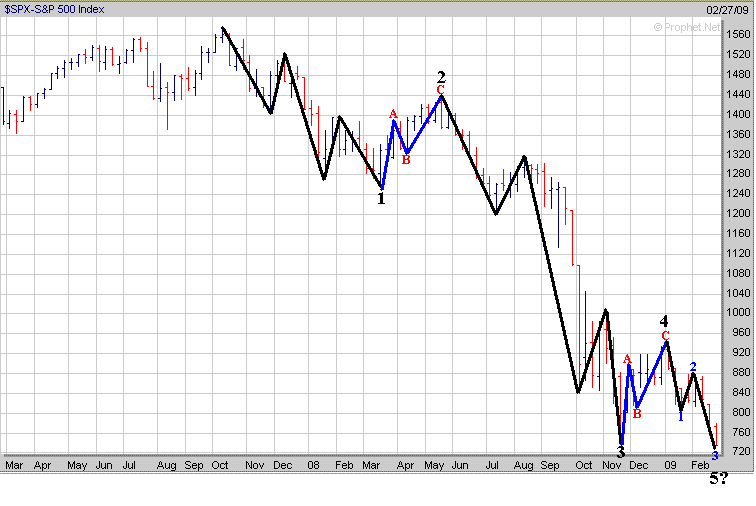
In the chart below I have labeled all of the sub Waves and major Waves for the Dow. Also notice the Nasdaq and S&P 500 are exhibiting similar patterns as well.


Nasdaq


S&P 500


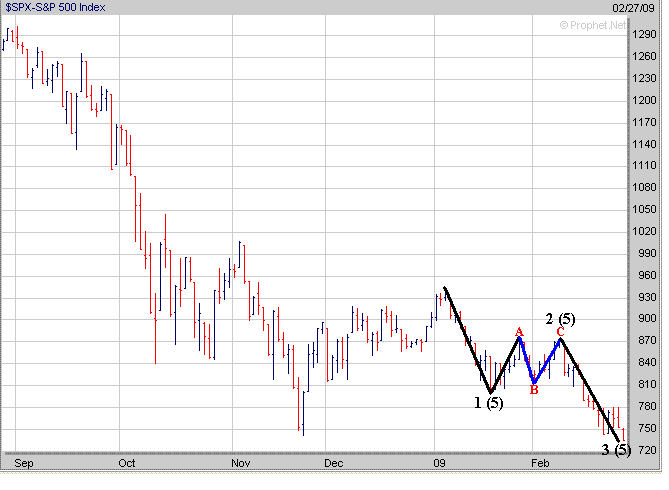
At this point I know many investors are wondering when a bottom may occur. As mentioned above it does appear we are seeing the final 5th Wave down so that is a positive sign. However it's nearly impossible to know when the exact bottom will occur. According to Elliott Wave Theory the 5th Wave should have 5 sub waves to it with "3" Waves down and "2" Waves up. If we take a closer look at the S&P 500 on a daily chart it appears we are in the 3rd sub wave down at this time which eventually should be followed by a 4th sub wave up and then the final 5th sub wave down.


Finally one thing to keep an eye on in the weeks ahead is the 5 Day Average of the Put to Call Ratio. So far since the October 2007 top it has done a good of signaling the completion of major Waves. Notice when the 5 day Average of the Put to Call Ratio has risen above the 1.15 level (purple line) that this was followed by the completion of Waves 1 and 3 Down. Meanwhile when the 5 Day Average of the Put to Call Ratio dropped below the 0.85 level (green line) this was followed by the eventual completion of Waves 2 and 4 Up shortly thereafter.

Now what is a little bit mystifying to me at this point is that the latest drop in the S&P 500 hasn't generated any fear among the Options crowd as the 5 Day Average of the Put to Call Ratio has actually been falling (points A to B) and is getting close to the 0.85 level again. Thus you really have to wonder what it's going to take to get investors fearful of this market to allow for a bottom to occur. At this time it appears the Options crowd believes the market is getting near a bottom so that is why they have been loading up on Calls of late. Thus we shall see if they are right or not over the next few weeks.

Discover What Traders Are Watching

Explore small cap ideas before they hit the headlines.

Join Today