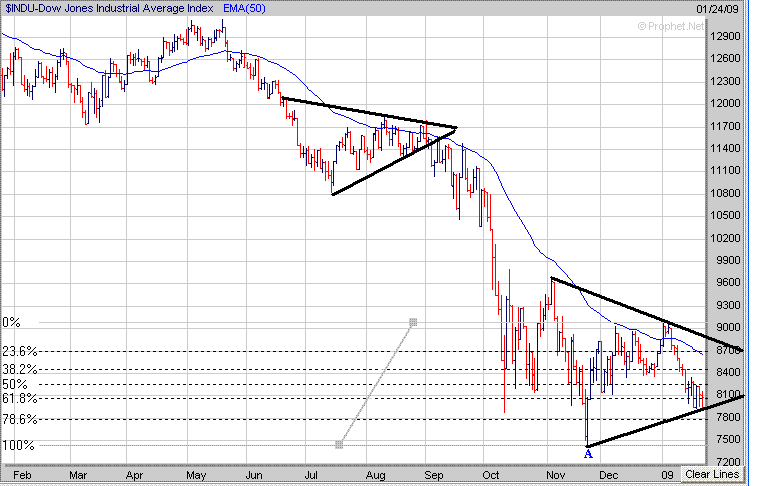
It was very choppy this week with wild swings in both directions. Overall the Dow dropped below its 61.8% Retracement Level (calculated from the 11/21 low to the 1/6 high) near 8075 but remained above its last level of major support at the 78.6% Level near 7800. It appears the Dow is developing a Triangle pattern (black lines) much like occurred last Summer. If the Dow attempts to make one more move to the upside next week I would look for resistance at the top of the Triangle pattern near 8700 which is also very close to its 50 Day EMA (blue line) as well. Meanwhile if the Dow fails to rally next week and it drops below 7800 then look for a retest of the 11/21 low near 7450 (point A).
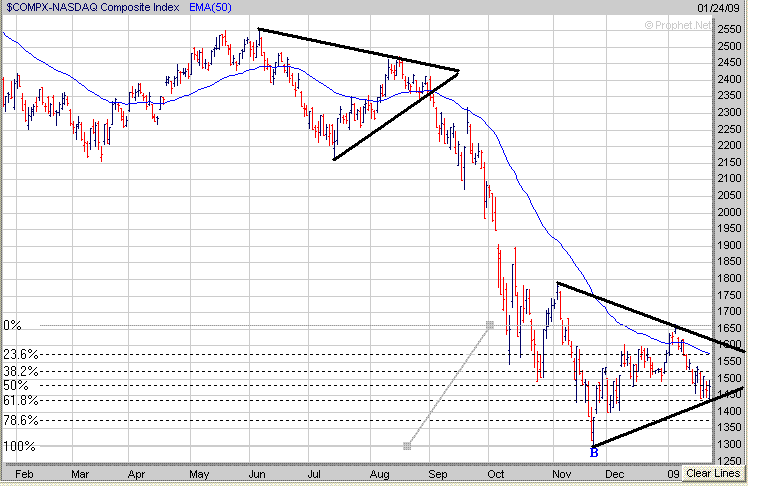
As far as the Nasdaq it held support this week at its 61.8% Retracement Level near 1438 (calculated from the 11/21 low to the Jan 6th high). Just like the Dow it appears to be developing a Triangle pattern as well. If the Nasdaq makes one more move to the upside next week look for resistance to occur at the top of the Triangle near 1575 which is also near its 50 Day EMA (blue line). Meanwhile if the Nasdaq doesn't rally next week and drops below the 1438 level then that may lead to a retest of the 11/21 low near 1300 (point B).
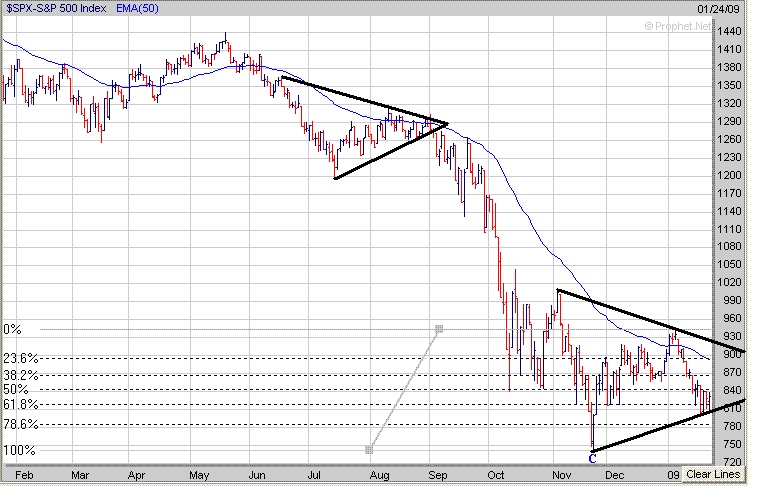
The S&P 500 dropped below its 61.8% Retracement Level (calculated from the 11/21 low to the 1/6 high) near 818 this week but held support above its 78.6% Retracement Level at 784. If the S&P 500 rallies next week look for resistance to occur at the top of its Triangle near 900 which is close to its 50 Day EMA (blue line) as well. Meanwhile if the S&P 500 breaks below the 784 level then look for a retest of the 11/21 low at 741 (point C).