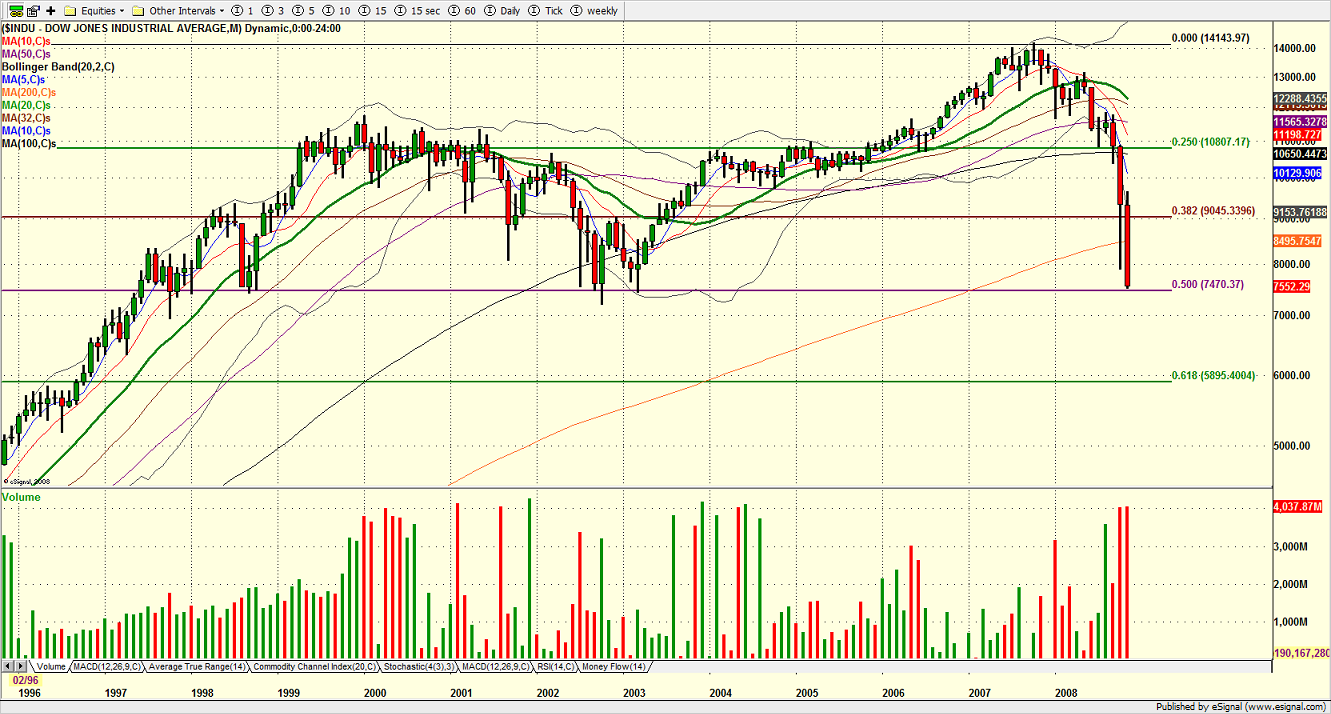
$INDU monthly chart...I just want us to see the fibs drawn in ...the starting point was back in 1982...which is my own interpretation of where this bull market started...
Seems that 50% fib level looks fairly strong, since it incorporates a couple of other lows back in 1998, 2002, and 2003...does anyone think we see some sideways action for a few days?
The problem is, for me, that I think this is an event driven market, with horribly negative fundamentals, and therefore the indices are not particularly amenable to technical analysis...
I believe we are going lower than this ultimately...and it could even be tomorrow, but on the other hand, perhaps we should be ready for a potential short term consolidation....


 Market Data
  Markets