



 AI
AI






| Followers | 0 |
| Posts | 148553 |
| Boards Moderated | 7 |
| Alias Born | 03/10/2004 |

Monday, April 14, 2025 4:50:45 PM
Natural Gas Slumps Toward 200-Day Moving Average Support
By: Bruce Powers | April 14, 2025
🔸 Natural gas broke to $3.31 with bearish signals increasing, likely setting up a test of multi-indicator support around the 200-Day MA near $3.05.
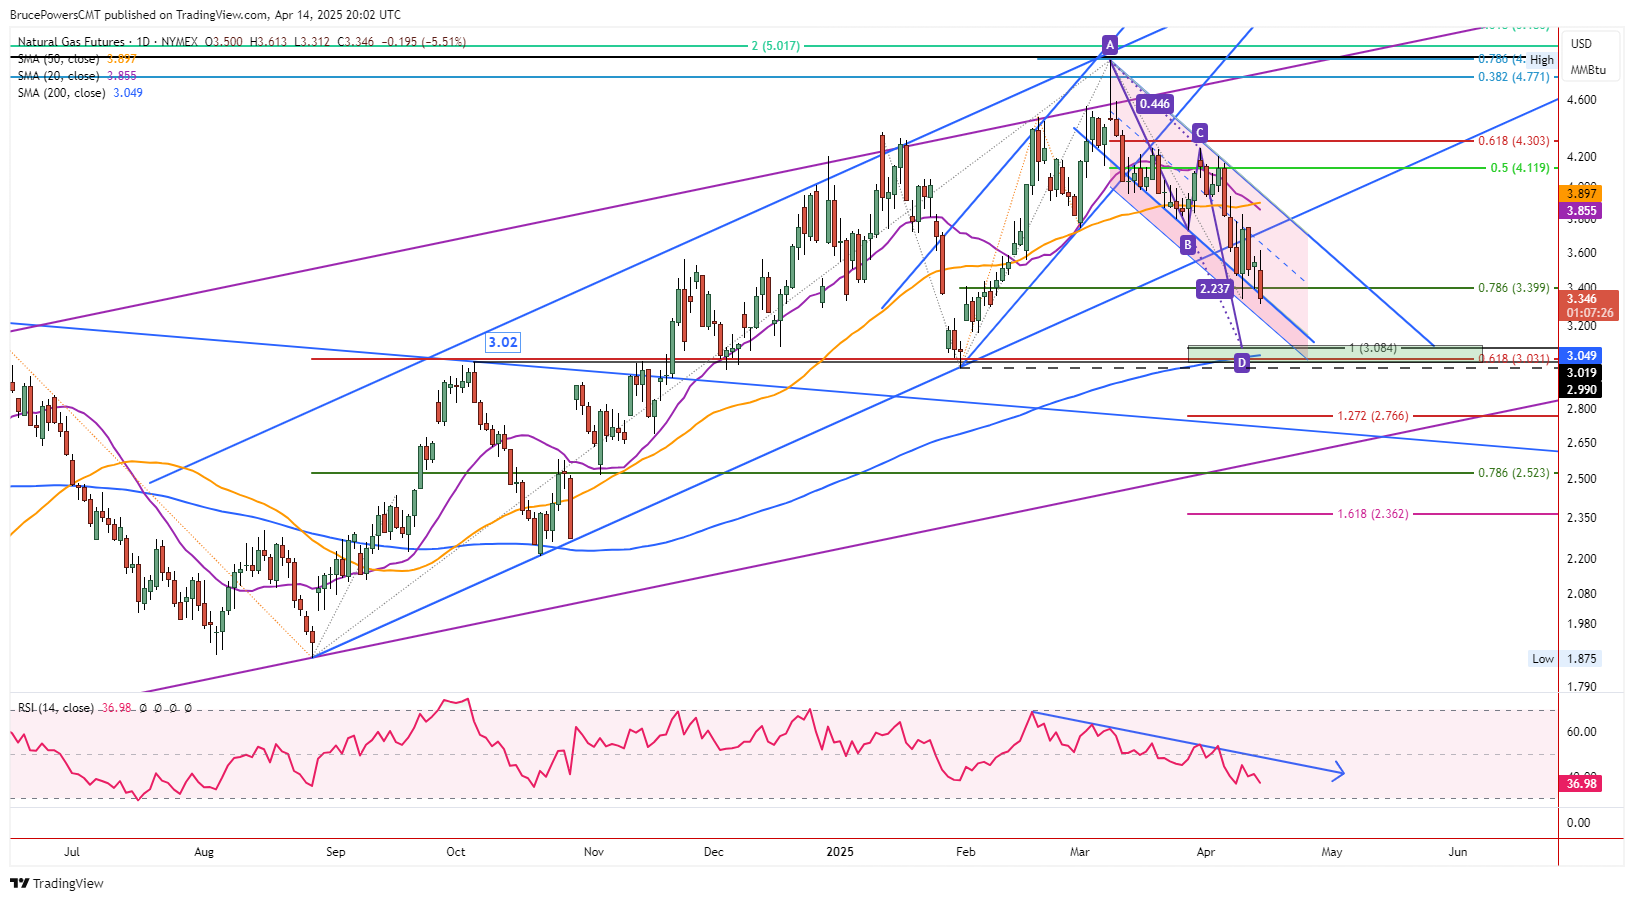
Further bearish signs were indicated for natural gas on Monday as it dropped to a new corrective low of $3.31. Signs of weakness will likely to be confirmed today by a new lower daily closing price, which may be below the 78.6% support zone at $3.40, and possibly below the lower line of a falling trend channel. Note that the channel is extended on the bottom by 25%. The extended lower line is where support for the decline was previously, from last Wednesday.
Bearish Momentum Dominates
Trading continues near the lows of the day at the time of this writing and natural gas looks poised to close in the lower third of the day’s trading range. Currently, the low for the day is $3.31. Monday’s session began with a brief rally above Friday’s high to a high of $3.61. A retest of resistance around the center line of a falling parallel trend channel occurred before sellers took back control. A bearish outside day subsequently formed as Friday’s low was busted. Furthermore, the lower line of the descending parallel channel has also failed to hold as support.
Test of 200-Day Moving Average Likely
This puts natural gas in a position to possibly test support around the 200-Day MA, now at $3.05. There are several other indicators pointing out that price zone as possible support. A falling ABCD pattern completes at $3.08, while a 61.8% Fibonacci retracement level is at $3.03, coinciding with support from the January 31 swing low at $2.99. In addition, a breakout of a symmetrical triangle pattern triggered on a move above $3.02 in November. Therefore, along with the last-January swing low, the current decline may provide a retest of that breakout zone.
Multiple Signs of Support Around $3.05
The 200-Day MA was last reclaimed in September of last year and that was followed by a successful test of the line as support later in October. Since then, the price of natural gas has not approached the 200-Day line. Therefore, given the indicator confluence around the 200-Day line, the expectation is for support to be seen. Moreover, although a decline below the line is a bearish sign. Natural gas has been falling since a high of $4.90 and it may run out of bearish momentum by the time it tests the 200-Day MA.
Read Full Story »»»
 DiscoverGold
By: Bruce Powers | April 14, 2025
🔸 Natural gas broke to $3.31 with bearish signals increasing, likely setting up a test of multi-indicator support around the 200-Day MA near $3.05.
Further bearish signs were indicated for natural gas on Monday as it dropped to a new corrective low of $3.31. Signs of weakness will likely to be confirmed today by a new lower daily closing price, which may be below the 78.6% support zone at $3.40, and possibly below the lower line of a falling trend channel. Note that the channel is extended on the bottom by 25%. The extended lower line is where support for the decline was previously, from last Wednesday.
Bearish Momentum Dominates
Trading continues near the lows of the day at the time of this writing and natural gas looks poised to close in the lower third of the day’s trading range. Currently, the low for the day is $3.31. Monday’s session began with a brief rally above Friday’s high to a high of $3.61. A retest of resistance around the center line of a falling parallel trend channel occurred before sellers took back control. A bearish outside day subsequently formed as Friday’s low was busted. Furthermore, the lower line of the descending parallel channel has also failed to hold as support.
Test of 200-Day Moving Average Likely
This puts natural gas in a position to possibly test support around the 200-Day MA, now at $3.05. There are several other indicators pointing out that price zone as possible support. A falling ABCD pattern completes at $3.08, while a 61.8% Fibonacci retracement level is at $3.03, coinciding with support from the January 31 swing low at $2.99. In addition, a breakout of a symmetrical triangle pattern triggered on a move above $3.02 in November. Therefore, along with the last-January swing low, the current decline may provide a retest of that breakout zone.
Multiple Signs of Support Around $3.05
The 200-Day MA was last reclaimed in September of last year and that was followed by a successful test of the line as support later in October. Since then, the price of natural gas has not approached the 200-Day line. Therefore, given the indicator confluence around the 200-Day line, the expectation is for support to be seen. Moreover, although a decline below the line is a bearish sign. Natural gas has been falling since a high of $4.90 and it may run out of bearish momentum by the time it tests the 200-Day MA.
Read Full Story »»»
 DiscoverGold
Information posted to this board is not meant to suggest any specific action, but to point out the technical signs that can help our readers make their own specific decisions. Caveat emptor!
• DiscoverGold



