


Tuesday, September 17, 2024 12:44:02 PM
If my mining stocks are stalled before the precious fed pivot tomorrow why are they not going up today.
Lost in Center field
Black and Yellow Gold Nearing Breaks as Participants Regroup
The two quintessential commodities crude oil and gold both appear to be near inflection points.
Carley GarnerSep 16, 2024 6:45 PM EDT
For this article, we have turned our attention to the two quintessential commodities: crude oil and gold. As we generally do, we are paying attention to what the Commitments of Traders (CoT) report issued weekly by the Commodity Futures Trading Commission tells us.
We suspect both products could be nearing a break in the trend as market participants regroup. Let’s start with oil.
Black Gold (Crude Oil)
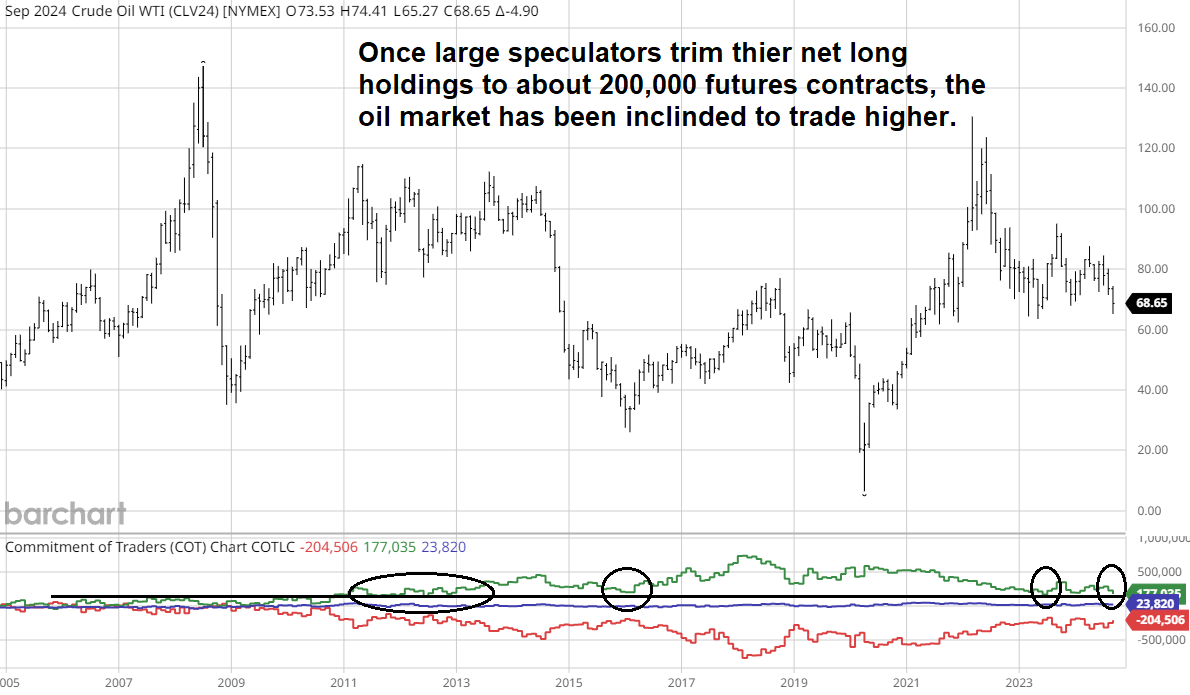
Crude oil speculators haven’t gone short the market, but their long positions have dwindled to about 200,000 net long futures; levels that are generally supportive of prices.
In the mid-2010s, each time speculators held this small of a bullish position, the oil market found a reason to tag $20.00 to $30.00 to the price of oil. In 2016, a similar setup on the CoT chart pushed prices from about $30.00 per barrel to nearly $80.000, and in 2023, we saw a rally from the low $60.00s into the $90.00s. It is still unknown if speculators will continue their unwind to push oil prices much lower or if we will see another price bump as speculators put long positions back on, but we are leaning toward the latter.
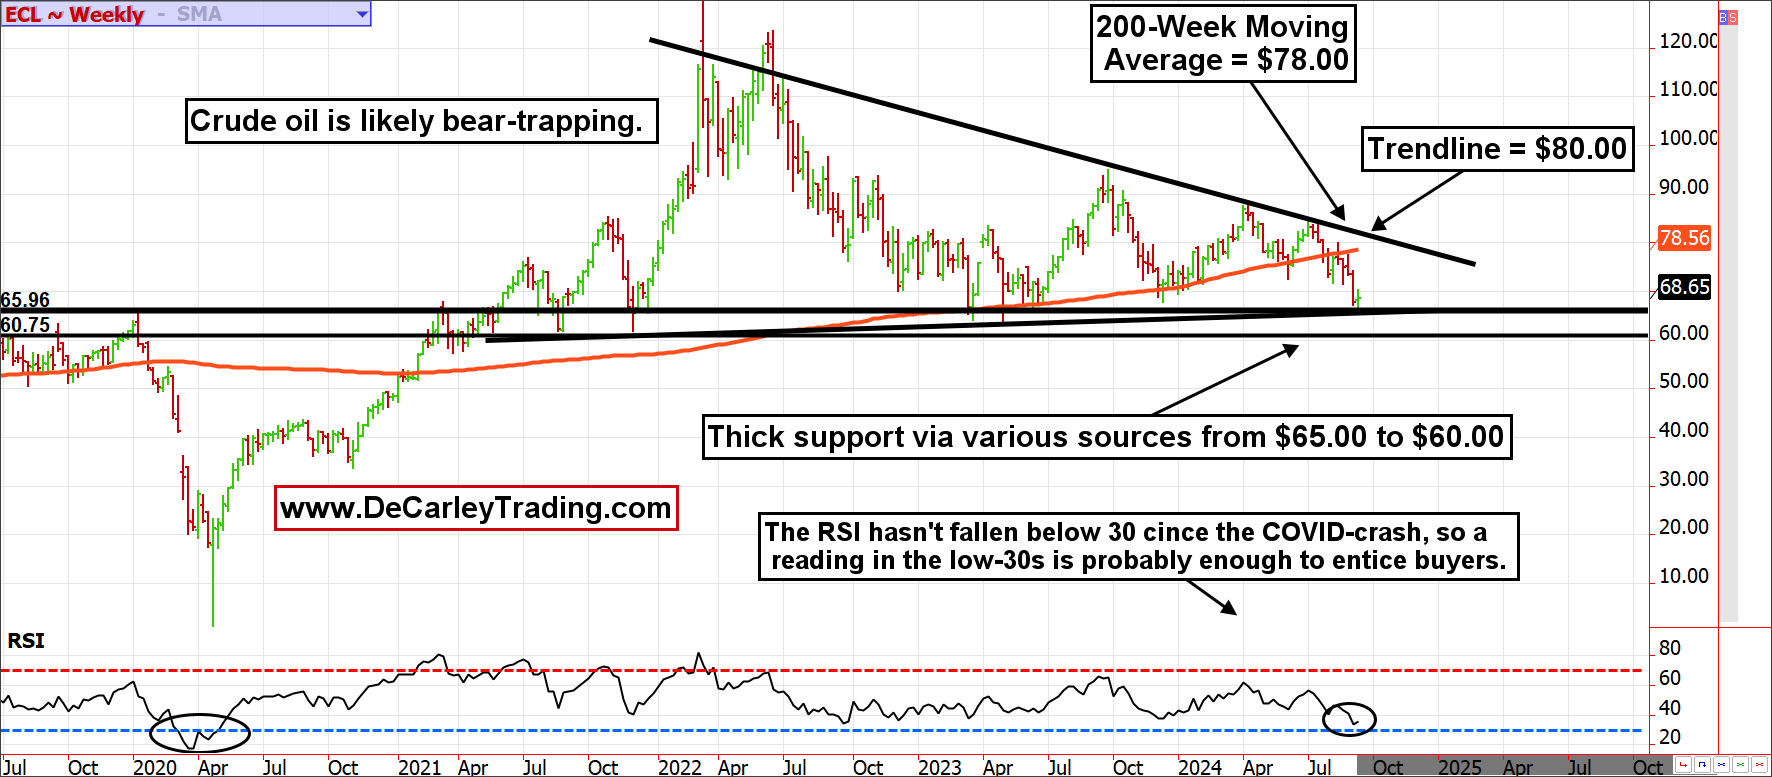
The weekly crude oil chart depicts technical support roughly between $65.00 and $60.00 per barrel. In fact, last week’s sudden flush-out might have been the low for the move. In any case, there is a good argument for being bullish on dips as we advance.
The 200-week moving average near $78.00 is still in an uptrend, and it would be par for the course to see oil prices make another run at it. If the market can chew through it, trendline resistance at about $80.00 will present another challenge to the bulls, but above this level, we could see a nice boost as traders unwind their deflation trades (long stocks, short commodities). Who knows? Maybe $90.00 is still in play.
Gold of the Yellow Variety
Just as everyone is finally starting to get on the bullish gold bandwagon, it feels like the rug could be pulled from beneath the market.
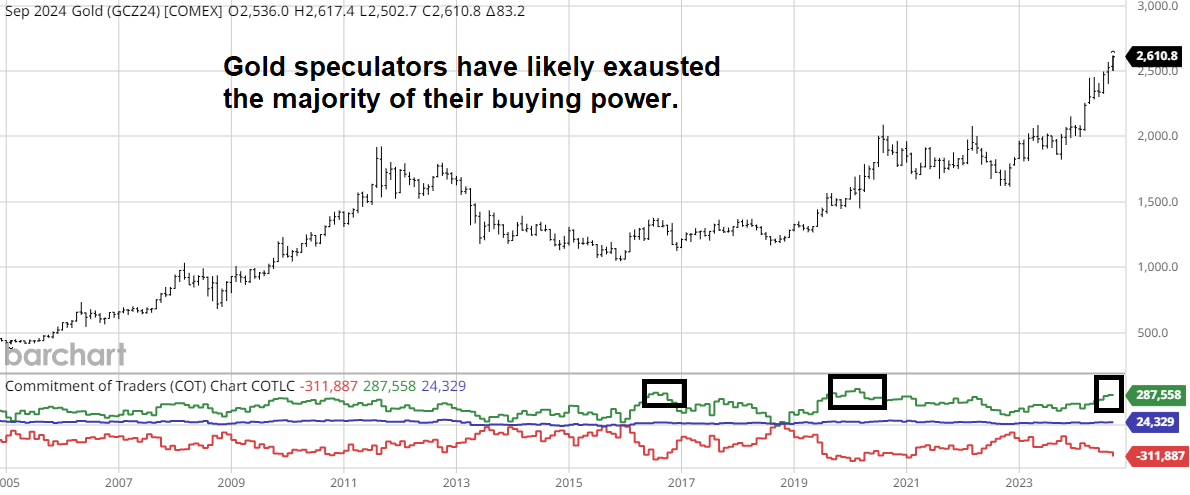
According to the CoT report, large speculators hold one of the most significant net long positions ever recorded in gold futures. In the past, this group getting aggressively bullish hasn’t always resulted in immediate selling pressure, but it might be a sign that the “easy” money (if such a thing exists) has been made on the upside. Things could get pretty rocky as we advance.
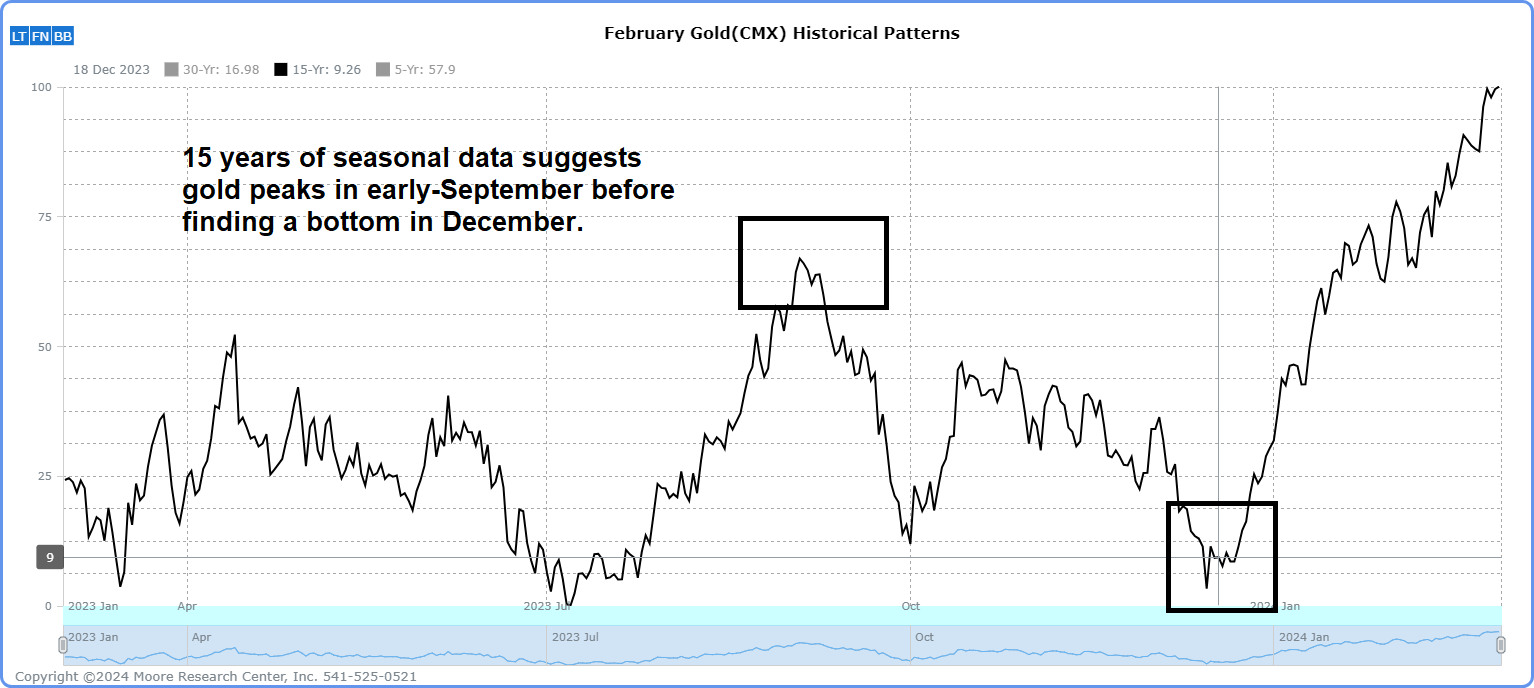
Seasonality doesn’t offer the bulls any comfort. According to our friends at MRCI, the last 15 years of price data suggest a seasonal high in early September, followed by about three months of weakness.
Lastly, we revisit the monthly chart of gold. We have been following and sharing this chart for two or more years to support the idea of a run to about $2,600 (the target started around $2,450/$2,500, but due to the passing of time and the slope of the trendline, the new target is $2,600/$2,650). In any case, we are roughly there.
If you made money on the way up, be sure to lock-in, or at least protect gains. If you are a bear, this is probably a time to be net-short gold in a small way while we see what happens with the Fed meeting and the U.S. election.
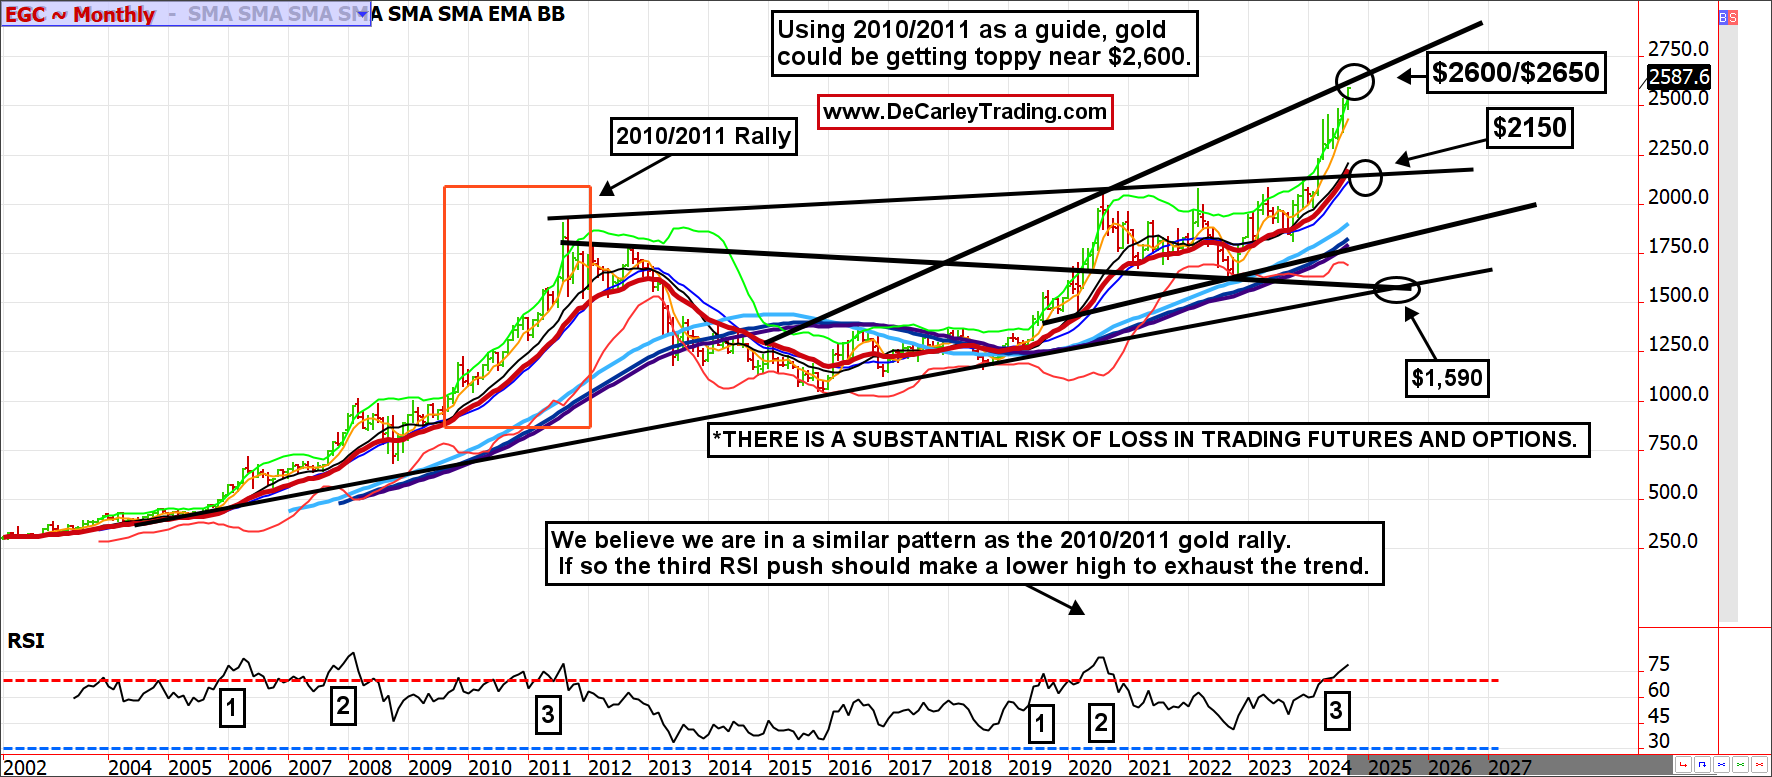
All along, we have assumed that the 2023/2024 gold market is a replay of the 2010/2011 rally. Thus far, that has been a relatively accurate take.
If we continue to follow the 2010/2011 game plan, the highs in gold are probably near. The RSI indicator on this chart displayed three rally waves to conclude the 2011 rally in which the middle wave produced the highest RSI reading. With this in mind, we suspect the third wave of the current RSI pattern will fall short sooner rather than later. Perhaps this week’s Fed meeting will be the catalyst for lower prices. It should also be noted that the 2011 high occurred in September. Never underestimate the market’s tendency to repeat history.
Conclusion
We’ve seen market participants become comfortable with the idea of lower crude oil and higher gold prices. Still, perhaps everyone in a position to act on this opinion has already done so.
In short, the oil speculators have liquidated long holdings, and gold bulls have likely deployed the majority of their capital. Unless we get a continuous stream of overwhelming fundamental news confirming these stances, the most likely scenario is a trend reversal (firmer oil and softer gold).
https://pro.thestreet.com/market-commentary/black-and-yellow-gold-nearing-breaks-as-participants-regroup
*John Fogerty - Centerfield
Lost in Center field
Black and Yellow Gold Nearing Breaks as Participants Regroup
The two quintessential commodities crude oil and gold both appear to be near inflection points.
Carley GarnerSep 16, 2024 6:45 PM EDT
For this article, we have turned our attention to the two quintessential commodities: crude oil and gold. As we generally do, we are paying attention to what the Commitments of Traders (CoT) report issued weekly by the Commodity Futures Trading Commission tells us.
We suspect both products could be nearing a break in the trend as market participants regroup. Let’s start with oil.
Black Gold (Crude Oil)
Crude oil speculators haven’t gone short the market, but their long positions have dwindled to about 200,000 net long futures; levels that are generally supportive of prices.
In the mid-2010s, each time speculators held this small of a bullish position, the oil market found a reason to tag $20.00 to $30.00 to the price of oil. In 2016, a similar setup on the CoT chart pushed prices from about $30.00 per barrel to nearly $80.000, and in 2023, we saw a rally from the low $60.00s into the $90.00s. It is still unknown if speculators will continue their unwind to push oil prices much lower or if we will see another price bump as speculators put long positions back on, but we are leaning toward the latter.

The weekly crude oil chart depicts technical support roughly between $65.00 and $60.00 per barrel. In fact, last week’s sudden flush-out might have been the low for the move. In any case, there is a good argument for being bullish on dips as we advance.
The 200-week moving average near $78.00 is still in an uptrend, and it would be par for the course to see oil prices make another run at it. If the market can chew through it, trendline resistance at about $80.00 will present another challenge to the bulls, but above this level, we could see a nice boost as traders unwind their deflation trades (long stocks, short commodities). Who knows? Maybe $90.00 is still in play.

Gold of the Yellow Variety
Just as everyone is finally starting to get on the bullish gold bandwagon, it feels like the rug could be pulled from beneath the market.
According to the CoT report, large speculators hold one of the most significant net long positions ever recorded in gold futures. In the past, this group getting aggressively bullish hasn’t always resulted in immediate selling pressure, but it might be a sign that the “easy” money (if such a thing exists) has been made on the upside. Things could get pretty rocky as we advance.

Seasonality doesn’t offer the bulls any comfort. According to our friends at MRCI, the last 15 years of price data suggest a seasonal high in early September, followed by about three months of weakness.

Lastly, we revisit the monthly chart of gold. We have been following and sharing this chart for two or more years to support the idea of a run to about $2,600 (the target started around $2,450/$2,500, but due to the passing of time and the slope of the trendline, the new target is $2,600/$2,650). In any case, we are roughly there.
If you made money on the way up, be sure to lock-in, or at least protect gains. If you are a bear, this is probably a time to be net-short gold in a small way while we see what happens with the Fed meeting and the U.S. election.

All along, we have assumed that the 2023/2024 gold market is a replay of the 2010/2011 rally. Thus far, that has been a relatively accurate take.
If we continue to follow the 2010/2011 game plan, the highs in gold are probably near. The RSI indicator on this chart displayed three rally waves to conclude the 2011 rally in which the middle wave produced the highest RSI reading. With this in mind, we suspect the third wave of the current RSI pattern will fall short sooner rather than later. Perhaps this week’s Fed meeting will be the catalyst for lower prices. It should also be noted that the 2011 high occurred in September. Never underestimate the market’s tendency to repeat history.
Conclusion
We’ve seen market participants become comfortable with the idea of lower crude oil and higher gold prices. Still, perhaps everyone in a position to act on this opinion has already done so.
In short, the oil speculators have liquidated long holdings, and gold bulls have likely deployed the majority of their capital. Unless we get a continuous stream of overwhelming fundamental news confirming these stances, the most likely scenario is a trend reversal (firmer oil and softer gold).
https://pro.thestreet.com/market-commentary/black-and-yellow-gold-nearing-breaks-as-participants-regroup
*John Fogerty - Centerfield
Recent MUX News
- Iconic Minerals Executes Joint Venture Agreement with McEwen Mining on New Pass Gold Property, Nevada • Newsfile • 04/15/2026 04:14:00 PM
- Form PRE 14A - Other preliminary proxy statements • Edgar (US Regulatory) • 04/10/2026 08:30:19 PM
- Form 8-K - Current report • Edgar (US Regulatory) • 03/24/2026 08:53:16 PM
- Form 4 - Statement of changes in beneficial ownership of securities • Edgar (US Regulatory) • 03/23/2026 08:58:28 PM
- Form 4 - Statement of changes in beneficial ownership of securities • Edgar (US Regulatory) • 03/23/2026 08:58:06 PM
- Form 4 - Statement of changes in beneficial ownership of securities • Edgar (US Regulatory) • 03/23/2026 08:57:36 PM
- Form 4 - Statement of changes in beneficial ownership of securities • Edgar (US Regulatory) • 03/23/2026 08:57:13 PM
- Form 4 - Statement of changes in beneficial ownership of securities • Edgar (US Regulatory) • 03/23/2026 08:56:41 PM
- Form 4 - Statement of changes in beneficial ownership of securities • Edgar (US Regulatory) • 03/23/2026 08:56:12 PM
- Form 4 - Statement of changes in beneficial ownership of securities • Edgar (US Regulatory) • 03/23/2026 08:55:37 PM
- McEwen Reports Tartan Mine Project Gold Mineral Resource Estimate • GlobeNewswire Inc. • 03/23/2026 10:00:00 AM
- Form 8-K - Current report • Edgar (US Regulatory) • 03/12/2026 06:24:48 PM
- Q4 and Full Year 2025 Operational and Financial Results: Q4 Net Income of $38.1M ($0.70 per Share) vs. Net Loss of $8.2M ($0.16 per Share) in Q4 2024; Advancing Key Developments to Double Production by 2030 • GlobeNewswire Inc. • 03/12/2026 10:00:00 AM
- Goliath Resources Acquires 100% Ownership Of The Golddigger Property Hosting The High-Grade Surebet Gold Discovery And Buys Down 1% Of The NSR, Golden Triangle, B.C. • GlobeNewswire Inc. • 03/10/2026 01:28:35 PM
- McEwen Q4 and Year-End 2025 Results Conference Call • GlobeNewswire Inc. • 03/09/2026 04:57:55 PM
- Goliath Resources Proposes to Extend Term of Warrants Held by McEwen Inc. • GlobeNewswire Inc. • 02/28/2026 02:38:30 PM
- Goliath Reports Numerous High-Grade Intercepts Including 24.16 g/t AuEq Over 7.00 Meters, Grade Values Increased By 19.6 % In 56 Gold Equivalent Drill Results, And Expands Vast Stacked Vein System At Surebet Discovery, Golden Triangle, B.C. • GlobeNewswire Inc. • 02/24/2026 11:24:00 AM
- Goliath Reports Numerous High-Grade Intercepts Up To 10.83 g/t AuEq Over 22.82 Meters, Grade Values Increased By 13.2% In 54 Gold Equivalent Drill Results, Assays Pending On A Further 56 AuEq Holes Drilled In 2025, Surebet Discovery, Golden Triangle, B.C. • GlobeNewswire Inc. • 02/19/2026 11:19:00 AM
- Goliath Resources Ltd. Upgrades from OTCQB to a OTCQX Listing • GlobeNewswire Inc. • 02/17/2026 01:30:16 PM
- Form 8-K - Current report • Edgar (US Regulatory) • 02/02/2026 11:30:48 AM
- McEwen Inc. to Acquire Golden Lake Exploration Inc. — Further Consolidates Gold Bar Mine Complex in Nevada • GlobeNewswire Inc. • 01/29/2026 01:40:03 AM
- Goliath Resources Selected for PDAC 2026 Core Shack, Session B • GlobeNewswire Inc. • 01/28/2026 01:28:00 PM
- McEwen Drilling Returns Significant Intersection at Gold Bar Mine Complex in Nevada: 5.55 gpt Gold over 44.2 Meters; Transformation into a Long-Life Mine Continues • GlobeNewswire Inc. • 01/27/2026 11:09:26 AM
- Form 8-K - Current report • Edgar (US Regulatory) • 01/23/2026 11:30:51 AM
- Goliath Resources Fast Tracks 100% Ownership Of The Golddigger Property Hosting The High-Grade Surebet Gold Discovery And Reduces The NSR from 3% to 2%, Golden Triangle, B.C. • GlobeNewswire Inc. • 01/22/2026 11:22:00 AM


