News Focus
News Focus
Followers 0
Posts 148553
Boards Moderated 7
Alias Born 03/10/2004

Re: None

Tuesday, 11/07/2023 4:20:19 PM

Tuesday, November 07, 2023 4:20:19 PM

Post# of 648882
How the NASDAQ 100 Can Reach $16660+
By: Dr. Arnout ter Schure | November 7, 2023

Over the past two months, we have been tracking a corrective Elliott Wave Principle (EWP) move (a-b-c) lower from the July 4 high before seeing the next rally to ideally around $16660. We have followed up on our base prognostication regularly, and three weeks ago, see here, we found

“if the index stays above the October 6 low, with a first warning for the Bulls below the $14800-900 zone, it should ideally be on its way to $16660. Lastly, a break above $15615 will seal the deal for the Bulls. Thus, while the index did not bottom precisely where we would have liked it to, we have precise price levels below which we know our assessment is wrong. Until then, we prefer to look higher.”

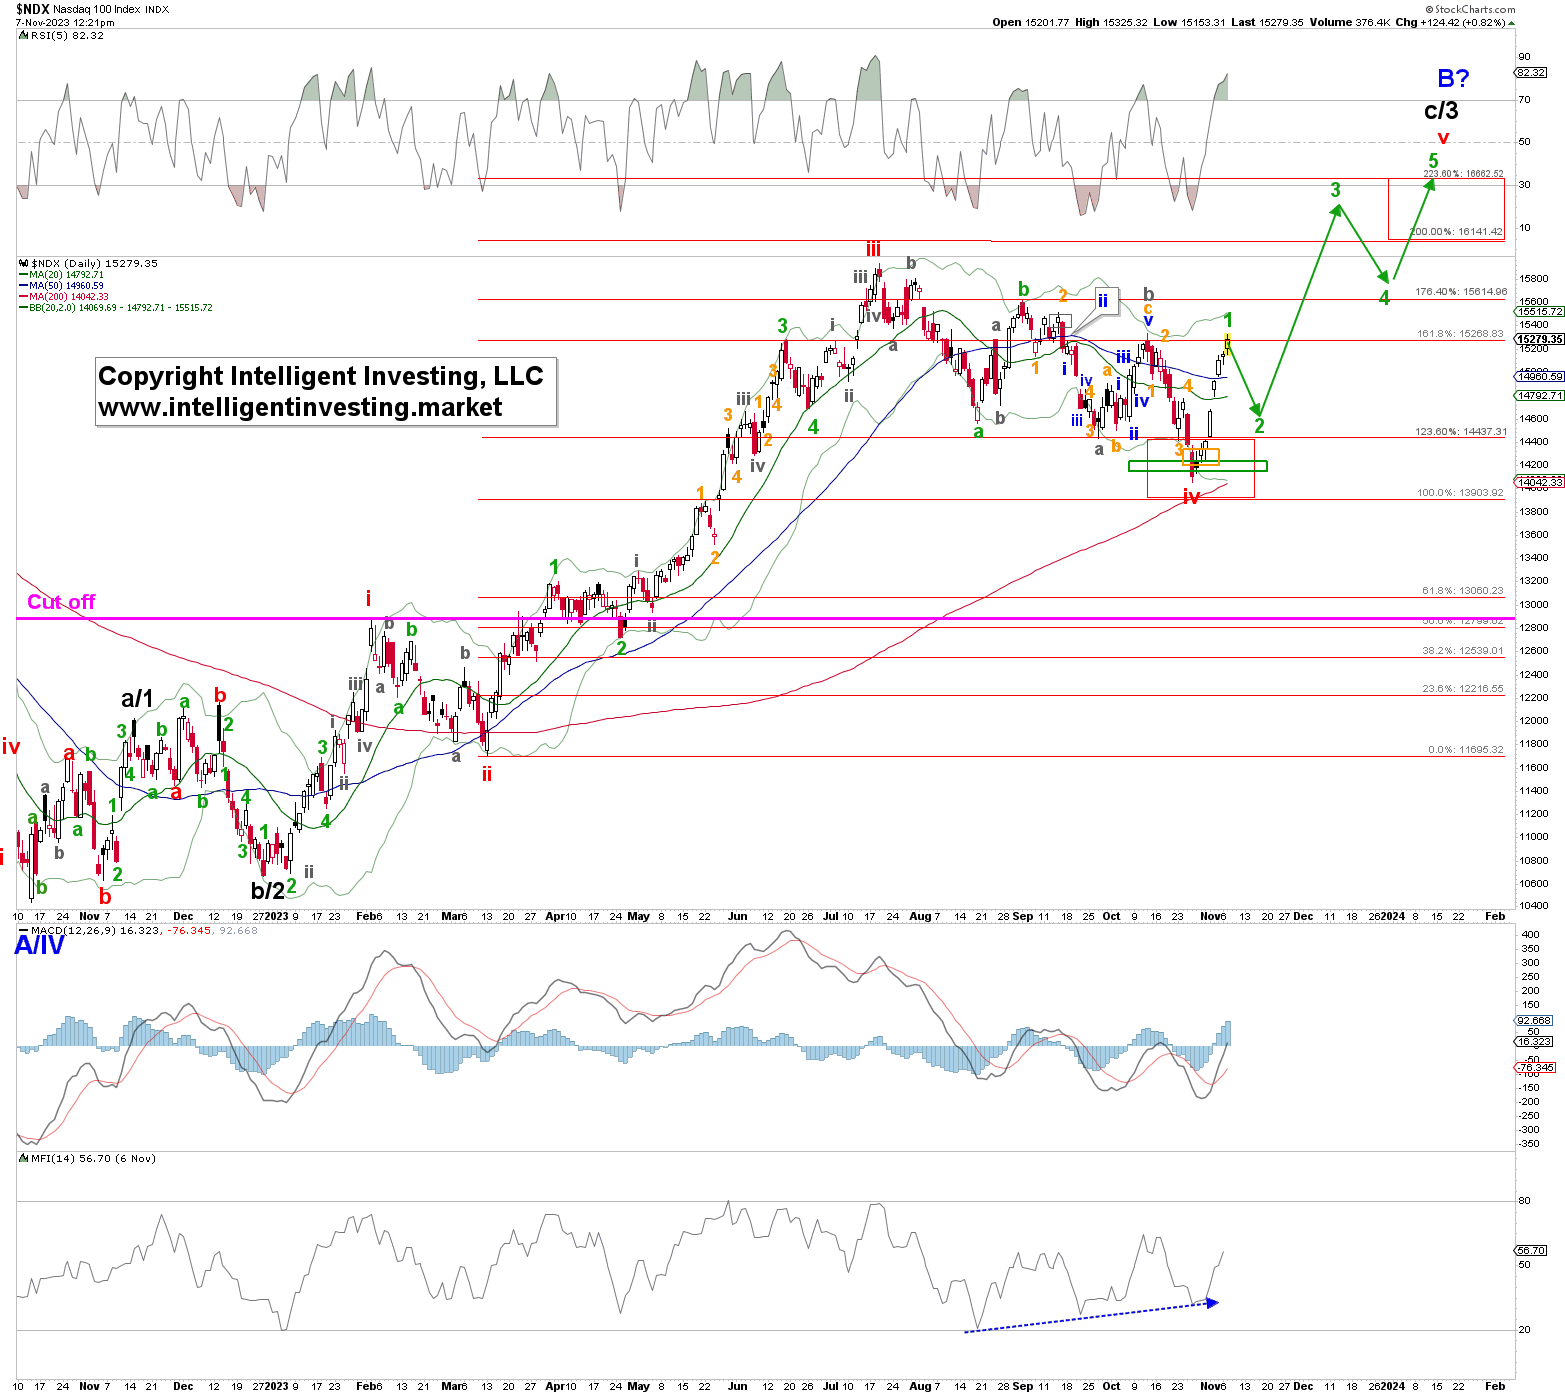
Fast forward, and similar to the S&P 500, see here, the Nasdaq 100 morphed from a single, simple zigzag (a-b-c) into a double, complex zigzag (green a-b, grey a-b-c) from the red W-iii July x high. See Figure 1 below. This complication can always happen, but it is impossible to know beforehand and why we set objective price levels below or above we know our primary expectation is wrong.

Figure 1. NASDAQ100 daily resolution chart with technical indicators and detailed EWP count.


NDX-Daily Chart

However, the index still bottomed on October 26 perfectly within the ideal red target zone (76.40-100.00% Fibonacci-extensions of red W-i, measured from the red W-ii low) as well as in the green and orange target zones we had presented to our premium members later in October. Hence, it pays to stay more regularly informed than once every other week. Moreover, the NDX has since staged a relentless rally: a Zweig Breadth Thrust Event was registered last Friday, November 3.
See our X post here:


Does this mean it is now all clear sailing? No, due to the Elliott Waves markets never move in a straight line. To reach $16660+ the market will complete five (green) waves up 1, 2, 3, 4, 5. The 2nd and 4th waves are corrective pullbacks.

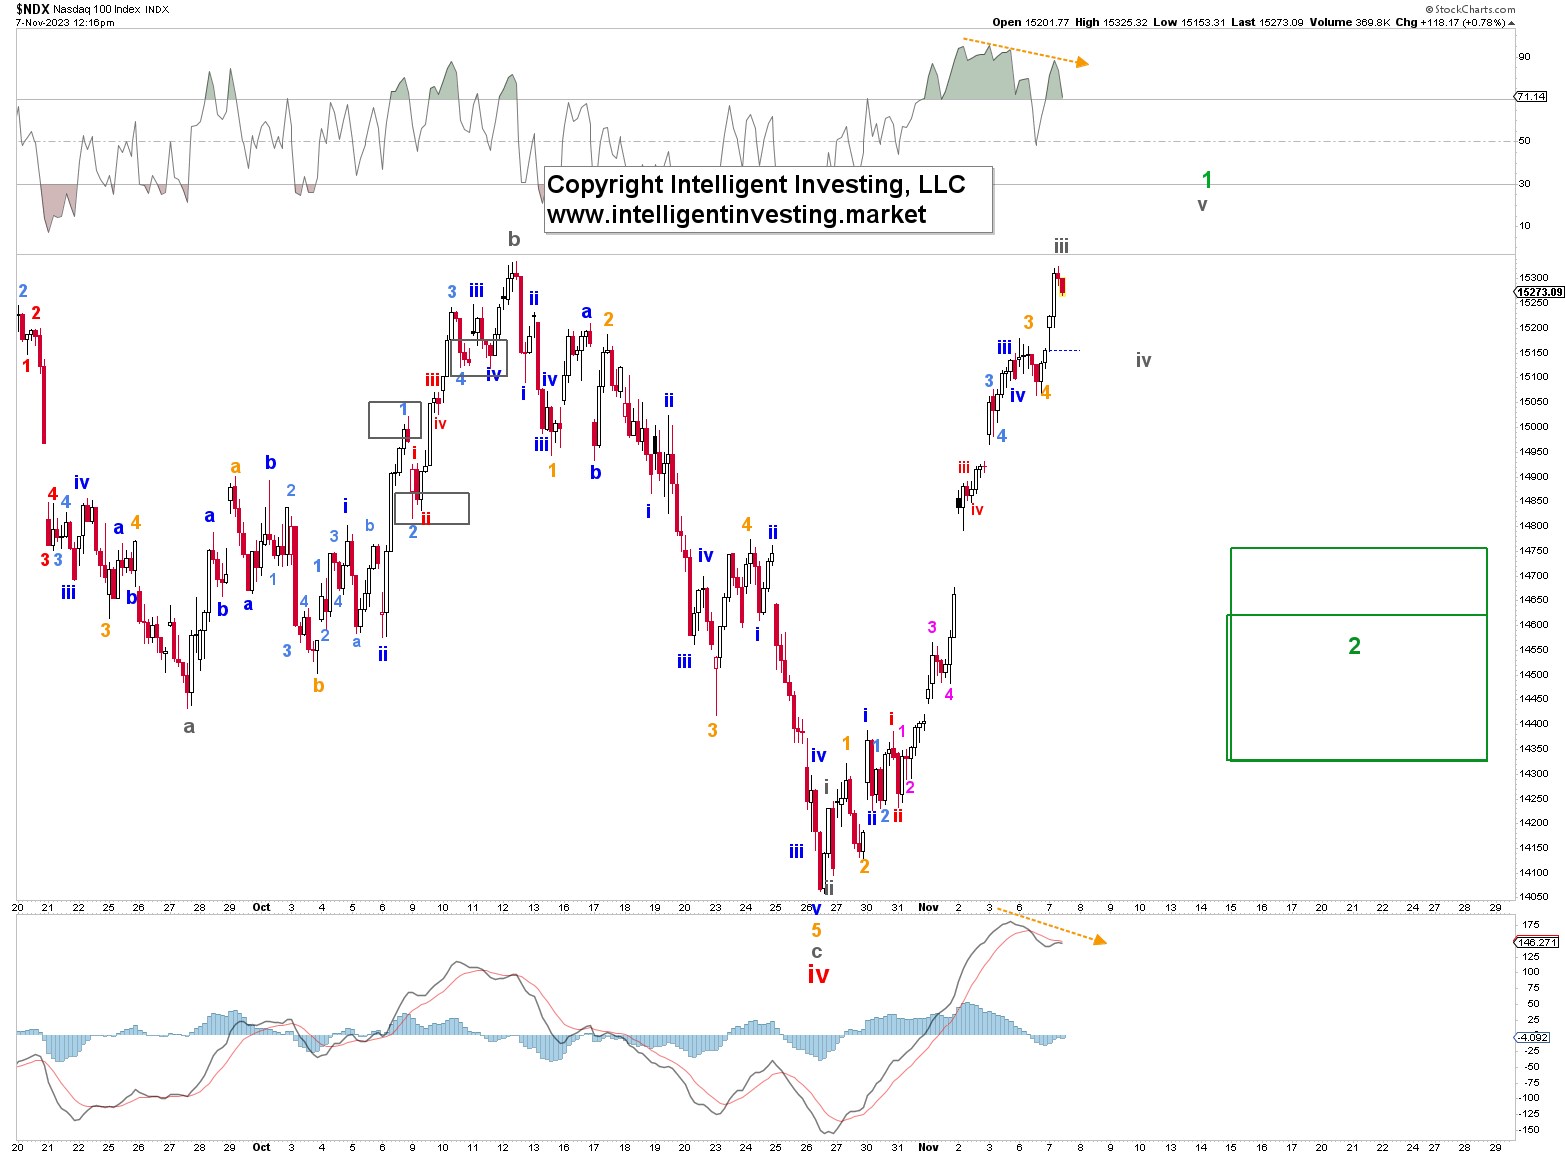
Currently, we view the index as wrapping up its (green) 1st wave. See figure 2 below. Based on the negative divergence and the number of pullbacks registered on the hourly time frame since the October 26 low, grey W-iii is topping out, followed by grey W-iv and W-v. We, therefore, expect the index to top out soon, ideally around $15500+/-100, before a multi-day correction (green W-2) down to ideally $14600+/-100 kicks in.

Figure 2. NASDAQ 100 hourly resolution chart with technical indicators and detailed EWP count.


NDX-Daily Chart

Once green W-2 is completed, green W-3 to ideally $16450+/-100 will ensue. Like last, and as always, our primary expectations are wrong on a drop below the October 26 low, with a 1st warning for the Bulls below $14400.

Read Full Story »»»

DiscoverGold

Information posted to this board is not meant to suggest any specific action, but to point out the technical signs that can help our readers make their own specific decisions. Caveat emptor!
• DiscoverGold

Discover What Traders Are Watching

Explore small cap ideas before they hit the headlines.

Join Today