


| Followers | 499 |
| Posts | 10140 |
| Boards Moderated | 0 |
| Alias Born | 04/28/2014 |
Thursday, May 27, 2021 1:55:03 AM
ASC buy 4.45
Was rooting around the Russell 3000 list entries and saw this one
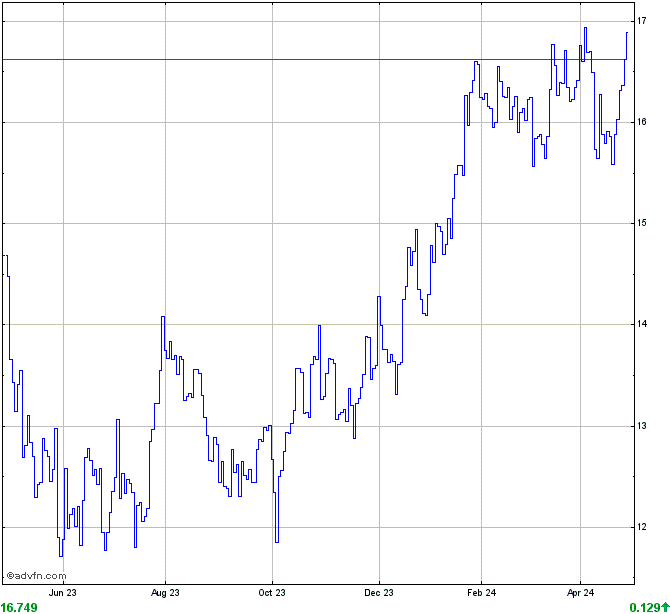
Immediately recognized the inverted head and shoulders pattern on many different charts
Implies many different trade opportunities as defined by the basic pattern structure
Each graph where it is identified has the same trade setup yet on different time frames and profit taking levels
The inverted head and shoulders pattern is a good one to keep in mind, as the trade setup usually has a 2:1 or 3:1 reward to risk ratio, meaning you can be wrong at least half the time and still make a profit.
Basically you buy the breakout of the neckline and place a stop below the right shoulder. The sell target is how deep the head is to the neckline flipped upwards.
As we can usually see the distance from the buy price to the stop level is 1/2 to 1/3 the distance to the sell price target.
for more info on the most accurate pattern to use
https://www.google.com/search?q=inverted+head+and+shoulders
while not certain, this pattern might have a link to a certain guy "Kilroy was here"
https://www.google.com/search?q=kilroy+was+here
and a certain song from the 80's by Styx called Mr. Roboto
https://ardmoreshipping.com/
https://finance.yahoo.com/quote/ASC/profile?p=ASC
https://www.barchart.com/stocks/quotes/ASC
https://finviz.com/quote.ashx?t=ASC
https://www.stockconsultant.com/consultnow/basicplus.cgi?symbol=ASC
https://stockcharts.com/c-sc/sc?chart=ASC,uu[e,a]dhclyiay[uu][pb5!b10!b50!b100!b200!d20,2!h.02,.20!f][vb5!b20][iut!lv8!lk9!LE12,26,9!ll14!la6,13,5!la8,17,9!la12,26,9!uc14!ub14!ub6!lo!lp7,3!lh9,3!LI14,3!lxa!ld8!lq!lg14!lf14][j20444984,y]&r=3555b
https://www.barchart.com/etfs-funds/quotes/ASC/technical-chart?plot=CANDLE&volume=total&data=DO&density=X&pricesOn=1&asPctChange=0&logscale=1&indicators=TREND&sym=ASC&grid=1&height=500&studyheight=100&timeframe=2%20Months
normal chart


log chart


normal chart


log chart


Was rooting around the Russell 3000 list entries and saw this one
Immediately recognized the inverted head and shoulders pattern on many different charts
Implies many different trade opportunities as defined by the basic pattern structure
Each graph where it is identified has the same trade setup yet on different time frames and profit taking levels
The inverted head and shoulders pattern is a good one to keep in mind, as the trade setup usually has a 2:1 or 3:1 reward to risk ratio, meaning you can be wrong at least half the time and still make a profit.
Basically you buy the breakout of the neckline and place a stop below the right shoulder. The sell target is how deep the head is to the neckline flipped upwards.
As we can usually see the distance from the buy price to the stop level is 1/2 to 1/3 the distance to the sell price target.
for more info on the most accurate pattern to use
https://www.google.com/search?q=inverted+head+and+shoulders
while not certain, this pattern might have a link to a certain guy "Kilroy was here"
https://www.google.com/search?q=kilroy+was+here
and a certain song from the 80's by Styx called Mr. Roboto
https://ardmoreshipping.com/
https://finance.yahoo.com/quote/ASC/profile?p=ASC
https://www.barchart.com/stocks/quotes/ASC
https://finviz.com/quote.ashx?t=ASC
https://www.stockconsultant.com/consultnow/basicplus.cgi?symbol=ASC
https://stockcharts.com/c-sc/sc?chart=ASC,uu[e,a]dhclyiay[uu][pb5!b10!b50!b100!b200!d20,2!h.02,.20!f][vb5!b20][iut!lv8!lk9!LE12,26,9!ll14!la6,13,5!la8,17,9!la12,26,9!uc14!ub14!ub6!lo!lp7,3!lh9,3!LI14,3!lxa!ld8!lq!lg14!lf14][j20444984,y]&r=3555b
https://www.barchart.com/etfs-funds/quotes/ASC/technical-chart?plot=CANDLE&volume=total&data=DO&density=X&pricesOn=1&asPctChange=0&logscale=1&indicators=TREND&sym=ASC&grid=1&height=500&studyheight=100&timeframe=2%20Months
normal chart
log chart
normal chart
log chart
Recent ASC News
- Form 6-K - Report of foreign issuer [Rules 13a-16 and 15d-16] • Edgar (US Regulatory) • 05/01/2026 08:05:13 PM
- Ardmore Shipping Announces First Quarter 2026 Conference Call and Webcast • PR Newswire (US) • 04/29/2026 12:30:00 PM
- Ardmore Shipping Provides Update on Fleet Investment, Dividend Policy, and Vessel Sale • PR Newswire (US) • 04/29/2026 12:22:00 PM
- Form 3 - Initial statement of beneficial ownership of securities • Edgar (US Regulatory) • 03/18/2026 11:06:53 PM
- Form 144 - Report of proposed sale of securities • Edgar (US Regulatory) • 03/12/2026 08:11:21 PM
- Ardmore Shipping Files 2025 Annual Report on Form 20-F • PR Newswire (US) • 03/06/2026 10:50:00 PM
- Form 144 - Report of proposed sale of securities • Edgar (US Regulatory) • 03/03/2026 10:41:22 PM
- Form 144 - Report of proposed sale of securities • Edgar (US Regulatory) • 02/23/2026 09:14:31 PM
- Form 144 - Report of proposed sale of securities • Edgar (US Regulatory) • 02/20/2026 09:17:26 PM
- Dry Bulk, Gas (LNG/LPG), and Tanker Shipping Industry Leaders Presenting at the 20th Annual Capital Link International Shipping Forum - Monday, March 9, 2026, New York City • GlobeNewswire Inc. • 02/18/2026 03:00:00 PM
- Global Industry Leaders Presenting at the 20th Annual Capital Link International Shipping Forum - Monday, March 9, 2026, New York City • GlobeNewswire Inc. • 02/17/2026 03:00:00 PM
- Form 6-K - Report of foreign issuer [Rules 13a-16 and 15d-16] • Edgar (US Regulatory) • 02/12/2026 01:05:13 PM
- Ardmore Shipping Corporation Announces Financial Results For The Three and Twelve Months Ended December 31, 2025 • PR Newswire (US) • 02/12/2026 01:00:00 PM
- Ardmore Shipping Announces 2026 Investor Day in New York • PR Newswire (US) • 01/29/2026 09:15:00 PM
- Form 144 - Report of proposed sale of securities • Edgar (US Regulatory) • 12/31/2025 09:02:46 PM
- Form 144 - Report of proposed sale of securities • Edgar (US Regulatory) • 11/07/2025 09:03:06 PM
- Form 6-K - Report of foreign issuer [Rules 13a-16 and 15d-16] • Edgar (US Regulatory) • 11/05/2025 01:07:23 PM
- Form 6-K - Report of foreign issuer [Rules 13a-16 and 15d-16] • Edgar (US Regulatory) • 11/05/2025 01:06:03 PM


