


Sunday, November 29, 2020 9:33:30 AM
TSNP - Buy after a EW 5-Wave Decline
I'll Alert you of stocks to Buy,
before the Run happens !

________________________________________________________________
TSNP Security Details
Share Structure
Market Value1..........$431,844,491 a/o Nov 27, 2020
Authorized Shares...5,000,000,000 a/o Nov 25, 2020
Outstanding Shares..3,996,709,773 a/o Nov 25, 2020
-Restricted.................360,955,260 a/o Nov 25, 2020
-Unrestricted.............3,635,754,513 a/o Nov 25, 2020
Held at DTC...............3,218,397,783 a/o Nov 25, 2020
Float..............3,635,754,513 Jun 18, 2020
Par Value 0.001
https://www.otcmarkets.com/stock/TSNP/security
https://www.otcmarkets.com/stock/TSNP/news
https://www.otcmarkets.com/stock/TSNP/disclosure
https://www.investorpoint.com/stock/TSNP-Tesoro+Enterprs+Inc/price-history/
Authorized Shares,
has No Bearing on the price.
The Shares Authorized,
is not used in any fundamental of financial calculation,
to determine company value.
_________________________________________________________________
________________________________________________________________
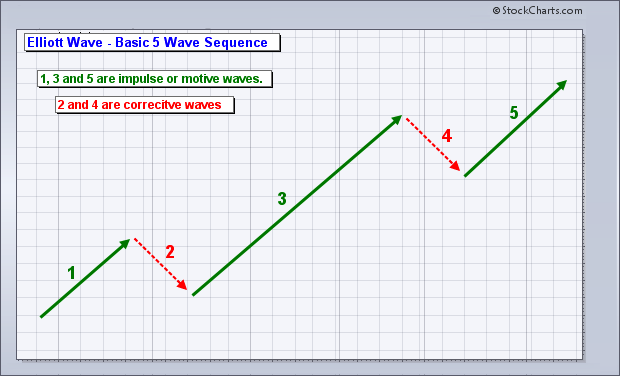
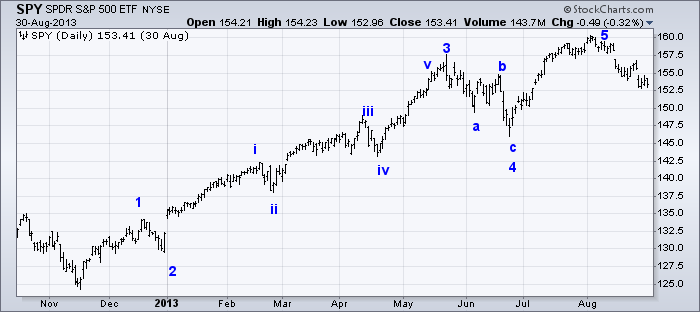
The Elliott Wave 5-Waves Sequence
A Basic "A,B,C Corrective Wave"
https://www.metatrader5.com/en/terminal/help/objects/elliott/elliott_theory
________________________________________________________________


Elliott Wave Basics
http://www.acrotec.com/ewt.htm
Elliott Wave Theory
http://ta.mql4.com/elliott_wave_theory
Buy after an Elliott Wave,
5-Wave decline sequence !
A Basic "A,B,C Corrective Wave"
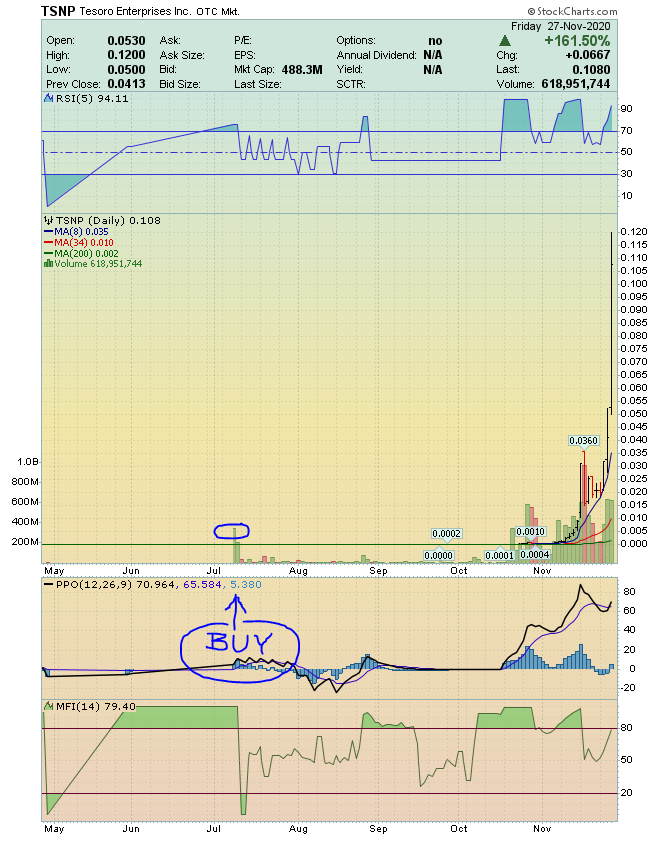
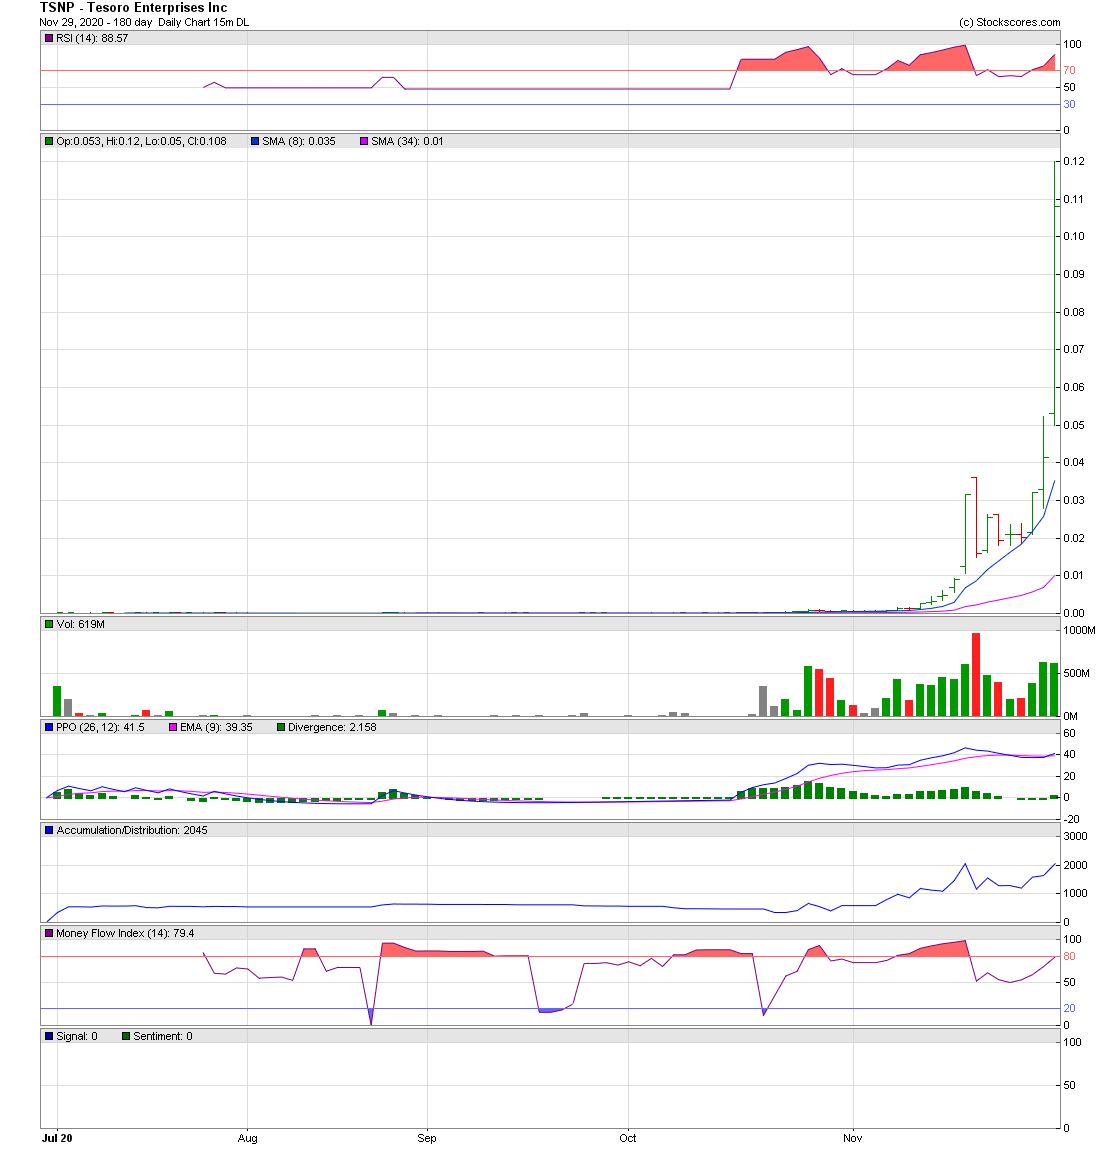
Buy, ONLY when the stocks price,
is trading under the Blue 8-day M.A.
when the Blue 8-day M.A. is under the Red 34-day M.A.
________________________________________________________________
Embedded Chart
________________________________________________________________
Embedded Chart
________________________________________________________________
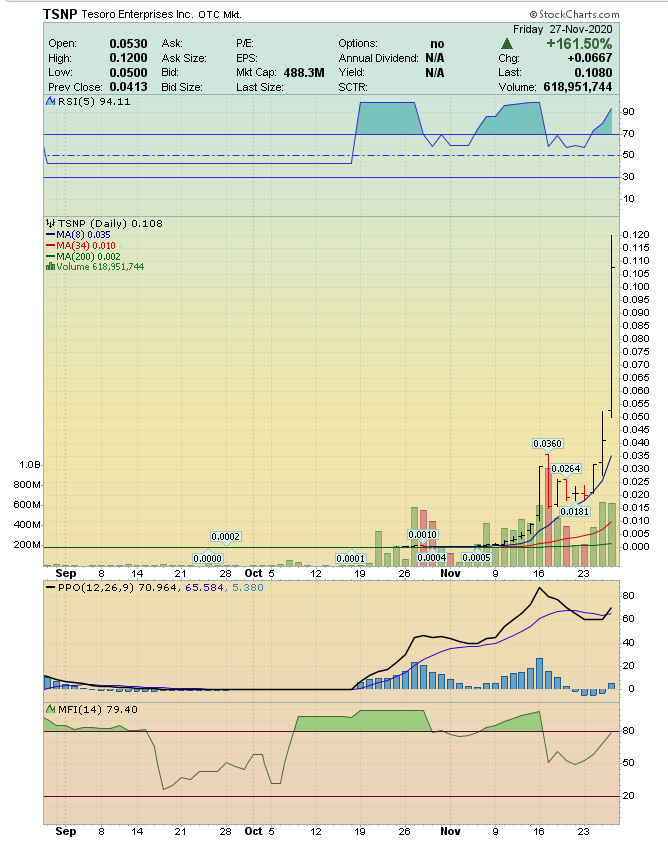
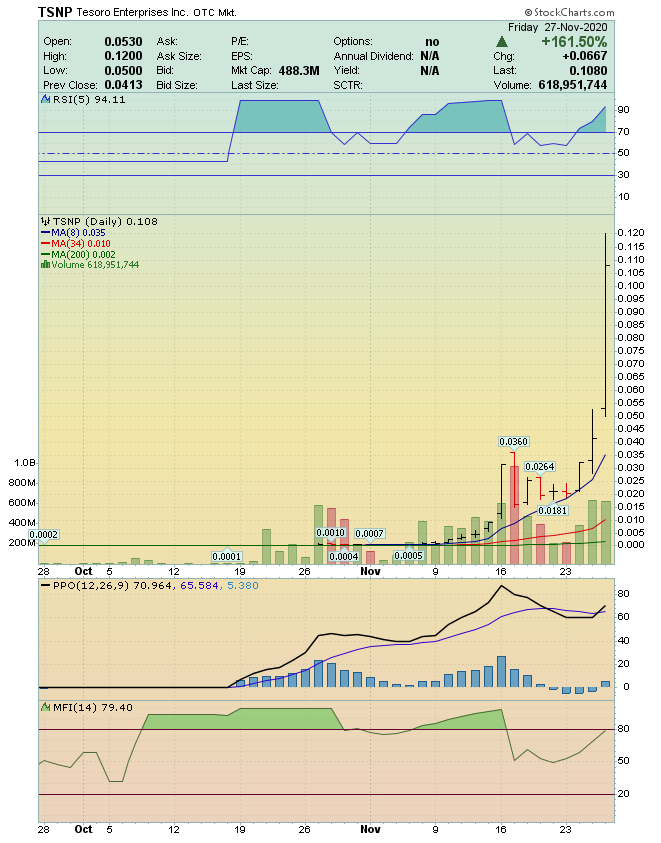
Buy, ONLY when the stocks price,
is trading under the Blue 8-day M.A.
when the Blue 8-day M.A. is under the Red 34-day M.A.
Live! Charts

_______________________________________________________________
Buy, ONLY when the stocks price,
is trading under the Blue 8-day M.A.
when the Blue 8-day M.A. is under the Red 34-day M.A.

________________________________________________________________
Buy, ONLY when the stocks price,
is trading under the Blue 8-day M.A.
when the Blue 8-day M.A. is under the Red 34-day M.A.

________________________________________________________________
Buy, ONLY when the stocks price,
is trading under the Blue 8-day M.A.
when the Blue 8-day M.A. is under the Red 34-day M.A.

________________________________________________________________
Buy, ONLY when the stocks price,
is trading under the Blue 8-day M.A.
when the Blue 8-day M.A. is under the Red 34-day M.A.

________________________________________________________________
Buy, ONLY when the stocks price,
is trading under the Blue 8-day M.A.
when the Blue 8-day M.A. is under the Red 34-day M.A.


________________________________________________________________
Sell after a EW 5-Wave Advance
The Elliott Wave 5-Waves Sequence
A Basic "A,B,C Corrective Wave"
https://www.metatrader5.com/en/terminal/help/objects/elliott/elliott_theory
________________________________________________________________

Elliott Wave Basics
http://www.acrotec.com/ewt.htm
Elliott Wave Theory
http://ta.mql4.com/elliott_wave_theory
Buy after an Elliott Wave,
5-Wave decline sequence !
A Basic "A,B,C Corrective Wave"
Buy, ONLY when the stocks price,
is trading under the Blue 8-day M.A.
when the Blue 8-day M.A. is under the Red 34-day M.A.
_________________________________________________________________
Live! Charts
________________________________________________________________
Buy, ONLY when the stocks price,
is trading under the Blue 8-day M.A.
when the Blue 8-day M.A. is under the Red 34-day M.A.

_________________________________________________________________
Buy, ONLY when the stocks price,
is trading under the Blue 8-day M.A.
when the Blue 8-day M.A. is under the Red 34-day M.A.

_________________________________________________________________
Buy, ONLY when the stocks price,
is trading under the Blue 8-day M.A.
when the Blue 8-day M.A. is under the Red 34-day M.A.

_________________________________________________________________
Buy, ONLY when the stocks price,
is trading under the Blue 8-day M.A.
when the Blue 8-day M.A. is under the Red 34-day M.A.
_________________________________________________________________
Buy, ONLY when the stocks price,
is trading under the Blue 8-day M.A.
when the Blue 8-day M.A. is under the Red 34-day M.A.
_________________________________________________________________
Buy, ONLY when the stocks price,
is trading under the Blue 8-day M.A.
when the Blue 8-day M.A. is under the Red 34-day M.A.

_______________________________________________________________
Sell after a EW 5-Wave Advance
________________________________________________________________
The Elliott Wave 5-Waves Sequence
A Basic "A,B,C Corrective Wave"
https://www.metatrader5.com/en/terminal/help/objects/elliott/elliott_theory
________________________________________________________________
________________________________________________________________
Impulse Wave 1 - The Accumulation Stage
the Wave right after a prolonged downtrend.
Wave 1
The stock makes its initial move upwards.
This is usually caused
by a relatively small number of people
that all of the sudden
(for a variety of reasons, real or imagined)
feel that the price of the stock is cheap
so it’s a perfect time to buy.
This causes the price to rise.
Wave 2 - Stock Declines
At this point,
enough people who were in the original wave
consider the stock overvalued and take profits.
This causes the stock to go down.
However, the stock will not make it to its previous lows
before the stock is considered a bargain again
Wave 3
This is usually the longest and strongest wave.
The stock has caught the attention of the mass public.
More people find out about the stock and want to buy it.
This causes the stock’s price to go higher and higher.
This wave usually exceeds the high created at the end of Wave 1.
Wave 4
Traders take profits
because the stock is considered expensive again.
This Wave tends to be weak
because there are usually more people
that are still bullish on the stock
and are waiting to “buy on the dips.”
Wave 5
This is the point that most people get in on the stock,
and is mostly driven by hysteria.
You usually start seeing the CEO of the company
on the front page of major magazines
as the Person of the Year.
Traders and investors start coming up with
ridiculous reasons to buy the stock
and try to choke you when you disagree with them.
This is when the stock becomes the most overpriced.
Contrarians start shorting the stock
which starts the ABC pattern.
_________________________________________________________________

I'll Alert you of stocks to Buy,
before the Run happens !

________________________________________________________________

TSNP Security Details
Share Structure
Market Value1..........$431,844,491 a/o Nov 27, 2020
Authorized Shares...5,000,000,000 a/o Nov 25, 2020
Outstanding Shares..3,996,709,773 a/o Nov 25, 2020
-Restricted.................360,955,260 a/o Nov 25, 2020
-Unrestricted.............3,635,754,513 a/o Nov 25, 2020
Held at DTC...............3,218,397,783 a/o Nov 25, 2020
Float..............3,635,754,513 Jun 18, 2020
Par Value 0.001
https://www.otcmarkets.com/stock/TSNP/security
https://www.otcmarkets.com/stock/TSNP/news
https://www.otcmarkets.com/stock/TSNP/disclosure
https://www.investorpoint.com/stock/TSNP-Tesoro+Enterprs+Inc/price-history/
Authorized Shares,
has No Bearing on the price.
The Shares Authorized,
is not used in any fundamental of financial calculation,
to determine company value.
_________________________________________________________________
________________________________________________________________
The Elliott Wave 5-Waves Sequence
A Basic "A,B,C Corrective Wave"
https://www.metatrader5.com/en/terminal/help/objects/elliott/elliott_theory
________________________________________________________________


Elliott Wave Basics
http://www.acrotec.com/ewt.htm
Elliott Wave Theory
http://ta.mql4.com/elliott_wave_theory
Buy after an Elliott Wave,
5-Wave decline sequence !
A Basic "A,B,C Corrective Wave"
Buy, ONLY when the stocks price,
is trading under the Blue 8-day M.A.
when the Blue 8-day M.A. is under the Red 34-day M.A.
________________________________________________________________
Embedded Chart


________________________________________________________________


Embedded Chart
________________________________________________________________
Buy, ONLY when the stocks price,
is trading under the Blue 8-day M.A.
when the Blue 8-day M.A. is under the Red 34-day M.A.
Live! Charts
_______________________________________________________________
Buy, ONLY when the stocks price,
is trading under the Blue 8-day M.A.
when the Blue 8-day M.A. is under the Red 34-day M.A.
________________________________________________________________
Buy, ONLY when the stocks price,
is trading under the Blue 8-day M.A.
when the Blue 8-day M.A. is under the Red 34-day M.A.
________________________________________________________________
Buy, ONLY when the stocks price,
is trading under the Blue 8-day M.A.
when the Blue 8-day M.A. is under the Red 34-day M.A.
________________________________________________________________
Buy, ONLY when the stocks price,
is trading under the Blue 8-day M.A.
when the Blue 8-day M.A. is under the Red 34-day M.A.
________________________________________________________________
Buy, ONLY when the stocks price,
is trading under the Blue 8-day M.A.
when the Blue 8-day M.A. is under the Red 34-day M.A.
________________________________________________________________
Sell after a EW 5-Wave Advance
The Elliott Wave 5-Waves Sequence
A Basic "A,B,C Corrective Wave"
https://www.metatrader5.com/en/terminal/help/objects/elliott/elliott_theory
________________________________________________________________


Elliott Wave Basics
http://www.acrotec.com/ewt.htm
Elliott Wave Theory
http://ta.mql4.com/elliott_wave_theory
Buy after an Elliott Wave,
5-Wave decline sequence !
A Basic "A,B,C Corrective Wave"
Buy, ONLY when the stocks price,
is trading under the Blue 8-day M.A.
when the Blue 8-day M.A. is under the Red 34-day M.A.
_________________________________________________________________
Live! Charts
________________________________________________________________
Buy, ONLY when the stocks price,
is trading under the Blue 8-day M.A.
when the Blue 8-day M.A. is under the Red 34-day M.A.
_________________________________________________________________
Buy, ONLY when the stocks price,
is trading under the Blue 8-day M.A.
when the Blue 8-day M.A. is under the Red 34-day M.A.
_________________________________________________________________
Buy, ONLY when the stocks price,
is trading under the Blue 8-day M.A.
when the Blue 8-day M.A. is under the Red 34-day M.A.
_________________________________________________________________
Buy, ONLY when the stocks price,
is trading under the Blue 8-day M.A.
when the Blue 8-day M.A. is under the Red 34-day M.A.
_________________________________________________________________
Buy, ONLY when the stocks price,
is trading under the Blue 8-day M.A.
when the Blue 8-day M.A. is under the Red 34-day M.A.
_________________________________________________________________
Buy, ONLY when the stocks price,
is trading under the Blue 8-day M.A.
when the Blue 8-day M.A. is under the Red 34-day M.A.
_______________________________________________________________
Sell after a EW 5-Wave Advance
________________________________________________________________
The Elliott Wave 5-Waves Sequence
A Basic "A,B,C Corrective Wave"
https://www.metatrader5.com/en/terminal/help/objects/elliott/elliott_theory
________________________________________________________________

________________________________________________________________
Impulse Wave 1 - The Accumulation Stage
the Wave right after a prolonged downtrend.
Wave 1
The stock makes its initial move upwards.
This is usually caused
by a relatively small number of people
that all of the sudden
(for a variety of reasons, real or imagined)
feel that the price of the stock is cheap
so it’s a perfect time to buy.
This causes the price to rise.
Wave 2 - Stock Declines
At this point,
enough people who were in the original wave
consider the stock overvalued and take profits.
This causes the stock to go down.
However, the stock will not make it to its previous lows
before the stock is considered a bargain again
Wave 3
This is usually the longest and strongest wave.
The stock has caught the attention of the mass public.
More people find out about the stock and want to buy it.
This causes the stock’s price to go higher and higher.
This wave usually exceeds the high created at the end of Wave 1.
Wave 4
Traders take profits
because the stock is considered expensive again.
This Wave tends to be weak
because there are usually more people
that are still bullish on the stock
and are waiting to “buy on the dips.”
Wave 5
This is the point that most people get in on the stock,
and is mostly driven by hysteria.
You usually start seeing the CEO of the company
on the front page of major magazines
as the Person of the Year.
Traders and investors start coming up with
ridiculous reasons to buy the stock
and try to choke you when you disagree with them.
This is when the stock becomes the most overpriced.
Contrarians start shorting the stock
which starts the ABC pattern.
_________________________________________________________________


Recent RWAX News
- Form 10-Q - Quarterly report [Sections 13 or 15(d)] • Edgar (US Regulatory) • 05/13/2026 08:05:57 PM
- TAP Real Estate Welcomes Jeff Jarrard as Chief Technology Officer • GlobeNewswire Inc. • 04/09/2026 10:10:00 PM
- Form 8-K - Current report • Edgar (US Regulatory) • 04/06/2026 08:05:24 PM
- Form 10-K - Annual report [Section 13 and 15(d), not S-K Item 405] • Edgar (US Regulatory) • 03/31/2026 05:17:19 PM
- Form 8-K - Current report • Edgar (US Regulatory) • 03/30/2026 01:05:32 PM
- TAP Real Estate Technologies Announces Completion of Corporate Name Change and New Ticker Symbol • GlobeNewswire Inc. • 03/04/2026 10:13:00 PM


