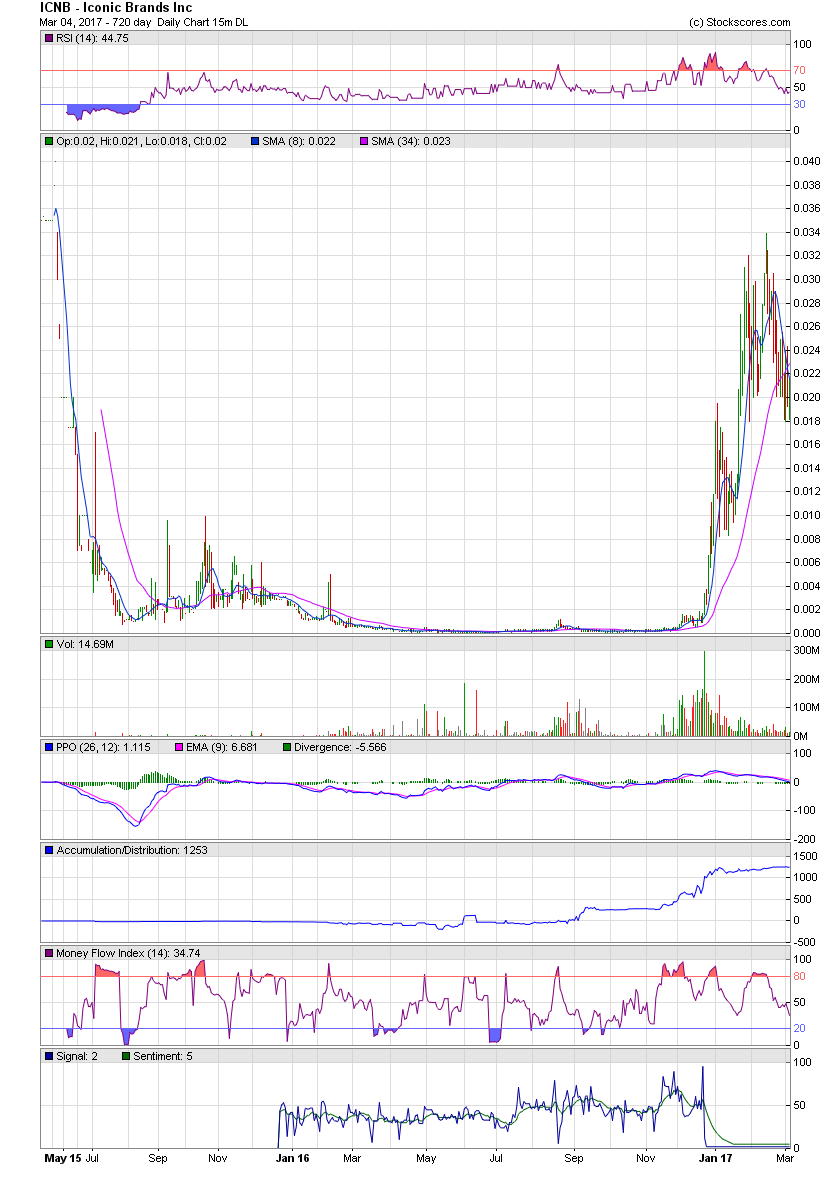
ENZC - ICNB - Comparison Analysis I'll Alert you of stocks to Buy, before the Run happens ! https://investorshub.advfn.com/uicon/155361.png?cb=636360310707230000 _________________________________________________________________ ICNB Security Details Share Structure Market Value1.............$112,747 a/o Aug 16, 2016 Authorized Shares...2,500,000,000 a/o Aug 11, 2016 Outstanding Shares....544,355,321 a/o Aug 11, 2016 -Unrestricted.........478,953,438 a/o Aug 11, 2016 Float................. 544,355,321 a/o Aug 11, 2016 Par Value 0.001 _________________________________________________________________ ENZC Security Details Share Structure Market Value1...........$31,702,711 a/o Oct 14, 2020 Authorized Shares...3,000,000,000 a/o Sep 30, 2020 Outstanding Shares..2,438,670,097 a/o Sep 30, 2020 Restricted..............767,839,585 a/o Sep 30, 2020 Unrestricted..........1,670,830,512 a/o Sep 30, 2020 Held at DTC...........1,271,629,924 a/o Sep 30, 2020 Float..................... Not Available Par Value 0.001 https://www.otcmarkets.com/stock/ENZC/security Authorized Shares, has No Bearing on the price . The Shares Authorized, is not used in any fundamental of financial calculation, to determine company value . _________________________________________________________________ https://investorshub.advfn.com/uicon/155361.png?cb=636360310707230000 _________________________________________________________________ Embedded and Live! Charts https://investorshub.advfn.com/uimage/uploads/2017/7/28/rzmsfICNB_Declines_from_$0.03.png https://www.stockscores.com/chart.asp?TickerSymbol=ENZC&TimeRange=1095&Interval=d&Volume=1&ChartType=OHLC&Stockscores=1&ChartWidth=1100&ChartHeight=480&LogScale=None&Band=None&avgType1=SMA&movAvg1=8&avgType2=SMA&movAvg2=34&Indicator1=RSI&Indicator2=PPO&Indicator3=AccDist&Indicator4=MFI&endDate=&CompareWith=&entryPrice=&stopLossPrice= https://investorshub.advfn.com/uicon/155361.png?cb=636360310707230000 ________________________________________________________________ https://investorshub.advfn.com/uimage/uploads/2018/12/5/xqilcICNB_Dec_5._2018_Weekly_Chart_shows_it_Declined_from_0.034_and_returned_to_0.034.png https://www.stockscores.com/chart.asp?TickerSymbol=ENZC&TimeRange=1095&Interval=w&Volume=1&ChartType=OHLC&Stockscores=1&ChartWidth=1100&ChartHeight=480&LogScale=None&Band=None&avgType1=SMA&movAvg1=8&avgType2=SMA&movAvg2=34&Indicator1=RSI&Indicator2=PPO&Indicator3=AccDist&Indicator4=MFI&endDate=&CompareWith=&entryPrice=&stopLossPrice= https://investorshub.advfn.com/uicon/155361.png?cb=636360310707230000
 Market Data
  Markets