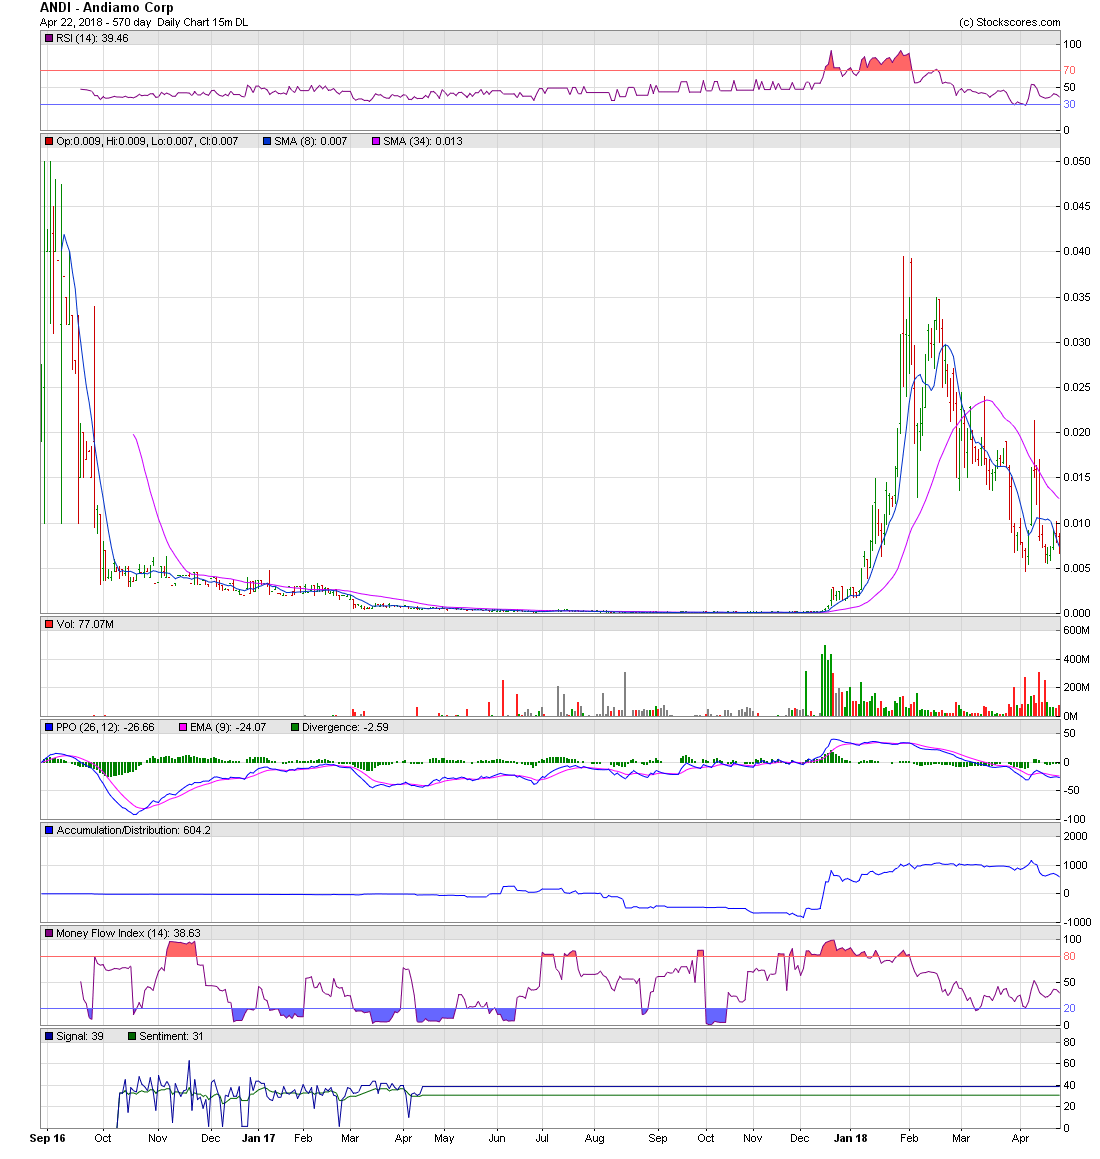
DPLS - ANDI - Buy after a EW Decline Buy after an Elliott Wave 5-Wave Decline https://investorshub.advfn.com/uicon/155361.png?cb=636360310707230000 ________________________________________________________________ The Elliott Wave 5-Waves Sequence A Basic "A,B,C Corrective Wave" https://www.metatrader5.com/en/terminal/help/objects/elliott/elliott_theory ________________________________________________________________ https://investorshub.advfn.com/uimage/uploads/2017/2/16/vvrclElliott_Wave_Decline_8_Wave.png https://investorshub.advfn.com/uimage/uploads/2017/2/16/hgymrElliott_Wave_Chart.png Elliott Wave Basics http://www.acrotec.com/ewt.htm Elliott Wave Theory http://ta.mql4.com/elliott_wave_theory Buy after an Elliott Wave, 5-Wave decline sequence ! A Basic "A,B,C Corrective Wave" Buy, ONLY when the stocks price, is trading under the Blue 8-day M.A. when the Blue 8-day M.A. is under the Red 34-day M.A . ________________________________________________________________ Live! and Embedded Charts https://investorshub.advfn.com/uimage/uploads/2017/12/21/xoowoANDI_Dec_20_Chart_2.png https://www.stockscores.com/chart.asp?TickerSymbol=DPLS&TimeRange=450&Interval=d&Volume=1&ChartType=OHLC&Stockscores=1&ChartWidth=1100&ChartHeight=480&LogScale=None&Band=None&avgType1=SMA&movAvg1=8&avgType2=SMA&movAvg2=34&Indicator1=RSI&Indicator2=PPO&Indicator3=AccDist&Indicator4=MFI&endDate=&CompareWith=&entryPrice=&stopLossPrice= ________________________________________________________________ https://investorshub.advfn.com/uimage/uploads/2017/2/16/hgymrElliott_Wave_Chart.png Buy, ONLY when the stocks price, is trading under the Blue 8-day M.A. when the Blue 8-day M.A. is under the Red 34-day M.A . https://investorshub.advfn.com/uimage/uploads/2018/4/22/qnqpfANDI_Apr_22_Chart_1.png https://www.stockscores.com/chart.asp?TickerSymbol=DPLS&TimeRange=600&Interval=d&Volume=1&ChartType=OHLC&Stockscores=1&ChartWidth=1100&ChartHeight=480&LogScale=None&Band=None&avgType1=SMA&movAvg1=8&avgType2=SMA&movAvg2=34&Indicator1=RSI&Indicator2=PPO&Indicator3=AccDist&Indicator4=MFI&endDate=&CompareWith=&entryPrice=&stopLossPrice= ________________________________________________________________ https://investorshub.advfn.com/uimage/uploads/2017/2/16/hgymrElliott_Wave_Chart.png Buy, ONLY when the stocks price, is trading under the Blue 8-day M.A. when the Blue 8-day M.A. is under the Red 34-day M.A . https://investorshub.advfn.com/uimage/uploads/2018/4/22/qnqpfANDI_Apr_22_Chart_1.png https://www.stockscores.com/chart.asp?TickerSymbol=DPLS&TimeRange=630&Interval=d&Volume=1&ChartType=OHLC&Stockscores=1&ChartWidth=1100&ChartHeight=480&LogScale=None&Band=None&avgType1=SMA&movAvg1=8&avgType2=SMA&movAvg2=34&Indicator1=RSI&Indicator2=PPO&Indicator3=AccDist&Indicator4=MFI&endDate=&CompareWith=&entryPrice=&stopLossPrice= https://investorshub.advfn.com/uicon/155361.png?cb=636360310707230000 https://investorshub.advfn.com/uimage/uploads/2013/8/15/erfjyBig_Wave.jpg
 Market Data
  Markets