


Thursday, June 18, 2020 2:01:17 AM
Stock Scans: Our Boards Exclusive List
for Thursday, June 18, 2020
Developed by: Trader53

________________________________________________________________
Trader53's Wealth Strategy
https://investorshub.advfn.com/boards/read_msg.aspx?message_id=127409561
* Buy 2 Million Shares of every 0.0001 that you like !
* Most 0.0001's will climb to 0.0003 / 0.0004
* Many 0.0001's will climb to 0.0012 and Higher
* Some 0.0001's will climb to $0.01 and Higher
________________________________________________________________
Triple 000 Traders - It's Time To Get Loaded!
https://investorshub.advfn.com/boards/read_msg.aspx?message_id=147899327
* Buy 2 Million Shares of every 0.0001 that you like !
http://investorshub.advfn.com/boards/read_msg.aspx?message_id=127409561
* Always try to Buy at 0.0001
https://investorshub.advfn.com/boards/read_msg.aspx?message_id=135552117
________________________________________________________________
I'll Alert you of stocks to Buy,
before the Run happens !

________________________________________________________________
Note:
This Boards objective,
is to make MONEY for its readers,
by ALERTING them to stocks that are ready to Buy,
before they have their move-up and their "RUN".
________________________________________________________________
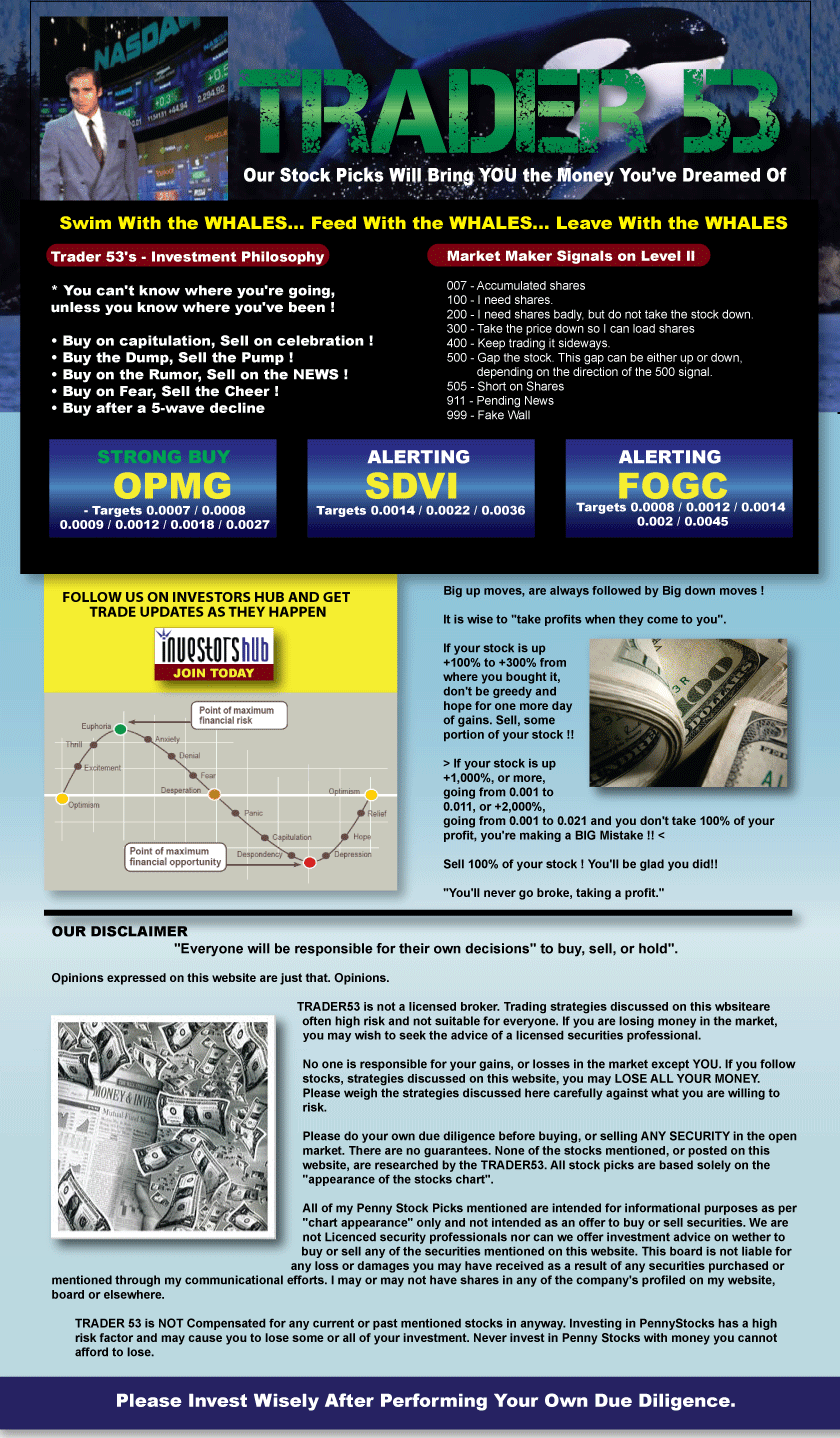
Market Maker Signals - Explained
Market Maker Signals
Penny traders believe that Market Makers (MM)
will "signal" moves in advance buy using
small amounts of buys or sells as "signals".
The "signals" are such a small amount of shares
(worth no more than 5 or 10 dollars) that
no trader would have paid a commission that
costs more than the amount of shares bought.
The "signals" are from one MM to another.
100 - I need shares.
200 - I need shares badly, but do not take the stock down.
300 - Take the price down so I can load shares
400 - Keep trading it sideways.
500 - Gap the stock.
This gap can be either up or down,
depending on the direction of the 500 signal.
505 - I am short on shares
600 - Means provide resistance
900 - Means let the stock float
911 - Pending News/Press Release On The Way
1000 - Don't let it run
2100 - Let it run
http://www.pennystockdream.com/Market-Maker-Signals
Understanding the Form T-Trade:
If a market maker wants to accumulate
a large amount of a stock in one trading day,
that market maker may actually not report
any of the trades that occurred
until the trading day has ended
so as not to alert the market to the collection.
http://investorshub.advfn.com/boards/read_msg.aspx?message_id=120820833&txt2find=understanding
________________________________________________________________
________________________________________________________________
Stock Scores Chart Links
https://www.stockscores.com/charts/charts/?ticker=%24SPX
http://stockcharts.com/h-sc/ui?s=%24SPX&p=D&yr=3&mn=0&dy=0&id=p16291900332
________________________________________________________________
StockTA.com Screen
http://www.stockta.com/
http://www.stockta.com/cgi-bin/screen.pl
________________________________________________________________
Scan: Long-Term Bullish Breakout
http://www.stockta.com/cgi-bin/screen.pl?cobrand=&price=&price=0.005&volume=&volume=&country=&alert=33&action=Display&orderTag=%20price&order=ASC
Symbol price volume
FTWS 0.00010 36,074,200 0.24 0.29 0.20 0.23
SKYF 0.00010 100,000 0.27 0.19 0.21 0.40
VAPE 0.00020 482,200 0.15 0.33 -0.06 0.17
RETC 0.00020 12,660,000 0.18 0.14 0.21 0.19
IGEX 0.00020 16,321,300 0.28 0.36 0.35 0.13
IMTL 0.00020 3,870,000 0.35 0.30 0.50 0.24
ACGI 0.00020 5,000 0.24 0.31 0.25 0.16
BIGG 0.00020 196,200 0.09 0.13 0.03 0.12
SDVI 0.00020 26,448,600 0.18 0.10 0.06 0.38
XSNX 0.00030 2,538,200 0.28 0.38 0.33 0.11
ESPIQ 0.00030 39,800 0.16 0.23 0.04 0.21
SFOR 0.00040 81,977,800 0.15 0.41 0.01 0.03
AFTC 0.00050 100,000 0.34 0.12 0.46 0.45
KPAY 0.00060 4,424,200 0.17 0.24 0.19 0.08
FONU 0.00060 15,774,100 0.28 0.23 0.12 0.49
SSOF 0.00070 247,500 0.24 0.19 0.44 0.10
AVEW 0.00070 50,000 0.48 0.32 0.49 0.63
PTOP 0.00070 14,569,300 0.34 0.25 0.44 0.33
ARWD 0.00070 100,000 0.05 0.14 -0.01 0.03
ARSN 0.00080 50,961,700 0.23 0.30 0.44 -0.04
CZNI 0.00110 7,648,800 0.21 0.04 -0.02 0.61
TISDZ 0.00120 1,600 0.22 0.21 0.34 0.11
GMNI 0.00140 97,000 0.25 0.28 0.35 0.12
IDVV 0.00150 29,900 0.14 0.18 0.14 0.11
SPRL 0.00170 357,000 0.23 0.30 0.42 -0.04
CFE.AU 0.00200 621,429 0.09 -0.03 0.12 0.18
Scan: Short-Term Bullish Breakout
http://www.stockta.com/cgi-bin/screen.pl?cobrand=&price=&price=0.005&volume=&volume=&country=&alert=41&action=Display&orderTag=%20price&order=ASC
Symbol price volume
SFOR 0.00040 81,977,800 0.15 0.41 0.01 0.03
IPAH 0.00070 5,000 0.41 0.48 0.48 0.28
EMBR 0.00070 1,360,000 0.30 0.54 0.27 0.09
BYRG 0.00080 1,706,900 0.42 0.43 0.31 0.52
VSPC 0.00080 25,400 0.20 0.16 0.17 0.27
VGTL 0.00080 4,172,700 0.27 0.25 0.27 0.28
PLPL 0.00090 920,600 0.26 0.34 0.06 0.38
BIEI 0.00110 27,168,300 0.21 0.24 0.12 0.26
ITKH 0.00120 202,000 0.33 0.51 0.29 0.17
PFNO 0.00120 20,518,300 0.36 0.38 0.19 0.50
GACR 0.00130 1,270,500 0.48 0.61 0.31 0.51
PTSC 0.00130 1,155,900 0.24 0.24 0.06 0.40
BABL 0.00160 10,000 0.29 0.13 0.35 0.39
VHUB 0.00160 5,000 0.15 0.01 0.10 0.33
IMNPQ 0.00190 673,300 0.31 0.42 0.21 0.29
GAHC 0.00190 5,445,500 0.08 0.01 0.06 0.16
AOA.AU 0.00200 0 0.32 0.39 0.27 0.29
INTK 0.00200 2,792,400 0.37 0.35 0.38 0.37
Scan: ABC Down
http://www.stockta.com/cgi-bin/screen.pl?technical=shortFib<=-.66&technical=interFib<=-.5&technical=longFib<=-.55&action=Display&cobrand=&orderTag=%20price&order=ASC&start=0
Number of stocks returned = 303
Symbol price volume - short Fib - inter Fib - long Fib
MYGG 0.00010 30,400 0.05 -0.08 0.08 0.16 -1.00 -1.00 -1.00
ATPT 0.00010 2,221,500 0.15 0.07 0.23 0.15 -1.00 -1.00 -1.00
LDHL 0.00020 15,200 -0.34 -0.28 -0.36 -0.39 -1.00 -1.00 -1.00
FBER 0.00020 200 0.13 0.12 0.09 0.16 -1.00 -1.00 -1.00
NVIC 0.00020 25,000 0.05 -0.02 -0.03 0.20 -1.00 -1.00 -1.00
TRBO 0.00030 595,000 -0.00 -0.02 0.08 -0.07 -1.00 -1.00 -1.00
PCLI 0.00040 338,500 0.08 0.10 0.03 0.11 -1.00 -1.00 -1.00
XYNH 0.00050 3,000 0.10 0.07 0.08 0.16 -1.00 -1.00 -1.00
SYNJ 0.00060 23,000 0.04 -0.05 0.05 0.10 -1.00 -1.00 -1.00
ROTH 0.00070 15,000 0.08 0.07 0.06 0.11 -1.00 -1.00 -1.00
DRSV 0.00100 10,000 0.08 -0.01 0.09 0.15 -1.00 -1.00 -1.00
AXXDF 0.00100 600 -0.61 -0.68 -0.52 -0.62 -1.00 -1.00 -1.00
RGBPP 0.00110 1,400 0.05 -0.02 0.03 0.13 -1.00 -1.00 -1.00
RYMM 0.00120 100,000 0.04 -0.01 0.06 0.06 -1.00 -1.00 -1.00
SSTU 0.00120 46,000 -0.14 -0.09 -0.05 -0.26 -1.00 -1.00 -1.00
PXYN 0.00150 1,206,100 0.15 0.19 0.14 0.13 -1.00 -1.00 -1.00
MYSN 0.00170 2,300 -0.07 0.10 -0.12 -0.18 -1.00 -1.00 -1.00
BZTG 0.00180 120,000 0.09 0.09 0.08 0.08 -1.00 -1.00 -1.00
Scan: 0.0003 Overall Bullish
http://www.stockta.com/cgi-bin/screen.pl?cobrand=&price=0.0003&price=0.0003&volume=&volume=&country=&technical=overAnal%3C.5+and+overAnal%3E%3D.25&action=Display&orderTag=%20volume&order=DESC
http://www.stockta.com/cgi-bin/screen.pl?cobrand=&price=0.0003&price=0.0003&volume=&volume=&country=&technical=overAnal%3C.5+and+overAnal%3E%3D.25&action=Display&orderTag=%20fund.symb&order=ASC
Number of stocks returned = 14
Symbol price volume
AAGC 0.00030 3,725,500 0.32 0.32 0.23 0.40 0.32
EGOC 0.00030 4,035,700 0.36 0.45 0.35 0.28 0.36
FERN 0.00030 200 0.36 0.21 0.48 0.39 0.36
GEGI 0.00030 1,037,000 0.49 0.59 0.46 0.44 0.49
GFTX 0.00030 3,700,000 0.29 0.31 0.42 0.14 0.29
HYWI 0.00030 16,622,400 0.28 0.40 0.17 0.29 0.28
ICLD 0.00030 449,500 0.27 0.35 0.10 0.35 0.27
IDCN 0.00030 1,485,100 0.45 0.54 0.46 0.34 0.45
LVGI 0.00030 10,273,800 0.45 0.57 0.40 0.38 0.45
SRMX 0.00030 1,401,700 0.30 0.29 0.21 0.39 0.30
VNUE 0.00030 3,578,100 0.35 0.23 0.44 0.39 0.35
VPOR 0.00030 14,906,600 0.34 0.09 0.54 0.39 0.34
XSNX 0.00030 2,538,200 0.28 0.38 0.33 0.11 0.28
ZONX 0.00030 1,023,400 0.38 0.33 0.40 0.40 0.38
Scan: 0.0003 Overall Neutral
http://www.stockta.com/cgi-bin/screen.pl?cobrand=&price=0.0003&price=0.0003&volume=&volume=&country=&technical=overAnal%3C.25and+overAnal%3E-.25&action=Display&orderTag=%20volume&order=DESC
http://www.stockta.com/cgi-bin/screen.pl?cobrand=&price=0.0003&price=0.0003&volume=&volume=&country=&technical=overAnal%3C.25and+overAnal%3E-.25&action=Display&orderTag=%20fund.symb&order=ASC
Number of stocks returned = 16
Symbol price volume
AVVH 0.00030 410,000 0.17 0.21 0.06 0.23 0.17
DUTV 0.00030 12,500 0.23 0.24 0.10 0.34 0.23
ECIGQ 0.00030 18,500 0.21 0.13 0.23 0.26 0.21
ESPIQ 0.00030 39,800 0.16 0.23 0.04 0.21 0.16
GNLKQ 0.00030 400 0.14 0.19 0.02 0.19 0.14
HQGE 0.00030 46,293,400 0.06 -0.02 -0.05 0.25 0.06
OMHE 0.00030 27,300 0.20 0.20 0.19 0.22 0.20
PDGO 0.00030 5,160,000 0.19 0.13 0.17 0.27 0.19
PLNTQ 0.00030 1,000 0.22 0.02 0.23 0.39 0.22
RNVA 0.00030 225,429,800 0.16 0.21 0.06 0.20 0.16
SCTN 0.00030 1,000 0.15 0.14 0.04 0.26 0.15
SLJB 0.00030 100,000 0.21 0.17 0.17 0.29 0.21
SNRY 0.00030 7,501,000 0.25 0.45 0.02 0.28 0.25
TMGI 0.00030 2,464,600 0.15 0.10 0.25 0.11 0.15
TNKE 0.00030 280,000 0.13 0.15 0.21 0.02 0.13
TRBO 0.00030 595,000 -0.00 -0.02 0.08 -0.07 -0.00
Scan: 0.0002 Overall Bullish
http://www.stockta.com/cgi-bin/screen.pl?cobrand=&price=0.0002&price=0.0002&volume=&volume=&country=&technical=overAnal%3C.5+and+overAnal%3E%3D.25&action=Display&orderTag=%20volume&order=DESC
http://www.stockta.com/cgi-bin/screen.pl?cobrand=&price=0.0002&price=0.0002&volume=&volume=&country=&technical=overAnal%3C.5+and+overAnal%3E%3D.25&action=Display&orderTag=%20fund.symb&order=ASC
Number of stocks returned = 28
Symbol price volume
ACTL 0.00020 100,000 0.37 0.38 0.40 0.34 0.37
ADGO 0.00020 2,265,300 0.27 0.38 0.33 0.11 0.27
AFOM 0.00020 16,988,000 0.26 0.23 0.44 0.10 0.26
APTY 0.00020 1,070,000 0.33 0.30 0.25 0.44 0.33
ASTI 0.00020 15,427,800 0.37 0.26 0.46 0.40 0.37
DSCR 0.00020 4,031,800 0.45 0.54 0.42 0.38 0.45
ETEK 0.00020 5,150,000 0.35 0.58 0.12 0.33 0.35
FPFI 0.00020 2,557,900 0.34 0.42 0.27 0.32 0.34
GGII 0.00020 1,012,500 0.32 0.49 0.08 0.38 0.32
HIHI 0.00020 908,300 0.33 0.40 0.21 0.40 0.33
HYBE 0.00020 27,300 0.30 0.32 0.27 0.32 0.30
IBRC 0.00020 773,373,500 0.27 0.10 0.52 0.20 0.27
IGEX 0.00020 16,321,300 0.28 0.36 0.35 0.13 0.28
ILST 0.00020 200,000 0.25 0.40 0.04 0.31 0.25
IMTL 0.00020 3,870,000 0.35 0.30 0.50 0.24 0.35
KATX 0.00020 50,000 0.33 0.35 0.19 0.46 0.33
MEDT 0.00020 105,100 0.27 0.21 0.25 0.34 0.27
MJTV 0.00020 2,000,000 0.34 0.33 0.33 0.36 0.34
NNRX 0.00020 9,452,400 0.28 -0.01 0.58 0.27 0.28
NOUV 0.00020 6,765,000 0.31 0.49 0.12 0.31 0.31
PHIL 0.00020 27,447,900 0.25 -0.04 0.48 0.33 0.25
SEGI 0.00020 1,000,200 0.36 0.36 0.27 0.46 0.36
SHMN 0.00020 12,100,000 0.35 0.29 0.35 0.41 0.35
TGGI 0.00020 9,618,300 0.33 0.37 0.38 0.24 0.33
USMJ 0.00020 10,828,600 0.33 0.52 0.17 0.31 0.33
VOIS 0.00020 120,100 0.26 0.34 0.10 0.33 0.26
WCVC 0.00020 13,427,300 0.32 0.35 0.40 0.23 0.32
XREG 0.00020 5,001,100 0.36 0.34 0.38 0.36 0.36
Scan: 0.0002 Overall Neutral
http://www.stockta.com/cgi-bin/screen.pl?cobrand=&price=0.0002&price=0.0002&volume=&volume=&country=&technical=overAnal%3C.25and+overAnal%3E-.25&action=Display&orderTag=%20volume&order=DESC
http://www.stockta.com/cgi-bin/screen.pl?cobrand=&price=0.0002&price=0.0002&volume=&volume=&country=&technical=overAnal%3C.25and+overAnal%3E-.25&action=Display&orderTag=%20fund.symb&order=ASC
Number of stocks returned = 18
Symbol price volume
ACGI 0.00020 5,000 0.24 0.31 0.25 0.16 0.24
AMLH 0.00020 13,080,900 0.18 -0.04 0.27 0.32 0.18
BIGG 0.00020 196,200 0.09 0.13 0.03 0.12 0.09
BTGI 0.00020 2,267,500 0.19 0.02 0.17 0.39 0.19
CWIR 0.00020 500,100 0.16 0.29 0.10 0.08 0.16
EWLL 0.00020 201,363,600 0.21 0.29 0.12 0.20 0.21
FBER 0.00020 200 0.13 0.12 0.09 0.16 0.13
IEVM 0.00020 10,000 0.17 0.14 0.08 0.27 0.17
LDSI 0.00020 2,200,000 0.09 0.17 0.06 0.04 0.09
NUUU 0.00020 5,075,000 0.17 0.07 0.08 0.36 0.17
NVIC 0.00020 25,000 0.05 -0.02 -0.03 0.20 0.05
PLYZ 0.00020 464,855,600 -0.14 0.08 -0.14 -0.36 -0.14
RETC 0.00020 12,660,000 0.18 0.14 0.21 0.19 0.18
SDVI 0.00020 26,448,600 0.18 0.10 0.06 0.38 0.18
TGRR 0.00020 6,211,700 0.12 -0.04 0.12 0.27 0.12
VAPE 0.00020 482,200 0.15 0.33 -0.06 0.17 0.15
VIBI 0.00020 8,258,900 0.16 0.18 0.08 0.21 0.16
VMRI 0.00020 1,100 0.15 0.05 0.17 0.23 0.15
Scan: 0.0002 Intermediate Bullish
http://www.stockta.com/cgi-bin/screen.pl?cobrand=&price=0.0002&price=0.0002&volume=&volume=&country=&technical=interAnal%3C.5+and+interAnal%3E%3D.25&action=Display&orderTag=%20volume&order=DESC
http://www.stockta.com/cgi-bin/screen.pl?cobrand=&price=0.0002&price=0.0002&volume=&volume=&country=&technical=interAnal%3C.5+and+interAnal%3E%3D.25&action=Display&orderTag=%20fund.symb&order=ASC
Number of stocks returned = 19
Symbol price volume
ACGI 0.00020 5,000 0.24 0.31 0.25 0.16 0.25
ACTL 0.00020 100,000 0.37 0.38 0.40 0.34 0.40
ADGO 0.00020 2,265,300 0.27 0.38 0.33 0.11 0.33
AFOM 0.00020 16,988,000 0.26 0.23 0.44 0.10 0.44
AMLH 0.00020 13,080,900 0.18 -0.04 0.27 0.32 0.27
APTY 0.00020 1,070,000 0.33 0.30 0.25 0.44 0.25
ASTI 0.00020 15,427,800 0.37 0.26 0.46 0.40 0.46
DSCR 0.00020 4,031,800 0.45 0.54 0.42 0.38 0.42
FPFI 0.00020 2,557,900 0.34 0.42 0.27 0.32 0.27
HYBE 0.00020 27,300 0.30 0.32 0.27 0.32 0.27
IGEX 0.00020 16,321,300 0.28 0.36 0.35 0.13 0.35
MEDT 0.00020 105,100 0.27 0.21 0.25 0.34 0.25
MJTV 0.00020 2,000,000 0.34 0.33 0.33 0.36 0.33
PHIL 0.00020 27,447,900 0.25 -0.04 0.48 0.33 0.48
SEGI 0.00020 1,000,200 0.36 0.36 0.27 0.46 0.27
SHMN 0.00020 12,100,000 0.35 0.29 0.35 0.41 0.35
TGGI 0.00020 9,618,300 0.33 0.37 0.38 0.24 0.38
WCVC 0.00020 13,427,300 0.32 0.35 0.40 0.23 0.40
XREG 0.00020 5,001,100 0.36 0.34 0.38 0.36 0.38
Scan: 0.0001 Overall Bullish
http://www.stockta.com/cgi-bin/screen.pl?cobrand=&price=0.0001&price=0.0001&volume=&volume=&country=&technical=overAnal%3C.5+and+overAnal%3E%3D.25&action=Display&orderTag=%20volume&order=DESC
http://www.stockta.com/cgi-bin/screen.pl?cobrand=&price=0.0001&price=0.0001&volume=&volume=&country=&technical=overAnal%3C.5+and+overAnal%3E%3D.25&action=Display&orderTag=%20fund.symb&order=ASC
Number of stocks returned = 20
Symbol price volume
AZFL 0.00010 30,000 0.25 0.19 0.29 0.28 0.25
CFGX 0.00010 13,501,600 0.29 0.19 0.29 0.38 0.29
FNRC 0.00010 1,000,000 0.29 0.19 0.29 0.39 0.29
GXXM 0.00010 2,250,000 0.29 0.19 0.29 0.39 0.29
IFXY 0.00010 1,015,000 0.33 0.27 0.33 0.38 0.33
INND 0.00010 44,939,700 0.26 0.26 0.33 0.19 0.26
IRNC 0.00010 2,574,000 0.30 0.20 0.33 0.36 0.30
JAMN 0.00010 31,449,300 0.26 0.36 0.10 0.31 0.26
KNSC 0.00010 500,000 0.28 0.19 0.29 0.35 0.28
MLHC 0.00010 1,250,000 0.29 0.19 0.29 0.38 0.29
MSPC 0.00010 500,300 0.29 0.19 0.29 0.39 0.29
NWTT 0.00010 15,000 0.29 0.19 0.29 0.39 0.29
NYXO 0.00010 20,000 0.27 0.19 0.29 0.34 0.27
PGPM 0.00010 1,553,300 0.26 0.36 0.23 0.20 0.26
QBAN 0.00010 100,000 0.29 0.19 0.29 0.39 0.29
SKYF 0.00010 100,000 0.27 0.19 0.21 0.40 0.27
TFRY 0.00010 29,000 0.32 0.33 0.29 0.33 0.32
TGRO 0.00010 325,000 0.29 0.19 0.29 0.38 0.29
VGID 0.00010 500,000 0.28 0.19 0.29 0.36 0.28
WNBD 0.00010 35,000 0.28 0.19 0.29 0.37 0.28
Scan: 0.0001 Overall Neutral
http://www.stockta.com/cgi-bin/screen.pl?cobrand=&price=0.0001&price=0.0001&volume=&volume=&country=&technical=overAnal%3C.25and+overAnal%3E-.25&action=Display&orderTag=%20volume&order=DESC
http://www.stockta.com/cgi-bin/screen.pl?cobrand=&price=0.0001&price=0.0001&volume=&volume=&country=&technical=overAnal%3C.25and+overAnal%3E-.25&action=Display&orderTag=%20fund.symb&order=ASC
Number of stocks returned = 80
Symbol price volume
AAPT 0.00010 500,000 0.17 0.000000 0.17 0.34 0.17
ABWN 0.00010 900,000 0.25 0.19 0.17 0.39 0.25
ADPAS 0.00010 1,637,000 0.11 0.02 0.08 0.23 0.11
ADTM 0.00010 1,300,000 0.25 0.19 0.17 0.39 0.25
AEXE 0.00010 3,109,700 0.20 -0.05 0.29 0.36 0.20
ANDI 0.00010 79,900 0.24 0.02 0.33 0.35 0.24
ASKE 0.00010 15,000 0.25 0.19 0.17 0.39 0.25
ATPT 0.00010 2,221,500 0.15 0.07 0.23 0.15 0.15
AXCG 0.00010 1,000,000 0.21 0.19 0.17 0.28 0.21
BAYP 0.00010 2,170,000 0.25 0.19 0.17 0.39 0.25
BEEI 0.00010 485,500 0.16 0.07 0.33 0.07 0.16
BFRE 0.00010 150,000 0.15 0.18 0.06 0.22 0.15
BLKG 0.00010 1,500,000 0.14 0.10 0.04 0.28 0.14
BLUU 0.00010 1,000,000 0.22 0.19 0.21 0.27 0.22
BMXC 0.00010 29,616,000 0.15 -0.03 0.12 0.36 0.15
BOTY 0.00010 1,000,000 0.18 0.19 0.08 0.28 0.18
CDIV 0.00010 1,000 0.17 0.19 0.21 0.11 0.17
CHIT 0.00010 1,010,100 0.19 0.19 0.12 0.26 0.19
CHNC 0.00010 6,501,200 0.20 0.19 0.17 0.24 0.20
CTLE 0.00010 24,022,000 0.25 0.33 0.06 0.34 0.25
CYPW 0.00010 4,000 0.22 0.12 0.15 0.39 0.22
DKAM 0.00010 3,800,000 0.18 0.26 0.02 0.27 0.18
DNRG 0.00010 1,498,900 0.10 0.06 0.08 0.14 0.10
DPLS 0.00010 1,410,000 0.21 0.08 0.19 0.36 0.21
ECOS 0.00010 883,300 0.25 0.19 0.17 0.39 0.25
EFLN 0.00010 1,722,300 0.11 0.19 0.04 0.11 0.11
ELRA 0.00010 400,100 0.25 0.19 0.17 0.38 0.25
ELTZ 0.00010 1,020,000 0.18 0.19 0.08 0.27 0.18
ETFM 0.00010 140,100 0.19 0.19 0.12 0.24 0.19
FARE 0.00010 1,006,800 0.10 -0.17 0.17 0.31 0.10
FBCD 0.00010 2,499,900 0.11 0.02 -0.06 0.36 0.11
FBEC 0.00010 1,050,000 0.25 0.19 0.17 0.39 0.25
FPVD 0.00010 400 0.21 0.27 -0.02 0.37 0.21
FTWS 0.00010 36,074,200 0.24 0.29 0.20 0.23 0.24
FUTL 0.00010 120,000 0.25 0.19 0.17 0.39 0.25
GNCP 0.00010 5,000,000 0.17 0.14 0.21 0.16 0.17
GRLF 0.00010 1,225,000 0.24 0.19 0.17 0.37 0.24
GRLT 0.00010 1,000,000 0.15 0.19 0.000000 0.27 0.15
GTGP 0.00010 190,700 0.18 0.10 0.08 0.35 0.18
GTLL 0.00010 600,000 0.18 0.19 0.08 0.28 0.18
GVSI 0.00010 3,090,000 0.21 0.19 0.17 0.28 0.21
HCTI 0.00010 8,000,000 0.25 0.19 0.17 0.39 0.25
HPIL 0.00010 1,000,000 0.21 0.19 0.17 0.27 0.21
HVCW 0.00010 1,360,000 0.23 0.19 0.12 0.36 0.23
IJJP 0.00010 200,000 0.23 0.17 0.19 0.32 0.23
ILIM 0.00010 27,540,900 0.14 0.02 0.06 0.34 0.14
LATF 0.00010 1,406,400 0.25 0.19 0.17 0.39 0.25
MAXD 0.00010 8,829,500 0.24 0.19 0.17 0.37 0.24
MINE 0.00010 11,030,700 0.16 -0.05 0.25 0.27 0.16
MJTK 0.00010 1,526,200 0.14 0.05 0.000000 0.36 0.14
MJWL 0.00010 415,000 0.03 -0.15 0.02 0.23 0.03
MNZO 0.00010 1,200 0.13 -0.02 0.15 0.27 0.13
MYDX 0.00010 5,410,000 0.14 -0.00 0.21 0.21 0.14
MYGG 0.00010 30,400 0.05 -0.08 0.08 0.16 0.05
NWGC 0.00010 10,640,000 0.15 0.09 0.12 0.22 0.15
OPMG 0.00010 200 0.21 0.21 0.15 0.27 0.21
OPMZ 0.00010 1,000,000 0.25 0.19 0.17 0.39 0.25
PDXP 0.00010 1,000,000 0.13 -0.02 0.17 0.23 0.13
PGFY 0.00010 1,000 0.23 0.10 0.21 0.38 0.23
PHMB 0.00010 100,000 0.17 0.19 0.17 0.16 0.17
PLSB 0.00010 200 0.22 0.19 0.21 0.25 0.22
PTOG 0.00010 13,100 0.13 0.05 0.08 0.26 0.13
PUDA 0.00010 19,300 0.11 0.07 0.02 0.23 0.11
QEDN 0.00010 220,000 0.22 0.18 0.15 0.33 0.22
RBCC 0.00010 100 -0.12 0.03 -0.12 -0.27 -0.12
RCMH 0.00010 400,000 0.18 0.10 0.08 0.36 0.18
RITE 0.00010 100,000 0.15 0.10 0.08 0.27 0.15
RNBI 0.00010 500 0.10 -0.05 0.12 0.23 0.10
SCIE 0.00010 140,000 0.23 0.19 0.21 0.28 0.23
SGLN 0.00010 589,000 0.18 0.12 0.19 0.24 0.18
SPRV 0.00010 2,018,100 0.22 0.19 0.12 0.34 0.22
SUTI 0.00010 7,553,700 0.11 -0.03 0.15 0.23 0.11
SVTE 0.00010 500,000 0.25 0.19 0.17 0.39 0.25
TONR 0.00010 30,000 0.24 0.19 0.17 0.37 0.24
UBQU 0.00010 984,400 0.25 0.19 0.17 0.39 0.25
UPZS 0.00010 8,195,000 0.15 0.20 0.10 0.14 0.15
USEI 0.00010 4,966,900 0.15 0.07 0.04 0.34 0.15
VPER 0.00010 330,000 0.24 0.19 0.17 0.37 0.24
XMET 0.00010 6,302,000 0.15 0.19 0.000000 0.27 0.15
XSPT 0.00010 12,866,100 0.06 -0.07 0.02 0.23 0.06
Scan: 0.0001 Intermediate Bullish
http://www.stockta.com/cgi-bin/screen.pl?cobrand=&price=0.0001&price=0.0001&volume=&volume=&country=&technical=interAnal%3C.5+and+interAnal%3E%3D.25&action=Display&orderTag=%20volume&order=DESC
http://www.stockta.com/cgi-bin/screen.pl?cobrand=&price=0.0001&price=0.0001&volume=&volume=&country=&technical=interAnal%3C.5+and+interAnal%3E%3D.25&action=Display&orderTag=%20fund.symb&order=ASC
Number of stocks returned = 20
Symbol price volume
AEXE 0.00010 3,109,700 0.20 -0.05 0.29 0.36 0.29
ANDI 0.00010 79,900 0.24 0.02 0.33 0.35 0.33
AZFL 0.00010 30,000 0.25 0.19 0.29 0.28 0.29
BEEI 0.00010 485,500 0.16 0.07 0.33 0.07 0.33
CFGX 0.00010 13,501,600 0.29 0.19 0.29 0.38 0.29
GXXM 0.00010 2,250,000 0.29 0.19 0.29 0.39 0.29
IFXY 0.00010 1,015,000 0.33 0.27 0.33 0.38 0.33
INND 0.00010 44,939,700 0.26 0.26 0.33 0.19 0.33
IRNC 0.00010 2,574,000 0.30 0.20 0.33 0.36 0.33
KNSC 0.00010 500,000 0.28 0.19 0.29 0.35 0.29
MINE 0.00010 11,030,700 0.16 -0.05 0.25 0.27 0.25
MLHC 0.00010 1,250,000 0.29 0.19 0.29 0.38 0.29
MSPC 0.00010 500,300 0.29 0.19 0.29 0.39 0.29
NWTT 0.00010 15,000 0.29 0.19 0.29 0.39 0.29
NYXO 0.00010 20,000 0.27 0.19 0.29 0.34 0.29
QBAN 0.00010 100,000 0.29 0.19 0.29 0.39 0.29
TFRY 0.00010 29,000 0.32 0.33 0.29 0.33 0.29
TGRO 0.00010 325,000 0.29 0.19 0.29 0.38 0.29
VGID 0.00010 500,000 0.28 0.19 0.29 0.36 0.29
WNBD 0.00010 35,000 0.28 0.19 0.29 0.37 0.29
for Thursday, June 18, 2020
Developed by: Trader53

________________________________________________________________
Trader53's Wealth Strategy
https://investorshub.advfn.com/boards/read_msg.aspx?message_id=127409561
* Buy 2 Million Shares of every 0.0001 that you like !
* Most 0.0001's will climb to 0.0003 / 0.0004
* Many 0.0001's will climb to 0.0012 and Higher
* Some 0.0001's will climb to $0.01 and Higher
________________________________________________________________
Triple 000 Traders - It's Time To Get Loaded!
https://investorshub.advfn.com/boards/read_msg.aspx?message_id=147899327
* Buy 2 Million Shares of every 0.0001 that you like !
http://investorshub.advfn.com/boards/read_msg.aspx?message_id=127409561
* Always try to Buy at 0.0001
https://investorshub.advfn.com/boards/read_msg.aspx?message_id=135552117
________________________________________________________________
I'll Alert you of stocks to Buy,
before the Run happens !

________________________________________________________________
Note:
This Boards objective,
is to make MONEY for its readers,
by ALERTING them to stocks that are ready to Buy,
before they have their move-up and their "RUN".
________________________________________________________________
Market Maker Signals - Explained
Market Maker Signals
Penny traders believe that Market Makers (MM)
will "signal" moves in advance buy using
small amounts of buys or sells as "signals".
The "signals" are such a small amount of shares
(worth no more than 5 or 10 dollars) that
no trader would have paid a commission that
costs more than the amount of shares bought.
The "signals" are from one MM to another.
100 - I need shares.
200 - I need shares badly, but do not take the stock down.
300 - Take the price down so I can load shares
400 - Keep trading it sideways.
500 - Gap the stock.
This gap can be either up or down,
depending on the direction of the 500 signal.
505 - I am short on shares
600 - Means provide resistance
900 - Means let the stock float
911 - Pending News/Press Release On The Way
1000 - Don't let it run
2100 - Let it run
http://www.pennystockdream.com/Market-Maker-Signals
Understanding the Form T-Trade:
If a market maker wants to accumulate
a large amount of a stock in one trading day,
that market maker may actually not report
any of the trades that occurred
until the trading day has ended
so as not to alert the market to the collection.
http://investorshub.advfn.com/boards/read_msg.aspx?message_id=120820833&txt2find=understanding
________________________________________________________________
________________________________________________________________
Stock Scores Chart Links
https://www.stockscores.com/charts/charts/?ticker=%24SPX
http://stockcharts.com/h-sc/ui?s=%24SPX&p=D&yr=3&mn=0&dy=0&id=p16291900332
________________________________________________________________
StockTA.com Screen
http://www.stockta.com/
http://www.stockta.com/cgi-bin/screen.pl
________________________________________________________________
Scan: Long-Term Bullish Breakout
http://www.stockta.com/cgi-bin/screen.pl?cobrand=&price=&price=0.005&volume=&volume=&country=&alert=33&action=Display&orderTag=%20price&order=ASC
Symbol price volume
FTWS 0.00010 36,074,200 0.24 0.29 0.20 0.23
SKYF 0.00010 100,000 0.27 0.19 0.21 0.40
VAPE 0.00020 482,200 0.15 0.33 -0.06 0.17
RETC 0.00020 12,660,000 0.18 0.14 0.21 0.19
IGEX 0.00020 16,321,300 0.28 0.36 0.35 0.13
IMTL 0.00020 3,870,000 0.35 0.30 0.50 0.24
ACGI 0.00020 5,000 0.24 0.31 0.25 0.16
BIGG 0.00020 196,200 0.09 0.13 0.03 0.12
SDVI 0.00020 26,448,600 0.18 0.10 0.06 0.38
XSNX 0.00030 2,538,200 0.28 0.38 0.33 0.11
ESPIQ 0.00030 39,800 0.16 0.23 0.04 0.21
SFOR 0.00040 81,977,800 0.15 0.41 0.01 0.03
AFTC 0.00050 100,000 0.34 0.12 0.46 0.45
KPAY 0.00060 4,424,200 0.17 0.24 0.19 0.08
FONU 0.00060 15,774,100 0.28 0.23 0.12 0.49
SSOF 0.00070 247,500 0.24 0.19 0.44 0.10
AVEW 0.00070 50,000 0.48 0.32 0.49 0.63
PTOP 0.00070 14,569,300 0.34 0.25 0.44 0.33
ARWD 0.00070 100,000 0.05 0.14 -0.01 0.03
ARSN 0.00080 50,961,700 0.23 0.30 0.44 -0.04
CZNI 0.00110 7,648,800 0.21 0.04 -0.02 0.61
TISDZ 0.00120 1,600 0.22 0.21 0.34 0.11
GMNI 0.00140 97,000 0.25 0.28 0.35 0.12
IDVV 0.00150 29,900 0.14 0.18 0.14 0.11
SPRL 0.00170 357,000 0.23 0.30 0.42 -0.04
CFE.AU 0.00200 621,429 0.09 -0.03 0.12 0.18
Scan: Short-Term Bullish Breakout
http://www.stockta.com/cgi-bin/screen.pl?cobrand=&price=&price=0.005&volume=&volume=&country=&alert=41&action=Display&orderTag=%20price&order=ASC
Symbol price volume
SFOR 0.00040 81,977,800 0.15 0.41 0.01 0.03
IPAH 0.00070 5,000 0.41 0.48 0.48 0.28
EMBR 0.00070 1,360,000 0.30 0.54 0.27 0.09
BYRG 0.00080 1,706,900 0.42 0.43 0.31 0.52
VSPC 0.00080 25,400 0.20 0.16 0.17 0.27
VGTL 0.00080 4,172,700 0.27 0.25 0.27 0.28
PLPL 0.00090 920,600 0.26 0.34 0.06 0.38
BIEI 0.00110 27,168,300 0.21 0.24 0.12 0.26
ITKH 0.00120 202,000 0.33 0.51 0.29 0.17
PFNO 0.00120 20,518,300 0.36 0.38 0.19 0.50
GACR 0.00130 1,270,500 0.48 0.61 0.31 0.51
PTSC 0.00130 1,155,900 0.24 0.24 0.06 0.40
BABL 0.00160 10,000 0.29 0.13 0.35 0.39
VHUB 0.00160 5,000 0.15 0.01 0.10 0.33
IMNPQ 0.00190 673,300 0.31 0.42 0.21 0.29
GAHC 0.00190 5,445,500 0.08 0.01 0.06 0.16
AOA.AU 0.00200 0 0.32 0.39 0.27 0.29
INTK 0.00200 2,792,400 0.37 0.35 0.38 0.37
Scan: ABC Down
http://www.stockta.com/cgi-bin/screen.pl?technical=shortFib<=-.66&technical=interFib<=-.5&technical=longFib<=-.55&action=Display&cobrand=&orderTag=%20price&order=ASC&start=0
Number of stocks returned = 303
Symbol price volume - short Fib - inter Fib - long Fib
MYGG 0.00010 30,400 0.05 -0.08 0.08 0.16 -1.00 -1.00 -1.00
ATPT 0.00010 2,221,500 0.15 0.07 0.23 0.15 -1.00 -1.00 -1.00
LDHL 0.00020 15,200 -0.34 -0.28 -0.36 -0.39 -1.00 -1.00 -1.00
FBER 0.00020 200 0.13 0.12 0.09 0.16 -1.00 -1.00 -1.00
NVIC 0.00020 25,000 0.05 -0.02 -0.03 0.20 -1.00 -1.00 -1.00
TRBO 0.00030 595,000 -0.00 -0.02 0.08 -0.07 -1.00 -1.00 -1.00
PCLI 0.00040 338,500 0.08 0.10 0.03 0.11 -1.00 -1.00 -1.00
XYNH 0.00050 3,000 0.10 0.07 0.08 0.16 -1.00 -1.00 -1.00
SYNJ 0.00060 23,000 0.04 -0.05 0.05 0.10 -1.00 -1.00 -1.00
ROTH 0.00070 15,000 0.08 0.07 0.06 0.11 -1.00 -1.00 -1.00
DRSV 0.00100 10,000 0.08 -0.01 0.09 0.15 -1.00 -1.00 -1.00
AXXDF 0.00100 600 -0.61 -0.68 -0.52 -0.62 -1.00 -1.00 -1.00
RGBPP 0.00110 1,400 0.05 -0.02 0.03 0.13 -1.00 -1.00 -1.00
RYMM 0.00120 100,000 0.04 -0.01 0.06 0.06 -1.00 -1.00 -1.00
SSTU 0.00120 46,000 -0.14 -0.09 -0.05 -0.26 -1.00 -1.00 -1.00
PXYN 0.00150 1,206,100 0.15 0.19 0.14 0.13 -1.00 -1.00 -1.00
MYSN 0.00170 2,300 -0.07 0.10 -0.12 -0.18 -1.00 -1.00 -1.00
BZTG 0.00180 120,000 0.09 0.09 0.08 0.08 -1.00 -1.00 -1.00
Scan: 0.0003 Overall Bullish
http://www.stockta.com/cgi-bin/screen.pl?cobrand=&price=0.0003&price=0.0003&volume=&volume=&country=&technical=overAnal%3C.5+and+overAnal%3E%3D.25&action=Display&orderTag=%20volume&order=DESC
http://www.stockta.com/cgi-bin/screen.pl?cobrand=&price=0.0003&price=0.0003&volume=&volume=&country=&technical=overAnal%3C.5+and+overAnal%3E%3D.25&action=Display&orderTag=%20fund.symb&order=ASC
Number of stocks returned = 14
Symbol price volume
AAGC 0.00030 3,725,500 0.32 0.32 0.23 0.40 0.32
EGOC 0.00030 4,035,700 0.36 0.45 0.35 0.28 0.36
FERN 0.00030 200 0.36 0.21 0.48 0.39 0.36
GEGI 0.00030 1,037,000 0.49 0.59 0.46 0.44 0.49
GFTX 0.00030 3,700,000 0.29 0.31 0.42 0.14 0.29
HYWI 0.00030 16,622,400 0.28 0.40 0.17 0.29 0.28
ICLD 0.00030 449,500 0.27 0.35 0.10 0.35 0.27
IDCN 0.00030 1,485,100 0.45 0.54 0.46 0.34 0.45
LVGI 0.00030 10,273,800 0.45 0.57 0.40 0.38 0.45
SRMX 0.00030 1,401,700 0.30 0.29 0.21 0.39 0.30
VNUE 0.00030 3,578,100 0.35 0.23 0.44 0.39 0.35
VPOR 0.00030 14,906,600 0.34 0.09 0.54 0.39 0.34
XSNX 0.00030 2,538,200 0.28 0.38 0.33 0.11 0.28
ZONX 0.00030 1,023,400 0.38 0.33 0.40 0.40 0.38
Scan: 0.0003 Overall Neutral
http://www.stockta.com/cgi-bin/screen.pl?cobrand=&price=0.0003&price=0.0003&volume=&volume=&country=&technical=overAnal%3C.25and+overAnal%3E-.25&action=Display&orderTag=%20volume&order=DESC
http://www.stockta.com/cgi-bin/screen.pl?cobrand=&price=0.0003&price=0.0003&volume=&volume=&country=&technical=overAnal%3C.25and+overAnal%3E-.25&action=Display&orderTag=%20fund.symb&order=ASC
Number of stocks returned = 16
Symbol price volume
AVVH 0.00030 410,000 0.17 0.21 0.06 0.23 0.17
DUTV 0.00030 12,500 0.23 0.24 0.10 0.34 0.23
ECIGQ 0.00030 18,500 0.21 0.13 0.23 0.26 0.21
ESPIQ 0.00030 39,800 0.16 0.23 0.04 0.21 0.16
GNLKQ 0.00030 400 0.14 0.19 0.02 0.19 0.14
HQGE 0.00030 46,293,400 0.06 -0.02 -0.05 0.25 0.06
OMHE 0.00030 27,300 0.20 0.20 0.19 0.22 0.20
PDGO 0.00030 5,160,000 0.19 0.13 0.17 0.27 0.19
PLNTQ 0.00030 1,000 0.22 0.02 0.23 0.39 0.22
RNVA 0.00030 225,429,800 0.16 0.21 0.06 0.20 0.16
SCTN 0.00030 1,000 0.15 0.14 0.04 0.26 0.15
SLJB 0.00030 100,000 0.21 0.17 0.17 0.29 0.21
SNRY 0.00030 7,501,000 0.25 0.45 0.02 0.28 0.25
TMGI 0.00030 2,464,600 0.15 0.10 0.25 0.11 0.15
TNKE 0.00030 280,000 0.13 0.15 0.21 0.02 0.13
TRBO 0.00030 595,000 -0.00 -0.02 0.08 -0.07 -0.00
Scan: 0.0002 Overall Bullish
http://www.stockta.com/cgi-bin/screen.pl?cobrand=&price=0.0002&price=0.0002&volume=&volume=&country=&technical=overAnal%3C.5+and+overAnal%3E%3D.25&action=Display&orderTag=%20volume&order=DESC
http://www.stockta.com/cgi-bin/screen.pl?cobrand=&price=0.0002&price=0.0002&volume=&volume=&country=&technical=overAnal%3C.5+and+overAnal%3E%3D.25&action=Display&orderTag=%20fund.symb&order=ASC
Number of stocks returned = 28
Symbol price volume
ACTL 0.00020 100,000 0.37 0.38 0.40 0.34 0.37
ADGO 0.00020 2,265,300 0.27 0.38 0.33 0.11 0.27
AFOM 0.00020 16,988,000 0.26 0.23 0.44 0.10 0.26
APTY 0.00020 1,070,000 0.33 0.30 0.25 0.44 0.33
ASTI 0.00020 15,427,800 0.37 0.26 0.46 0.40 0.37
DSCR 0.00020 4,031,800 0.45 0.54 0.42 0.38 0.45
ETEK 0.00020 5,150,000 0.35 0.58 0.12 0.33 0.35
FPFI 0.00020 2,557,900 0.34 0.42 0.27 0.32 0.34
GGII 0.00020 1,012,500 0.32 0.49 0.08 0.38 0.32
HIHI 0.00020 908,300 0.33 0.40 0.21 0.40 0.33
HYBE 0.00020 27,300 0.30 0.32 0.27 0.32 0.30
IBRC 0.00020 773,373,500 0.27 0.10 0.52 0.20 0.27
IGEX 0.00020 16,321,300 0.28 0.36 0.35 0.13 0.28
ILST 0.00020 200,000 0.25 0.40 0.04 0.31 0.25
IMTL 0.00020 3,870,000 0.35 0.30 0.50 0.24 0.35
KATX 0.00020 50,000 0.33 0.35 0.19 0.46 0.33
MEDT 0.00020 105,100 0.27 0.21 0.25 0.34 0.27
MJTV 0.00020 2,000,000 0.34 0.33 0.33 0.36 0.34
NNRX 0.00020 9,452,400 0.28 -0.01 0.58 0.27 0.28
NOUV 0.00020 6,765,000 0.31 0.49 0.12 0.31 0.31
PHIL 0.00020 27,447,900 0.25 -0.04 0.48 0.33 0.25
SEGI 0.00020 1,000,200 0.36 0.36 0.27 0.46 0.36
SHMN 0.00020 12,100,000 0.35 0.29 0.35 0.41 0.35
TGGI 0.00020 9,618,300 0.33 0.37 0.38 0.24 0.33
USMJ 0.00020 10,828,600 0.33 0.52 0.17 0.31 0.33
VOIS 0.00020 120,100 0.26 0.34 0.10 0.33 0.26
WCVC 0.00020 13,427,300 0.32 0.35 0.40 0.23 0.32
XREG 0.00020 5,001,100 0.36 0.34 0.38 0.36 0.36
Scan: 0.0002 Overall Neutral
http://www.stockta.com/cgi-bin/screen.pl?cobrand=&price=0.0002&price=0.0002&volume=&volume=&country=&technical=overAnal%3C.25and+overAnal%3E-.25&action=Display&orderTag=%20volume&order=DESC
http://www.stockta.com/cgi-bin/screen.pl?cobrand=&price=0.0002&price=0.0002&volume=&volume=&country=&technical=overAnal%3C.25and+overAnal%3E-.25&action=Display&orderTag=%20fund.symb&order=ASC
Number of stocks returned = 18
Symbol price volume
ACGI 0.00020 5,000 0.24 0.31 0.25 0.16 0.24
AMLH 0.00020 13,080,900 0.18 -0.04 0.27 0.32 0.18
BIGG 0.00020 196,200 0.09 0.13 0.03 0.12 0.09
BTGI 0.00020 2,267,500 0.19 0.02 0.17 0.39 0.19
CWIR 0.00020 500,100 0.16 0.29 0.10 0.08 0.16
EWLL 0.00020 201,363,600 0.21 0.29 0.12 0.20 0.21
FBER 0.00020 200 0.13 0.12 0.09 0.16 0.13
IEVM 0.00020 10,000 0.17 0.14 0.08 0.27 0.17
LDSI 0.00020 2,200,000 0.09 0.17 0.06 0.04 0.09
NUUU 0.00020 5,075,000 0.17 0.07 0.08 0.36 0.17
NVIC 0.00020 25,000 0.05 -0.02 -0.03 0.20 0.05
PLYZ 0.00020 464,855,600 -0.14 0.08 -0.14 -0.36 -0.14
RETC 0.00020 12,660,000 0.18 0.14 0.21 0.19 0.18
SDVI 0.00020 26,448,600 0.18 0.10 0.06 0.38 0.18
TGRR 0.00020 6,211,700 0.12 -0.04 0.12 0.27 0.12
VAPE 0.00020 482,200 0.15 0.33 -0.06 0.17 0.15
VIBI 0.00020 8,258,900 0.16 0.18 0.08 0.21 0.16
VMRI 0.00020 1,100 0.15 0.05 0.17 0.23 0.15
Scan: 0.0002 Intermediate Bullish
http://www.stockta.com/cgi-bin/screen.pl?cobrand=&price=0.0002&price=0.0002&volume=&volume=&country=&technical=interAnal%3C.5+and+interAnal%3E%3D.25&action=Display&orderTag=%20volume&order=DESC
http://www.stockta.com/cgi-bin/screen.pl?cobrand=&price=0.0002&price=0.0002&volume=&volume=&country=&technical=interAnal%3C.5+and+interAnal%3E%3D.25&action=Display&orderTag=%20fund.symb&order=ASC
Number of stocks returned = 19
Symbol price volume
ACGI 0.00020 5,000 0.24 0.31 0.25 0.16 0.25
ACTL 0.00020 100,000 0.37 0.38 0.40 0.34 0.40
ADGO 0.00020 2,265,300 0.27 0.38 0.33 0.11 0.33
AFOM 0.00020 16,988,000 0.26 0.23 0.44 0.10 0.44
AMLH 0.00020 13,080,900 0.18 -0.04 0.27 0.32 0.27
APTY 0.00020 1,070,000 0.33 0.30 0.25 0.44 0.25
ASTI 0.00020 15,427,800 0.37 0.26 0.46 0.40 0.46
DSCR 0.00020 4,031,800 0.45 0.54 0.42 0.38 0.42
FPFI 0.00020 2,557,900 0.34 0.42 0.27 0.32 0.27
HYBE 0.00020 27,300 0.30 0.32 0.27 0.32 0.27
IGEX 0.00020 16,321,300 0.28 0.36 0.35 0.13 0.35
MEDT 0.00020 105,100 0.27 0.21 0.25 0.34 0.25
MJTV 0.00020 2,000,000 0.34 0.33 0.33 0.36 0.33
PHIL 0.00020 27,447,900 0.25 -0.04 0.48 0.33 0.48
SEGI 0.00020 1,000,200 0.36 0.36 0.27 0.46 0.27
SHMN 0.00020 12,100,000 0.35 0.29 0.35 0.41 0.35
TGGI 0.00020 9,618,300 0.33 0.37 0.38 0.24 0.38
WCVC 0.00020 13,427,300 0.32 0.35 0.40 0.23 0.40
XREG 0.00020 5,001,100 0.36 0.34 0.38 0.36 0.38
Scan: 0.0001 Overall Bullish
http://www.stockta.com/cgi-bin/screen.pl?cobrand=&price=0.0001&price=0.0001&volume=&volume=&country=&technical=overAnal%3C.5+and+overAnal%3E%3D.25&action=Display&orderTag=%20volume&order=DESC
http://www.stockta.com/cgi-bin/screen.pl?cobrand=&price=0.0001&price=0.0001&volume=&volume=&country=&technical=overAnal%3C.5+and+overAnal%3E%3D.25&action=Display&orderTag=%20fund.symb&order=ASC
Number of stocks returned = 20
Symbol price volume
AZFL 0.00010 30,000 0.25 0.19 0.29 0.28 0.25
CFGX 0.00010 13,501,600 0.29 0.19 0.29 0.38 0.29
FNRC 0.00010 1,000,000 0.29 0.19 0.29 0.39 0.29
GXXM 0.00010 2,250,000 0.29 0.19 0.29 0.39 0.29
IFXY 0.00010 1,015,000 0.33 0.27 0.33 0.38 0.33
INND 0.00010 44,939,700 0.26 0.26 0.33 0.19 0.26
IRNC 0.00010 2,574,000 0.30 0.20 0.33 0.36 0.30
JAMN 0.00010 31,449,300 0.26 0.36 0.10 0.31 0.26
KNSC 0.00010 500,000 0.28 0.19 0.29 0.35 0.28
MLHC 0.00010 1,250,000 0.29 0.19 0.29 0.38 0.29
MSPC 0.00010 500,300 0.29 0.19 0.29 0.39 0.29
NWTT 0.00010 15,000 0.29 0.19 0.29 0.39 0.29
NYXO 0.00010 20,000 0.27 0.19 0.29 0.34 0.27
PGPM 0.00010 1,553,300 0.26 0.36 0.23 0.20 0.26
QBAN 0.00010 100,000 0.29 0.19 0.29 0.39 0.29
SKYF 0.00010 100,000 0.27 0.19 0.21 0.40 0.27
TFRY 0.00010 29,000 0.32 0.33 0.29 0.33 0.32
TGRO 0.00010 325,000 0.29 0.19 0.29 0.38 0.29
VGID 0.00010 500,000 0.28 0.19 0.29 0.36 0.28
WNBD 0.00010 35,000 0.28 0.19 0.29 0.37 0.28
Scan: 0.0001 Overall Neutral
http://www.stockta.com/cgi-bin/screen.pl?cobrand=&price=0.0001&price=0.0001&volume=&volume=&country=&technical=overAnal%3C.25and+overAnal%3E-.25&action=Display&orderTag=%20volume&order=DESC
http://www.stockta.com/cgi-bin/screen.pl?cobrand=&price=0.0001&price=0.0001&volume=&volume=&country=&technical=overAnal%3C.25and+overAnal%3E-.25&action=Display&orderTag=%20fund.symb&order=ASC
Number of stocks returned = 80
Symbol price volume
AAPT 0.00010 500,000 0.17 0.000000 0.17 0.34 0.17
ABWN 0.00010 900,000 0.25 0.19 0.17 0.39 0.25
ADPAS 0.00010 1,637,000 0.11 0.02 0.08 0.23 0.11
ADTM 0.00010 1,300,000 0.25 0.19 0.17 0.39 0.25
AEXE 0.00010 3,109,700 0.20 -0.05 0.29 0.36 0.20
ANDI 0.00010 79,900 0.24 0.02 0.33 0.35 0.24
ASKE 0.00010 15,000 0.25 0.19 0.17 0.39 0.25
ATPT 0.00010 2,221,500 0.15 0.07 0.23 0.15 0.15
AXCG 0.00010 1,000,000 0.21 0.19 0.17 0.28 0.21
BAYP 0.00010 2,170,000 0.25 0.19 0.17 0.39 0.25
BEEI 0.00010 485,500 0.16 0.07 0.33 0.07 0.16
BFRE 0.00010 150,000 0.15 0.18 0.06 0.22 0.15
BLKG 0.00010 1,500,000 0.14 0.10 0.04 0.28 0.14
BLUU 0.00010 1,000,000 0.22 0.19 0.21 0.27 0.22
BMXC 0.00010 29,616,000 0.15 -0.03 0.12 0.36 0.15
BOTY 0.00010 1,000,000 0.18 0.19 0.08 0.28 0.18
CDIV 0.00010 1,000 0.17 0.19 0.21 0.11 0.17
CHIT 0.00010 1,010,100 0.19 0.19 0.12 0.26 0.19
CHNC 0.00010 6,501,200 0.20 0.19 0.17 0.24 0.20
CTLE 0.00010 24,022,000 0.25 0.33 0.06 0.34 0.25
CYPW 0.00010 4,000 0.22 0.12 0.15 0.39 0.22
DKAM 0.00010 3,800,000 0.18 0.26 0.02 0.27 0.18
DNRG 0.00010 1,498,900 0.10 0.06 0.08 0.14 0.10
DPLS 0.00010 1,410,000 0.21 0.08 0.19 0.36 0.21
ECOS 0.00010 883,300 0.25 0.19 0.17 0.39 0.25
EFLN 0.00010 1,722,300 0.11 0.19 0.04 0.11 0.11
ELRA 0.00010 400,100 0.25 0.19 0.17 0.38 0.25
ELTZ 0.00010 1,020,000 0.18 0.19 0.08 0.27 0.18
ETFM 0.00010 140,100 0.19 0.19 0.12 0.24 0.19
FARE 0.00010 1,006,800 0.10 -0.17 0.17 0.31 0.10
FBCD 0.00010 2,499,900 0.11 0.02 -0.06 0.36 0.11
FBEC 0.00010 1,050,000 0.25 0.19 0.17 0.39 0.25
FPVD 0.00010 400 0.21 0.27 -0.02 0.37 0.21
FTWS 0.00010 36,074,200 0.24 0.29 0.20 0.23 0.24
FUTL 0.00010 120,000 0.25 0.19 0.17 0.39 0.25
GNCP 0.00010 5,000,000 0.17 0.14 0.21 0.16 0.17
GRLF 0.00010 1,225,000 0.24 0.19 0.17 0.37 0.24
GRLT 0.00010 1,000,000 0.15 0.19 0.000000 0.27 0.15
GTGP 0.00010 190,700 0.18 0.10 0.08 0.35 0.18
GTLL 0.00010 600,000 0.18 0.19 0.08 0.28 0.18
GVSI 0.00010 3,090,000 0.21 0.19 0.17 0.28 0.21
HCTI 0.00010 8,000,000 0.25 0.19 0.17 0.39 0.25
HPIL 0.00010 1,000,000 0.21 0.19 0.17 0.27 0.21
HVCW 0.00010 1,360,000 0.23 0.19 0.12 0.36 0.23
IJJP 0.00010 200,000 0.23 0.17 0.19 0.32 0.23
ILIM 0.00010 27,540,900 0.14 0.02 0.06 0.34 0.14
LATF 0.00010 1,406,400 0.25 0.19 0.17 0.39 0.25
MAXD 0.00010 8,829,500 0.24 0.19 0.17 0.37 0.24
MINE 0.00010 11,030,700 0.16 -0.05 0.25 0.27 0.16
MJTK 0.00010 1,526,200 0.14 0.05 0.000000 0.36 0.14
MJWL 0.00010 415,000 0.03 -0.15 0.02 0.23 0.03
MNZO 0.00010 1,200 0.13 -0.02 0.15 0.27 0.13
MYDX 0.00010 5,410,000 0.14 -0.00 0.21 0.21 0.14
MYGG 0.00010 30,400 0.05 -0.08 0.08 0.16 0.05
NWGC 0.00010 10,640,000 0.15 0.09 0.12 0.22 0.15
OPMG 0.00010 200 0.21 0.21 0.15 0.27 0.21
OPMZ 0.00010 1,000,000 0.25 0.19 0.17 0.39 0.25
PDXP 0.00010 1,000,000 0.13 -0.02 0.17 0.23 0.13
PGFY 0.00010 1,000 0.23 0.10 0.21 0.38 0.23
PHMB 0.00010 100,000 0.17 0.19 0.17 0.16 0.17
PLSB 0.00010 200 0.22 0.19 0.21 0.25 0.22
PTOG 0.00010 13,100 0.13 0.05 0.08 0.26 0.13
PUDA 0.00010 19,300 0.11 0.07 0.02 0.23 0.11
QEDN 0.00010 220,000 0.22 0.18 0.15 0.33 0.22
RBCC 0.00010 100 -0.12 0.03 -0.12 -0.27 -0.12
RCMH 0.00010 400,000 0.18 0.10 0.08 0.36 0.18
RITE 0.00010 100,000 0.15 0.10 0.08 0.27 0.15
RNBI 0.00010 500 0.10 -0.05 0.12 0.23 0.10
SCIE 0.00010 140,000 0.23 0.19 0.21 0.28 0.23
SGLN 0.00010 589,000 0.18 0.12 0.19 0.24 0.18
SPRV 0.00010 2,018,100 0.22 0.19 0.12 0.34 0.22
SUTI 0.00010 7,553,700 0.11 -0.03 0.15 0.23 0.11
SVTE 0.00010 500,000 0.25 0.19 0.17 0.39 0.25
TONR 0.00010 30,000 0.24 0.19 0.17 0.37 0.24
UBQU 0.00010 984,400 0.25 0.19 0.17 0.39 0.25
UPZS 0.00010 8,195,000 0.15 0.20 0.10 0.14 0.15
USEI 0.00010 4,966,900 0.15 0.07 0.04 0.34 0.15
VPER 0.00010 330,000 0.24 0.19 0.17 0.37 0.24
XMET 0.00010 6,302,000 0.15 0.19 0.000000 0.27 0.15
XSPT 0.00010 12,866,100 0.06 -0.07 0.02 0.23 0.06
Scan: 0.0001 Intermediate Bullish
http://www.stockta.com/cgi-bin/screen.pl?cobrand=&price=0.0001&price=0.0001&volume=&volume=&country=&technical=interAnal%3C.5+and+interAnal%3E%3D.25&action=Display&orderTag=%20volume&order=DESC
http://www.stockta.com/cgi-bin/screen.pl?cobrand=&price=0.0001&price=0.0001&volume=&volume=&country=&technical=interAnal%3C.5+and+interAnal%3E%3D.25&action=Display&orderTag=%20fund.symb&order=ASC
Number of stocks returned = 20
Symbol price volume
AEXE 0.00010 3,109,700 0.20 -0.05 0.29 0.36 0.29
ANDI 0.00010 79,900 0.24 0.02 0.33 0.35 0.33
AZFL 0.00010 30,000 0.25 0.19 0.29 0.28 0.29
BEEI 0.00010 485,500 0.16 0.07 0.33 0.07 0.33
CFGX 0.00010 13,501,600 0.29 0.19 0.29 0.38 0.29
GXXM 0.00010 2,250,000 0.29 0.19 0.29 0.39 0.29
IFXY 0.00010 1,015,000 0.33 0.27 0.33 0.38 0.33
INND 0.00010 44,939,700 0.26 0.26 0.33 0.19 0.33
IRNC 0.00010 2,574,000 0.30 0.20 0.33 0.36 0.33
KNSC 0.00010 500,000 0.28 0.19 0.29 0.35 0.29
MINE 0.00010 11,030,700 0.16 -0.05 0.25 0.27 0.25
MLHC 0.00010 1,250,000 0.29 0.19 0.29 0.38 0.29
MSPC 0.00010 500,300 0.29 0.19 0.29 0.39 0.29
NWTT 0.00010 15,000 0.29 0.19 0.29 0.39 0.29
NYXO 0.00010 20,000 0.27 0.19 0.29 0.34 0.29
QBAN 0.00010 100,000 0.29 0.19 0.29 0.39 0.29
TFRY 0.00010 29,000 0.32 0.33 0.29 0.33 0.29
TGRO 0.00010 325,000 0.29 0.19 0.29 0.38 0.29
VGID 0.00010 500,000 0.28 0.19 0.29 0.36 0.29
WNBD 0.00010 35,000 0.28 0.19 0.29 0.37 0.29


Discover What Traders Are Watching
Explore small cap ideas before they hit the headlines.


